OPEN-SOURCE SCRIPT
GD Momentum
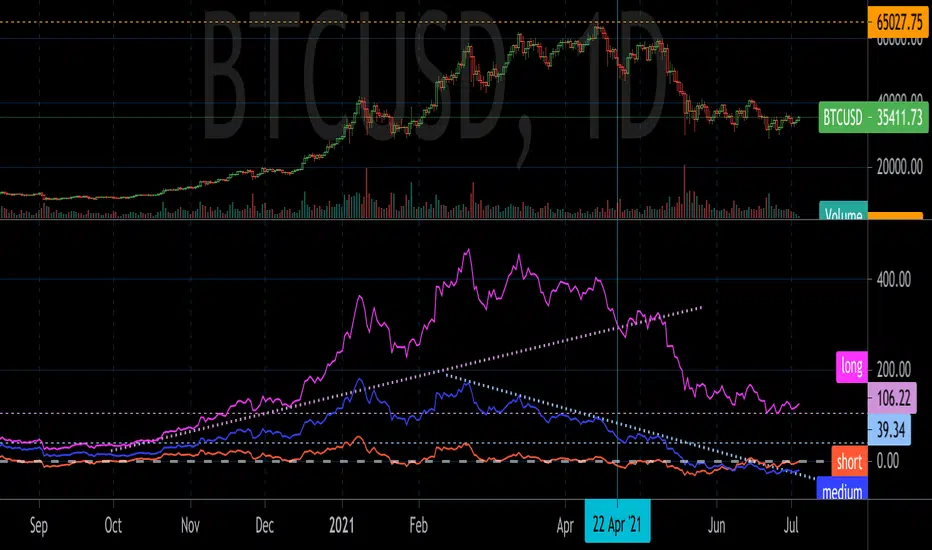
GD Momentum plots short, medium, and long term momentum indicators. The indicators are inspired by momentum structural analysis techniques, and are the % above or below different moving averages. The short term plot is the % above or below the 30 unit moving average, medium is 200 units, and long is 1000 units.
Draw trend lines and horizontal lines to identify the momentum structure and detect trend changes before they show up in price action.
Draw trend lines and horizontal lines to identify the momentum structure and detect trend changes before they show up in price action.
開源腳本
秉持TradingView一貫精神,這個腳本的創作者將其設為開源,以便交易者檢視並驗證其功能。向作者致敬!您可以免費使用此腳本,但請注意,重新發佈代碼需遵守我們的社群規範。
免責聲明
這些資訊和出版物並非旨在提供,也不構成TradingView提供或認可的任何形式的財務、投資、交易或其他類型的建議或推薦。請閱讀使用條款以了解更多資訊。
免責聲明
這些資訊和出版物並非旨在提供,也不構成TradingView提供或認可的任何形式的財務、投資、交易或其他類型的建議或推薦。請閱讀使用條款以了解更多資訊。