OPEN-SOURCE SCRIPT
Pearson vs Approx. Spearman Correlation
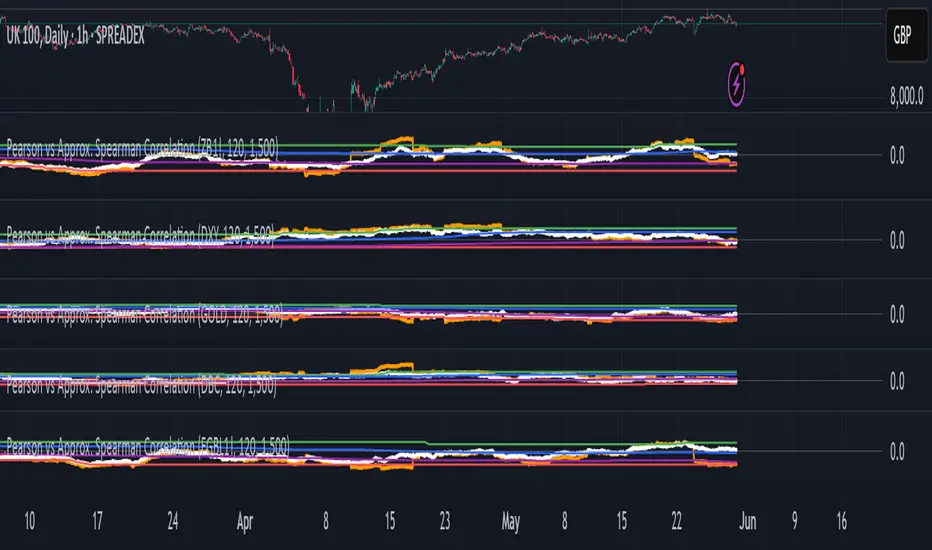
This indicator displays the rolling Pearson and approximate Spearman correlation between the chart's asset and a second user-defined asset, based on log returns over a customizable window.
Features:
- Pearson correlation of log returns (standard linear dependency measure)
- Approximate Spearman correlation, using percentile ranks to better capture nonlinear and monotonic relationships
/ Horizontal lines showing:
Maximum and minimum correlation values over a statistical window
1st quartile (25%) and 3rd quartile (75%) — helpful for identifying statistically high or low regimes
This script is useful for identifying dynamic co-movements, regime changes, or correlation breakdowns between assets — applicable in risk management, portfolio construction, and pairs trading strategies.
開源腳本
秉持TradingView一貫精神,這個腳本的創作者將其設為開源,以便交易者檢視並驗證其功能。向作者致敬!您可以免費使用此腳本,但請注意,重新發佈代碼需遵守我們的社群規範。
免責聲明
這些資訊和出版物並非旨在提供,也不構成TradingView提供或認可的任何形式的財務、投資、交易或其他類型的建議或推薦。請閱讀使用條款以了解更多資訊。
免責聲明
這些資訊和出版物並非旨在提供,也不構成TradingView提供或認可的任何形式的財務、投資、交易或其他類型的建議或推薦。請閱讀使用條款以了解更多資訊。