INVITE-ONLY SCRIPT
SRSI Bands
已更新
A modified version of SRSI
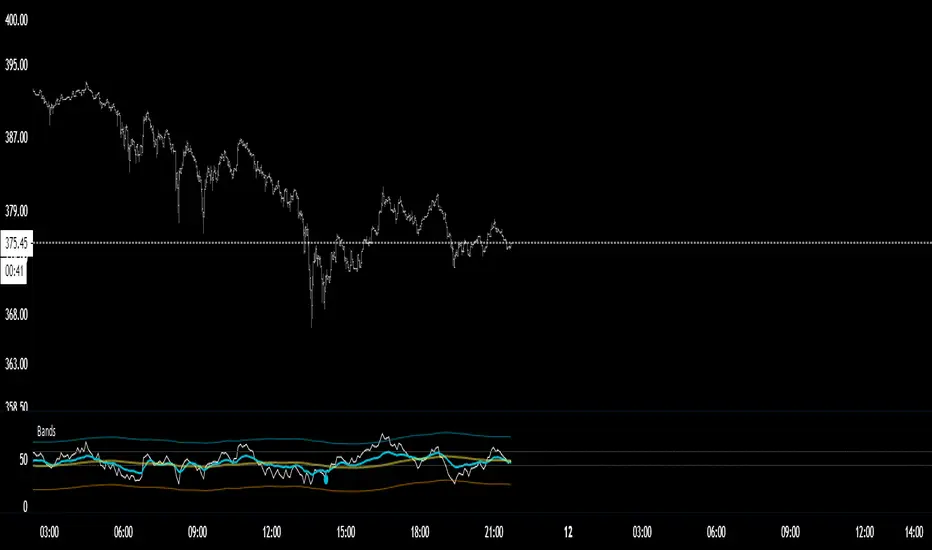
For some reason i had an idea to apply Bollinger Bands to my RSI but it never really worked so i decided to do something that gave me the exact context i wanted to see and that was a dynamic range that moved with the RSI
Instead of your standard fixed 80-20
Its simple
Same concepts apply as a regular RSI
What is key to know is that when RSI gets outside the band you are more likely to revers back inside the band which can provide for some really good take profit or entry points.
The blue line is the key line for overall momentum in regards to the mid band
when blue is above gold its bullish
When below its bearish
DM more for info on how to attain access.
Cheers
發布通知
added signal line and standard range lines for RSI :)
僅限邀請腳本
僅限作者授權的用戶訪問此腳本,並且通常需要付費。您可以將其增加到收藏腳本中,但是只有在向作者請求並獲得許可之後,才能使用它。 請聯繫SatoshiHeavy以了解更多信息,或按照下面作者的說明進行操作。
TradingView 不建議購買並使用此腳本,除非您 100% 信任其作者並了解腳本的工作原理。在許多情況下,您可以在我們的社群腳本中免費找到良好的開源替代方案。
想在圖表上使用此腳本?
警告:請閱讀,然後再請求訪問權限。
Have a plan. Trade it!
免責聲明
這些資訊和出版物並不意味著也不構成TradingView提供或認可的金融、投資、交易或其他類型的意見或建議。請在使用條款閱讀更多資訊。