PROTECTED SOURCE SCRIPT
Institutions Zones
Institutions Zone Tracker
This indicator automatically detects, draws, and manages institutional zones using refined order block logic. It is built to highlight high-probability reversal or breakout areas across any timeframe, with advanced zone management features that go beyond typical open-source versions.
How It Works
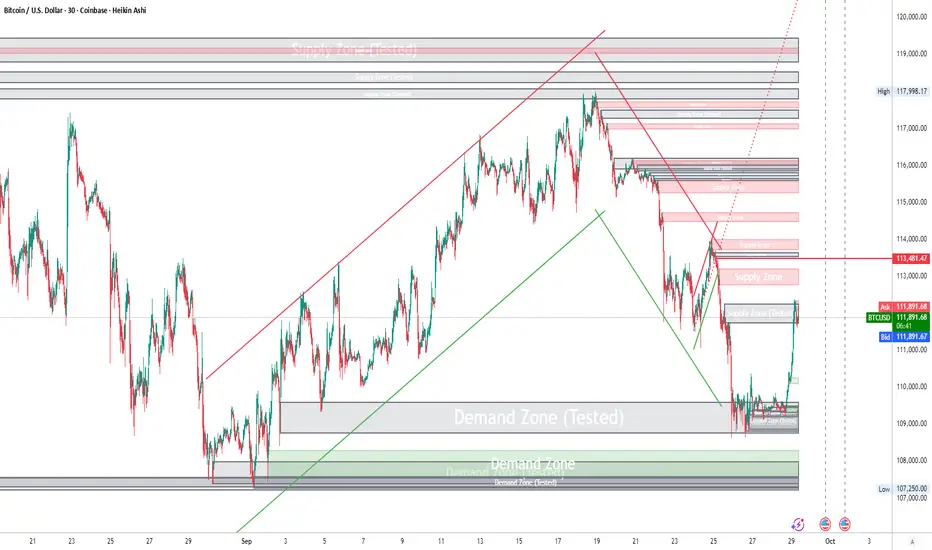
The script identifies price regions where significant institutional buying or selling has previously occurred and tracks how they evolve in real time:
Green = Areas of strong institutional buying interest.
Red = Areas of institutional selling interest.
Gray = Tested Zone: If price re-enters a previously drawn zone, it turns gray and relabels as “Tested,” signaling reduced reaction strength.
Unlike many standard supply/demand tools, this script includes automatic zone removal, tested-zone tracking, and no-repaint logic to maintain chart accuracy and reduce clutter.
Features
Dynamic zone creation and removal based on order block and mitigation rules.
Real-time updates with no repainting.
Visual clarity controls (adjustable transparency, labels inside zones).
Automatic zone lifecycle tracking, with clear status indicators (“Demand Zone,” “Supply Zone,” “Tested”).
How to Use
Apply the indicator to any chart and timeframe.
Use Demand Zones as potential long/swing-low areas and Supply Zones as potential short/swing-high areas.
When a zone turns gray, treat it as weakened — reactions may be less reliable.
Combine with your own technical or fundamental analysis for confirmation.
Best Practices
Pair with candlestick reversal signals or momentum indicators for higher accuracy.
Adjust tuning/mitigation parameters to fit your trading style and the asset’s volatility.
Use across multiple timeframes to validate institutional order flow alignment.
Why This Script Is Different
Most open-source supply/demand indicators only plot static zones. This script introduces:
Automatic zone removal to keep charts clean and relevant.
Dynamic “tested zone” logic that tracks weakening institutional levels.
Real-time, no-repaint drawing, ensuring zones remain accurate as price action evolves.
These unique features make the tool more practical for live trading and justify closed-source protection.
⚠️ Disclaimer
This script is for educational and informational purposes only. It does not constitute financial advice. Always conduct your own analysis and consult a licensed professional before trading. The author is not liable for losses or damages. Use at your own risk.
This indicator automatically detects, draws, and manages institutional zones using refined order block logic. It is built to highlight high-probability reversal or breakout areas across any timeframe, with advanced zone management features that go beyond typical open-source versions.
How It Works
The script identifies price regions where significant institutional buying or selling has previously occurred and tracks how they evolve in real time:
Green = Areas of strong institutional buying interest.
Red = Areas of institutional selling interest.
Gray = Tested Zone: If price re-enters a previously drawn zone, it turns gray and relabels as “Tested,” signaling reduced reaction strength.
Unlike many standard supply/demand tools, this script includes automatic zone removal, tested-zone tracking, and no-repaint logic to maintain chart accuracy and reduce clutter.
Features
Dynamic zone creation and removal based on order block and mitigation rules.
Real-time updates with no repainting.
Visual clarity controls (adjustable transparency, labels inside zones).
Automatic zone lifecycle tracking, with clear status indicators (“Demand Zone,” “Supply Zone,” “Tested”).
How to Use
Apply the indicator to any chart and timeframe.
Use Demand Zones as potential long/swing-low areas and Supply Zones as potential short/swing-high areas.
When a zone turns gray, treat it as weakened — reactions may be less reliable.
Combine with your own technical or fundamental analysis for confirmation.
Best Practices
Pair with candlestick reversal signals or momentum indicators for higher accuracy.
Adjust tuning/mitigation parameters to fit your trading style and the asset’s volatility.
Use across multiple timeframes to validate institutional order flow alignment.
Why This Script Is Different
Most open-source supply/demand indicators only plot static zones. This script introduces:
Automatic zone removal to keep charts clean and relevant.
Dynamic “tested zone” logic that tracks weakening institutional levels.
Real-time, no-repaint drawing, ensuring zones remain accurate as price action evolves.
These unique features make the tool more practical for live trading and justify closed-source protection.
⚠️ Disclaimer
This script is for educational and informational purposes only. It does not constitute financial advice. Always conduct your own analysis and consult a licensed professional before trading. The author is not liable for losses or damages. Use at your own risk.
受保護腳本
此腳本以閉源形式發佈。 不過,您可以自由且不受任何限制地使用它 — 在此處了解更多資訊。
By Dubai Traders Hub
Follow us on X , YouTube, and Join our Telegram Channel
Follow us on X , YouTube, and Join our Telegram Channel
免責聲明
這些資訊和出版物並不意味著也不構成TradingView提供或認可的金融、投資、交易或其他類型的意見或建議。請在使用條款閱讀更多資訊。
受保護腳本
此腳本以閉源形式發佈。 不過,您可以自由且不受任何限制地使用它 — 在此處了解更多資訊。
By Dubai Traders Hub
Follow us on X , YouTube, and Join our Telegram Channel
Follow us on X , YouTube, and Join our Telegram Channel
免責聲明
這些資訊和出版物並不意味著也不構成TradingView提供或認可的金融、投資、交易或其他類型的意見或建議。請在使用條款閱讀更多資訊。