OPEN-SOURCE SCRIPT
Kamal 5 Tick Trading Setup
Kamal 5 Tick Trading Setup
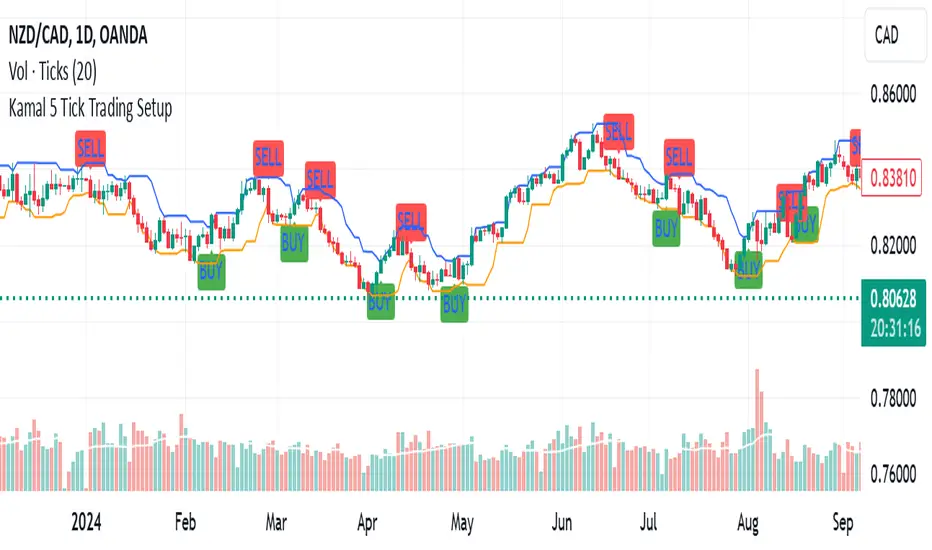
The "Kamal 5 Tick Trading Setup" is a custom indicator designed by Kamal Preet Singh Trader for TradingView to identify potential Buy and Sell signals on daily forex charts. This indicator helps traders make informed decisions based on the price action of the previous five daily candles.
Indicator Logic:
Buy Signal: A Buy signal is generated when the closing price of the current candle exceeds the highest high of the previous five daily candles.
Sell Signal: A Sell signal is generated when the closing price of the current candle falls below the lowest low of the previous five daily candles.
Features:
Lookback Period: The indicator uses a lookback period of five candles to determine the highest high and lowest low.
Visual Signals: Buy signals are plotted as green "BUY" labels below the candles, while Sell signals are plotted as red "SELL" labels above the candles.
Debugging Plots: The highest high and lowest low of the previous five candles are plotted as blue and orange lines, respectively, to help verify the conditions for Buy and Sell signals.
Non-Repetitive Signals: The indicator ensures that once a Buy signal is given, no further Buy signals are generated until a Sell signal is given, and vice versa.
Usage:
Apply the indicator to your daily forex chart in TradingView.
Observe the plotted Buy and Sell signals to identify potential entry and exit points.
Use the debugging plots to ensure the conditions for the signals are being met correctly.
This indicator provides a straightforward approach to trading based on recent price action, helping traders capitalize on potential breakout and breakdown opportunities.
開源腳本
秉持TradingView一貫精神,這個腳本的創作者將其設為開源,以便交易者檢視並驗證其功能。向作者致敬!您可以免費使用此腳本,但請注意,重新發佈代碼需遵守我們的社群規範。
Kamal Preet Singh Trader
免責聲明
這些資訊和出版物並非旨在提供,也不構成TradingView提供或認可的任何形式的財務、投資、交易或其他類型的建議或推薦。請閱讀使用條款以了解更多資訊。
開源腳本
秉持TradingView一貫精神,這個腳本的創作者將其設為開源,以便交易者檢視並驗證其功能。向作者致敬!您可以免費使用此腳本,但請注意,重新發佈代碼需遵守我們的社群規範。
Kamal Preet Singh Trader
免責聲明
這些資訊和出版物並非旨在提供,也不構成TradingView提供或認可的任何形式的財務、投資、交易或其他類型的建議或推薦。請閱讀使用條款以了解更多資訊。