OPEN-SOURCE SCRIPT
已更新 Monthly Returns in Strategies with Market Benchmark
This is a modified version of this excellent script Monthly Returns in PineScript Strategues by QuantNomad
I liked and used the script but wanted to see how strategy performed vs market on each month/year. So I am sharing back.
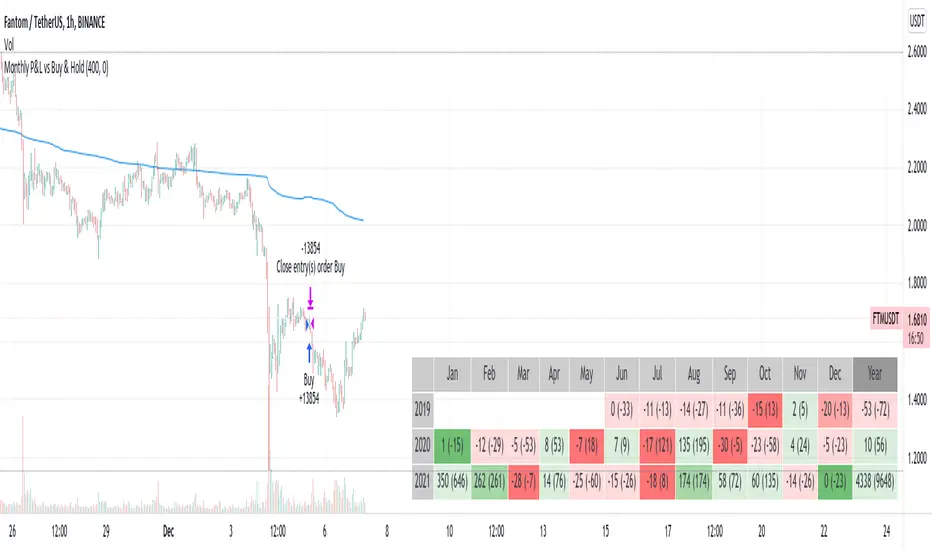
The modification consists in adding Market or Buy & Hold performance between parenthesis inside each cell to better see how strategy performed vs market.
Also, 3 red levels and 3 green levels have been used :
For green :
1/ Light when strategy pnl > 0 but < market
2/ medium when strategy pnl > 0 and > market
3/ Dark when strategy pnl > 0 and market < 0 or pnl > market x 2
Same logic in the opposite direction for red.
The strategy provided here is just a showcase of how to use the table in pine script.
Disclaimer
Please remember that past performance may not be indicative of future results.
Due to various factors, including changing market conditions, the strategy may no longer perform as well as in historical backtesting.
This post and the script don’t provide any financial advice.
I liked and used the script but wanted to see how strategy performed vs market on each month/year. So I am sharing back.
The modification consists in adding Market or Buy & Hold performance between parenthesis inside each cell to better see how strategy performed vs market.
Also, 3 red levels and 3 green levels have been used :
For green :
1/ Light when strategy pnl > 0 but < market
2/ medium when strategy pnl > 0 and > market
3/ Dark when strategy pnl > 0 and market < 0 or pnl > market x 2
Same logic in the opposite direction for red.
The strategy provided here is just a showcase of how to use the table in pine script.
Disclaimer
Please remember that past performance may not be indicative of future results.
Due to various factors, including changing market conditions, the strategy may no longer perform as well as in historical backtesting.
This post and the script don’t provide any financial advice.
發行說明
Refactor code發行說明
Fixed bug with red color level發行說明
Get number precision as input (0 => no digit after the decimal point, 1 => 1 digit after decimal point etc.)開源腳本
秉持TradingView一貫精神,這個腳本的創作者將其設為開源,以便交易者檢視並驗證其功能。向作者致敬!您可以免費使用此腳本,但請注意,重新發佈代碼需遵守我們的社群規範。
免責聲明
這些資訊和出版物並非旨在提供,也不構成TradingView提供或認可的任何形式的財務、投資、交易或其他類型的建議或推薦。請閱讀使用條款以了解更多資訊。
開源腳本
秉持TradingView一貫精神,這個腳本的創作者將其設為開源,以便交易者檢視並驗證其功能。向作者致敬!您可以免費使用此腳本,但請注意,重新發佈代碼需遵守我們的社群規範。
免責聲明
這些資訊和出版物並非旨在提供,也不構成TradingView提供或認可的任何形式的財務、投資、交易或其他類型的建議或推薦。請閱讀使用條款以了解更多資訊。