PROTECTED SOURCE SCRIPT
Fractal Adaptive Moving Average (FRAMA)
Core Concept
Unlike traditional moving averages that use fixed smoothing factors, FRAMA adapts its responsiveness based on how "fractal" or chaotic the price movement is:
In trending markets (low fractal dimension), it becomes more responsive
In choppy/sideways markets (high fractal dimension), it becomes smoother
How It Works
1. Fractal Dimension Calculation:
Splits the lookback period into two halves
Calculates price ranges for each half and the total period
Uses logarithmic ratios to determine the fractal dimension (bounded between 1.0 and 2.0)
2. Dynamic Alpha Calculation:
Converts fractal dimension to a smoothing factor (alpha)
Higher fractal dimension = lower alpha = smoother average
Lower fractal dimension = higher alpha = more responsive average
3. Adaptive Smoothing:
Applies the calculated alpha to create the moving average
FRAMA = alpha × current_price + (1 - alpha) × previous_FRAMA
Key Parameters
Length (16): Lookback period for calculations
Fast Constant (4.0): Maximum responsiveness limit
Slow Constant (300.0): Minimum responsiveness limit
Visual Features
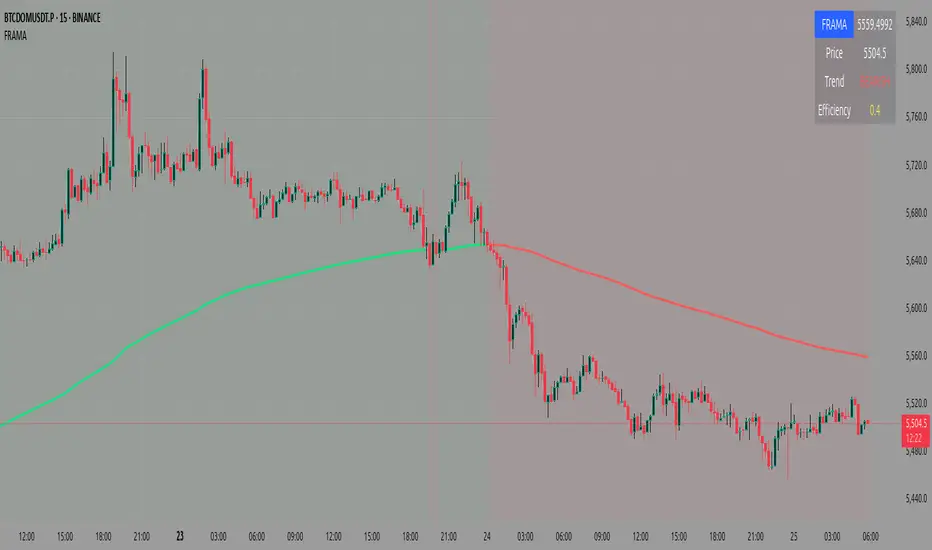
Line Color: Green when rising, red when falling
Background: Light green above FRAMA (bullish), light red below (bearish)
Information Table: Shows current FRAMA value, price, trend direction, and efficiency ratio
Close Price: Plotted as a semi-transparent white line for comparison
Trading Applications
FRAMA is particularly useful for:
Trend Following: More responsive in strong trends, less noisy in consolidations
Support/Resistance: Acts as dynamic support in uptrends, resistance in downtrends
Market Regime Detection: The efficiency ratio helps identify trending vs. ranging markets
Entry/Exit Signals: Crossovers and price position relative to FRAMA
The indicator automatically balances between being fast enough to catch trends early while being smooth enough to avoid false signals in choppy markets.
In this FRAMA script, fractal refers to measuring the complexity or "roughness" of price movements over time, not the self-similar geometric patterns we typically think of.
What the Script Measures
The script calculates a fractal dimension that quantifies how chaotic or smooth the price action is:
Low fractal dimension (closer to 1.0): Price moves in a relatively straight, trending manner
High fractal dimension (closer to 2.0): Price moves in a jagged, choppy, sideways manner.
The Logic
If the market is trending smoothly:
The sum of the two half-period ranges will be close to the total range
This gives a fractal dimension closer to 1.0
The indicator becomes more responsive (faster)
If the market is choppy/sideways:
The sum of the two half-period ranges will be much larger than the total range
This gives a fractal dimension closer to 2.0
The indicator becomes less responsive (smoother)
Practical Example
Imagine a 16-period lookback:
Trending market: Price goes from 100 → 116 steadily
Choppy market: Price bounces 100→108→102→114→106→116
The choppy market has a higher fractal dimension because there's more "path length" relative to the actual distance traveled.
Why This Matters
The fractal dimension becomes the adaptive mechanism that automatically adjusts the moving average's sensitivity based on current market conditions - making it faster in trends and smoother in consolidations.
what is efficiency that is shown in tables
The efficiency shown in the table measures how "efficient" or smooth the FRAMA line is compared to the actual price movement.
What It Means
Efficiency = FRAMA Movement ÷ Price Movement
Values close to 0: FRAMA is very smooth/stable while price is moving significantly
Values close to 1: FRAMA is moving almost as much as the price
Values > 1: FRAMA is moving more than the raw price (rare, usually in very short periods)
Practical Interpretation
Low Efficiency (0.1 - 0.3):
FRAMA is doing a good job of smoothing out noise
Market is likely choppy/sideways
The adaptive mechanism is working - keeping the average stable during consolidation
High Efficiency (0.7 - 1.0):
FRAMA is closely following price movements
Market is likely trending strongly
The adaptive mechanism is making the average more responsive
Medium Efficiency (0.3 - 0.7):
Balanced market conditions
FRAMA is providing moderate smoothing
Trading Context
This efficiency ratio helps you understand:
Market regime: Is this a trending or ranging market?
Signal quality: Low efficiency periods might produce fewer but higher-quality signals
Adaptive performance: How well the FRAMA is adapting to current conditions
For example, if you see efficiency at 0.15, it means the FRAMA moved only 15% as much as the price did in the last bar, indicating it's successfully filtering out noise in a choppy market. If efficiency is 0.85, the FRAMA is closely tracking price, suggesting a trending environment where you want the average to be responsive.
Unlike traditional moving averages that use fixed smoothing factors, FRAMA adapts its responsiveness based on how "fractal" or chaotic the price movement is:
In trending markets (low fractal dimension), it becomes more responsive
In choppy/sideways markets (high fractal dimension), it becomes smoother
How It Works
1. Fractal Dimension Calculation:
Splits the lookback period into two halves
Calculates price ranges for each half and the total period
Uses logarithmic ratios to determine the fractal dimension (bounded between 1.0 and 2.0)
2. Dynamic Alpha Calculation:
Converts fractal dimension to a smoothing factor (alpha)
Higher fractal dimension = lower alpha = smoother average
Lower fractal dimension = higher alpha = more responsive average
3. Adaptive Smoothing:
Applies the calculated alpha to create the moving average
FRAMA = alpha × current_price + (1 - alpha) × previous_FRAMA
Key Parameters
Length (16): Lookback period for calculations
Fast Constant (4.0): Maximum responsiveness limit
Slow Constant (300.0): Minimum responsiveness limit
Visual Features
Line Color: Green when rising, red when falling
Background: Light green above FRAMA (bullish), light red below (bearish)
Information Table: Shows current FRAMA value, price, trend direction, and efficiency ratio
Close Price: Plotted as a semi-transparent white line for comparison
Trading Applications
FRAMA is particularly useful for:
Trend Following: More responsive in strong trends, less noisy in consolidations
Support/Resistance: Acts as dynamic support in uptrends, resistance in downtrends
Market Regime Detection: The efficiency ratio helps identify trending vs. ranging markets
Entry/Exit Signals: Crossovers and price position relative to FRAMA
The indicator automatically balances between being fast enough to catch trends early while being smooth enough to avoid false signals in choppy markets.
In this FRAMA script, fractal refers to measuring the complexity or "roughness" of price movements over time, not the self-similar geometric patterns we typically think of.
What the Script Measures
The script calculates a fractal dimension that quantifies how chaotic or smooth the price action is:
Low fractal dimension (closer to 1.0): Price moves in a relatively straight, trending manner
High fractal dimension (closer to 2.0): Price moves in a jagged, choppy, sideways manner.
The Logic
If the market is trending smoothly:
The sum of the two half-period ranges will be close to the total range
This gives a fractal dimension closer to 1.0
The indicator becomes more responsive (faster)
If the market is choppy/sideways:
The sum of the two half-period ranges will be much larger than the total range
This gives a fractal dimension closer to 2.0
The indicator becomes less responsive (smoother)
Practical Example
Imagine a 16-period lookback:
Trending market: Price goes from 100 → 116 steadily
Choppy market: Price bounces 100→108→102→114→106→116
The choppy market has a higher fractal dimension because there's more "path length" relative to the actual distance traveled.
Why This Matters
The fractal dimension becomes the adaptive mechanism that automatically adjusts the moving average's sensitivity based on current market conditions - making it faster in trends and smoother in consolidations.
what is efficiency that is shown in tables
The efficiency shown in the table measures how "efficient" or smooth the FRAMA line is compared to the actual price movement.
What It Means
Efficiency = FRAMA Movement ÷ Price Movement
Values close to 0: FRAMA is very smooth/stable while price is moving significantly
Values close to 1: FRAMA is moving almost as much as the price
Values > 1: FRAMA is moving more than the raw price (rare, usually in very short periods)
Practical Interpretation
Low Efficiency (0.1 - 0.3):
FRAMA is doing a good job of smoothing out noise
Market is likely choppy/sideways
The adaptive mechanism is working - keeping the average stable during consolidation
High Efficiency (0.7 - 1.0):
FRAMA is closely following price movements
Market is likely trending strongly
The adaptive mechanism is making the average more responsive
Medium Efficiency (0.3 - 0.7):
Balanced market conditions
FRAMA is providing moderate smoothing
Trading Context
This efficiency ratio helps you understand:
Market regime: Is this a trending or ranging market?
Signal quality: Low efficiency periods might produce fewer but higher-quality signals
Adaptive performance: How well the FRAMA is adapting to current conditions
For example, if you see efficiency at 0.15, it means the FRAMA moved only 15% as much as the price did in the last bar, indicating it's successfully filtering out noise in a choppy market. If efficiency is 0.85, the FRAMA is closely tracking price, suggesting a trending environment where you want the average to be responsive.
受保護腳本
此腳本以閉源形式發佈。 不過,您可以自由使用,沒有任何限制 — 點擊此處了解更多。
免責聲明
這些資訊和出版物並非旨在提供,也不構成TradingView提供或認可的任何形式的財務、投資、交易或其他類型的建議或推薦。請閱讀使用條款以了解更多資訊。
受保護腳本
此腳本以閉源形式發佈。 不過,您可以自由使用,沒有任何限制 — 點擊此處了解更多。
免責聲明
這些資訊和出版物並非旨在提供,也不構成TradingView提供或認可的任何形式的財務、投資、交易或其他類型的建議或推薦。請閱讀使用條款以了解更多資訊。