OPEN-SOURCE SCRIPT
Price Trend Indicator+
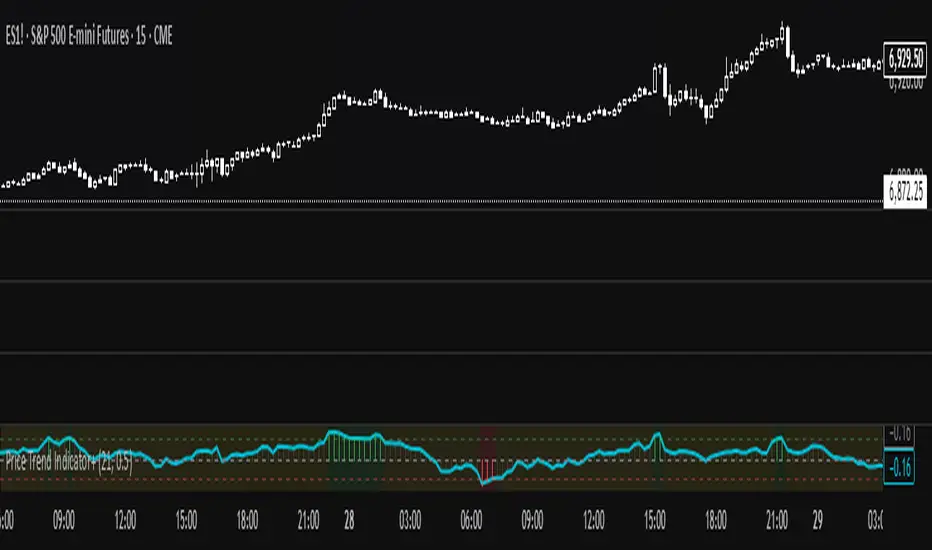
🧠 What it does
It measures the ratio between average price change and average volatility, showing how strong and directional the trend is.
Higher positive values = steady uptrend, negative = downtrend
📊 How to interpret
P value Signal Meaning
P > +0.5 🟢 Strong Uptrend Steady upward movement
0 < P < +0.5 🟡 Mild Uptrend Weak upward bias
P ≈ 0 ⚪ Sideways No clear direction
-0.5 < P < 0 🟠 Mild Downtrend Slight downward bias
P < -0.5 🔴 Strong Downtrend Consistent decline
開源腳本
秉持TradingView一貫精神,這個腳本的創作者將其設為開源,以便交易者檢視並驗證其功能。向作者致敬!您可以免費使用此腳本,但請注意,重新發佈代碼需遵守我們的社群規範。
免責聲明
這些資訊和出版物並非旨在提供,也不構成TradingView提供或認可的任何形式的財務、投資、交易或其他類型的建議或推薦。請閱讀使用條款以了解更多資訊。
免責聲明
這些資訊和出版物並非旨在提供,也不構成TradingView提供或認可的任何形式的財務、投資、交易或其他類型的建議或推薦。請閱讀使用條款以了解更多資訊。