OPEN-SOURCE SCRIPT
200 EMA Trend Direction [Dr.K.C.Prakash]
📘 Indicator Description: 200 EMA Trend Direction [Dr.K.C.Prakash]
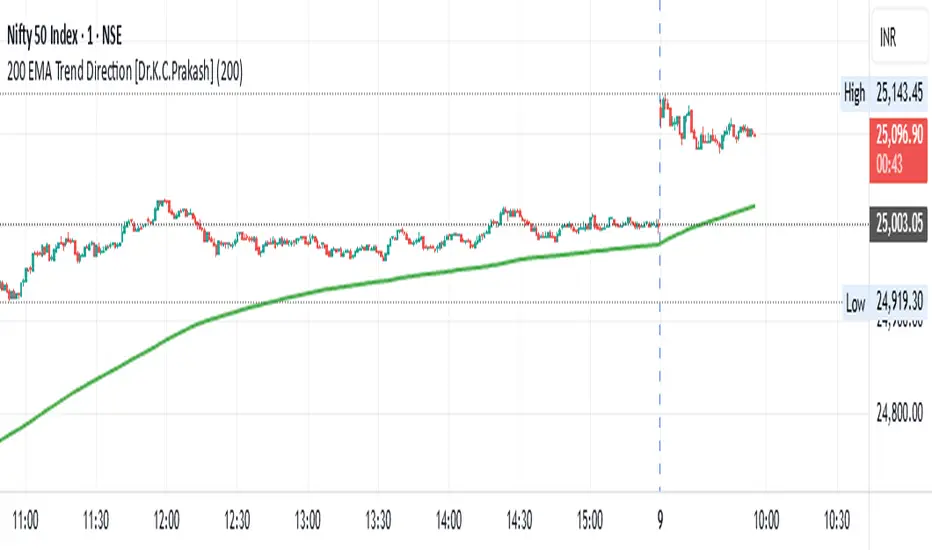
The "200 EMA Trend Direction [Dr.K.C.Prakash]" indicator is a visual trend-following tool designed to identify and confirm major market direction using the slope of the 200-period Exponential Moving Average (EMA). It’s ideal for traders who want to stay on the right side of the trend and avoid noise.
🔍 Key Components
1. 200 EMA (Exponential Moving Average)
The 200 EMA is a widely used long-term trend indicator in technical analysis.
It reacts faster than the simple moving average (SMA) due to its weighting toward recent prices.
2. Trend Detection Logic
Uptrend is detected when the current EMA value is higher than the previous candle’s EMA.
Downtrend is detected when the EMA starts sloping downward, i.e., current EMA < previous EMA.
🎨 Visual Representation
Green EMA Line: Indicates the 200 EMA is rising → bullish trend (uptrend).
Red EMA Line: Indicates the 200 EMA is falling → bearish trend (downtrend).
This color-coding helps you instantly understand the market context without needing to analyze multiple indicators.
✅ Best Use Cases
📈 Trend Confirmation: Use it to confirm the direction before entering a trade.
⚠️ Avoid Counter-Trend Trades: Helps in staying aligned with the dominant trend.
🧠 Supports All Timeframes: Although best suited for 5m, 15m, or higher, it can also be used for 1-minute charts in scalping systems when aligned with higher timeframes.
⚙️ Customization Possibilities
You can extend this indicator with:
🔔 Trend change alerts
🟩🟥 Background shading based on trend
💹 Buy/Sell signals when price crosses above/below the 200 EMA
開源腳本
本著TradingView的真正精神,此腳本的創建者將其開源,以便交易者可以查看和驗證其功能。向作者致敬!雖然您可以免費使用它,但請記住,重新發佈程式碼必須遵守我們的網站規則。
免責聲明
這些資訊和出版物並不意味著也不構成TradingView提供或認可的金融、投資、交易或其他類型的意見或建議。請在使用條款閱讀更多資訊。
開源腳本
本著TradingView的真正精神,此腳本的創建者將其開源,以便交易者可以查看和驗證其功能。向作者致敬!雖然您可以免費使用它,但請記住,重新發佈程式碼必須遵守我們的網站規則。
免責聲明
這些資訊和出版物並不意味著也不構成TradingView提供或認可的金融、投資、交易或其他類型的意見或建議。請在使用條款閱讀更多資訊。