OPEN-SOURCE SCRIPT
已更新 Linear Regression Forecast (ADX Adaptive)
Linear Regression Forecast (ADX Adaptive)
This indicator is a dynamic price projection tool that combines multiple linear regression forecasts into a single, adaptive forecast curve. By integrating trend strength via the ADX and directional bias, it aims to visualize how price might evolve in different market environments—from strong trends to mean-reverting conditions.
Core Concept:
This tool builds forward price projections based on a blend of linear regression models with varying lookback lengths (from 2 up to a user-defined max). It then adjusts those projections using two key mechanisms:
ADX-Weighted Forecast Blending
In trending conditions (high ADX), the model follows the raw forecast direction. In ranging markets (low ADX), the forecast flips or reverts, biasing toward mean-reversion. A logistic transformation of directional bias, controlled by a steepness parameter, determines how aggressively this blending reacts to price behavior.
Volatility Scaling
The forecast’s magnitude is scaled based on ADX and directional conviction. When trends are unclear (low ADX or neutral bias), the projection range expands to reflect greater uncertainty and volatility.
How It Works:
Regression Curve Generation
For each regression length from 2 to maxLength, a forward projection is calculated using least-squares linear regression on the selected price source. These forecasts are extrapolated into the future.
Directional Bias Calculation
The forecasted points are analyzed to determine a normalized bias value in the range -1 to +1, where +1 means strongly bullish, -1 means strongly bearish, and 0 means neutral.
Logistic Bias Transformation
The raw bias is passed through a logistic sigmoid function, with a user-defined steepness. This creates a probability-like weight that favors either following or reversing the forecast depending on market context.
ADX-Based Weighting
ADX determines the weighting between trend-following and mean-reversion modes. Below ADX 20, the model favors mean-reversion. Above 25, it favors trend-following. Between 20 and 25, it linearly blends the two.
Blended Forecast Curve
Each forecast point is blended between trend-following and mean-reverting values, scaled for volatility.
What You See:
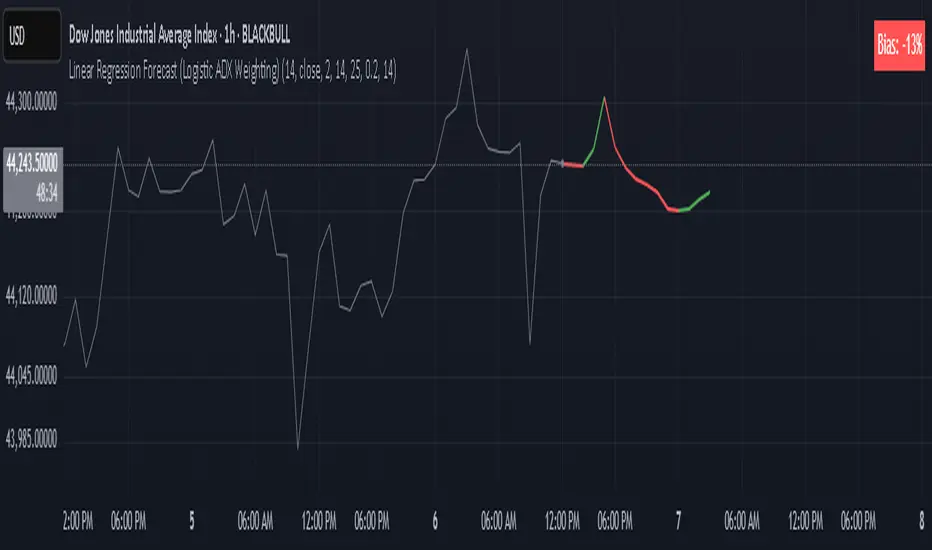
Forecast Lines: Projected future price paths drawn in green or red depending on direction.
Bias Plot: A separate plot showing post-blend directional bias as a percentage, where +100 is strongly bullish and -100 is strongly bearish.
Neutral Line: A dashed horizontal line at 0 percent bias to indicate neutrality.
User Inputs:
-Max Regression Length
-Price Source
-Line Width
-Bias Steepness
-ADX Length and Smoothing
Use Cases:
Visualize expected price direction under different trend conditions
Adjust trading behavior depending on trending vs ranging markets
Combine with other tools for deeper analysis
Important Notes:
This indicator is for visualization and analysis only. It does not provide buy or sell signals and should not be used in isolation. It makes assumptions based on historical price action and should be interpreted with market context.
This indicator is a dynamic price projection tool that combines multiple linear regression forecasts into a single, adaptive forecast curve. By integrating trend strength via the ADX and directional bias, it aims to visualize how price might evolve in different market environments—from strong trends to mean-reverting conditions.
Core Concept:
This tool builds forward price projections based on a blend of linear regression models with varying lookback lengths (from 2 up to a user-defined max). It then adjusts those projections using two key mechanisms:
ADX-Weighted Forecast Blending
In trending conditions (high ADX), the model follows the raw forecast direction. In ranging markets (low ADX), the forecast flips or reverts, biasing toward mean-reversion. A logistic transformation of directional bias, controlled by a steepness parameter, determines how aggressively this blending reacts to price behavior.
Volatility Scaling
The forecast’s magnitude is scaled based on ADX and directional conviction. When trends are unclear (low ADX or neutral bias), the projection range expands to reflect greater uncertainty and volatility.
How It Works:
Regression Curve Generation
For each regression length from 2 to maxLength, a forward projection is calculated using least-squares linear regression on the selected price source. These forecasts are extrapolated into the future.
Directional Bias Calculation
The forecasted points are analyzed to determine a normalized bias value in the range -1 to +1, where +1 means strongly bullish, -1 means strongly bearish, and 0 means neutral.
Logistic Bias Transformation
The raw bias is passed through a logistic sigmoid function, with a user-defined steepness. This creates a probability-like weight that favors either following or reversing the forecast depending on market context.
ADX-Based Weighting
ADX determines the weighting between trend-following and mean-reversion modes. Below ADX 20, the model favors mean-reversion. Above 25, it favors trend-following. Between 20 and 25, it linearly blends the two.
Blended Forecast Curve
Each forecast point is blended between trend-following and mean-reverting values, scaled for volatility.
What You See:
Forecast Lines: Projected future price paths drawn in green or red depending on direction.
Bias Plot: A separate plot showing post-blend directional bias as a percentage, where +100 is strongly bullish and -100 is strongly bearish.
Neutral Line: A dashed horizontal line at 0 percent bias to indicate neutrality.
User Inputs:
-Max Regression Length
-Price Source
-Line Width
-Bias Steepness
-ADX Length and Smoothing
Use Cases:
Visualize expected price direction under different trend conditions
Adjust trading behavior depending on trending vs ranging markets
Combine with other tools for deeper analysis
Important Notes:
This indicator is for visualization and analysis only. It does not provide buy or sell signals and should not be used in isolation. It makes assumptions based on historical price action and should be interpreted with market context.
發行說明
bias calculation發行說明
cleaner發行說明
bias calculation發行說明
1:1 Gann angle benchmark ratio calculation for Biasbetter bias display
發行說明
forecast actually blends發行說明
anti-trend weighting發行說明
made logistic range an input發行說明
logistic formula non-flip開源腳本
秉持TradingView一貫精神,這個腳本的創作者將其設為開源,以便交易者檢視並驗證其功能。向作者致敬!您可以免費使用此腳本,但請注意,重新發佈代碼需遵守我們的社群規範。
免責聲明
這些資訊和出版物並非旨在提供,也不構成TradingView提供或認可的任何形式的財務、投資、交易或其他類型的建議或推薦。請閱讀使用條款以了解更多資訊。
開源腳本
秉持TradingView一貫精神,這個腳本的創作者將其設為開源,以便交易者檢視並驗證其功能。向作者致敬!您可以免費使用此腳本,但請注意,重新發佈代碼需遵守我們的社群規範。
免責聲明
這些資訊和出版物並非旨在提供,也不構成TradingView提供或認可的任何形式的財務、投資、交易或其他類型的建議或推薦。請閱讀使用條款以了解更多資訊。