OPEN-SOURCE SCRIPT
已更新 Intraday volatility on EOD chart
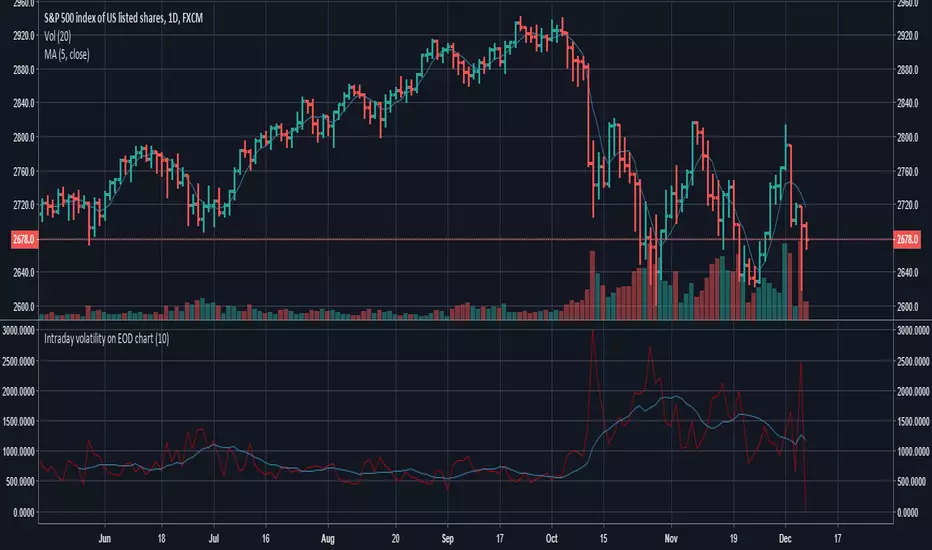
This indicator will allow you to compare Daily bars with Intraday insight.
Indicator draws the sum of high-low intraday bars on EOD timeframe.
The purpose is to compare TR or ATR with intraday data, because high-low on 1 daily bar says little about intraday bars inside.
You can replace the function (cum(high - low)) with whatever you need to calculate on intraday bars.
Indicator draws the sum of high-low intraday bars on EOD timeframe.
The purpose is to compare TR or ATR with intraday data, because high-low on 1 daily bar says little about intraday bars inside.
You can replace the function (cum(high - low)) with whatever you need to calculate on intraday bars.
發行說明
Added moving average開源腳本
秉持TradingView一貫精神,這個腳本的創作者將其設為開源,以便交易者檢視並驗證其功能。向作者致敬!您可以免費使用此腳本,但請注意,重新發佈代碼需遵守我們的社群規範。
免責聲明
這些資訊和出版物並非旨在提供,也不構成TradingView提供或認可的任何形式的財務、投資、交易或其他類型的建議或推薦。請閱讀使用條款以了解更多資訊。
免責聲明
這些資訊和出版物並非旨在提供,也不構成TradingView提供或認可的任何形式的財務、投資、交易或其他類型的建議或推薦。請閱讀使用條款以了解更多資訊。