OPEN-SOURCE SCRIPT
已更新 MTF Previous Open/Close/Range

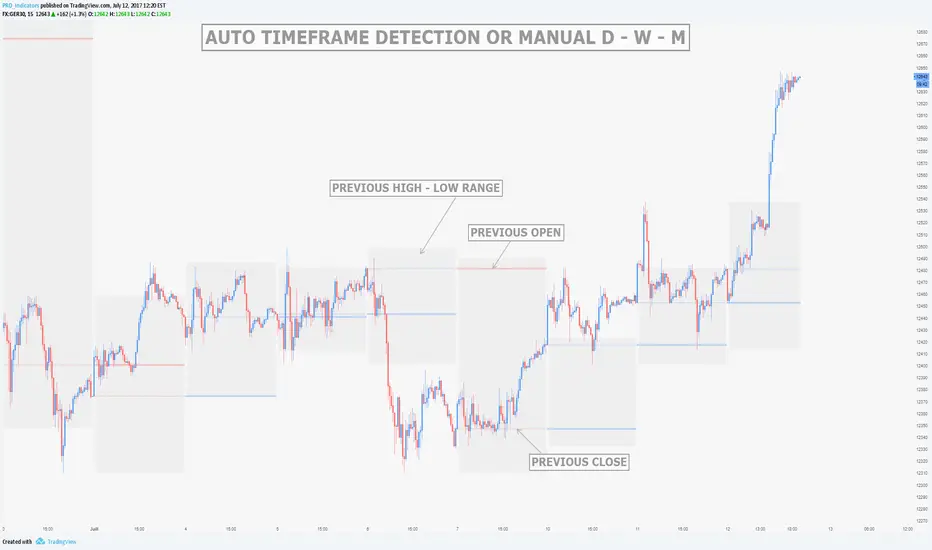
This indicator will simply plot on your chart the Daily/Weekly/Monthly previous candle levels.
The "Auto" mode will allow automatic adjustment of timeframe displayed according to your chart.
Otherwise you can select manually.
Indicator plots the open/close and colors the high-low range area in the background.
Hope this simple indicator will help you !
You can check my indicators via my TradingView's Profile : @PRO_Indicators
發行說明
Added support for quarters and year timeframes. Added the optional plot of the 61% extension line (this extension generally acts like a support/resistance)
發行說明
Added more timeframe options and a gap highlighting (can be desactivated)開源腳本
秉持TradingView一貫精神,這個腳本的創作者將其設為開源,以便交易者檢視並驗證其功能。向作者致敬!您可以免費使用此腳本,但請注意,重新發佈代碼需遵守我們的社群規範。
To learn more about the PRO Strategy and request a trial for the indicators:
Website : pro-indicators.com
Discord : discord.gg/2mHQbEmb9P
Website : pro-indicators.com
Discord : discord.gg/2mHQbEmb9P
免責聲明
這些資訊和出版物並非旨在提供,也不構成TradingView提供或認可的任何形式的財務、投資、交易或其他類型的建議或推薦。請閱讀使用條款以了解更多資訊。
開源腳本
秉持TradingView一貫精神,這個腳本的創作者將其設為開源,以便交易者檢視並驗證其功能。向作者致敬!您可以免費使用此腳本,但請注意,重新發佈代碼需遵守我們的社群規範。
To learn more about the PRO Strategy and request a trial for the indicators:
Website : pro-indicators.com
Discord : discord.gg/2mHQbEmb9P
Website : pro-indicators.com
Discord : discord.gg/2mHQbEmb9P
免責聲明
這些資訊和出版物並非旨在提供,也不構成TradingView提供或認可的任何形式的財務、投資、交易或其他類型的建議或推薦。請閱讀使用條款以了解更多資訊。