OPEN-SOURCE SCRIPT
已更新 TICK and Price Action Indicator for NQ 5 minute
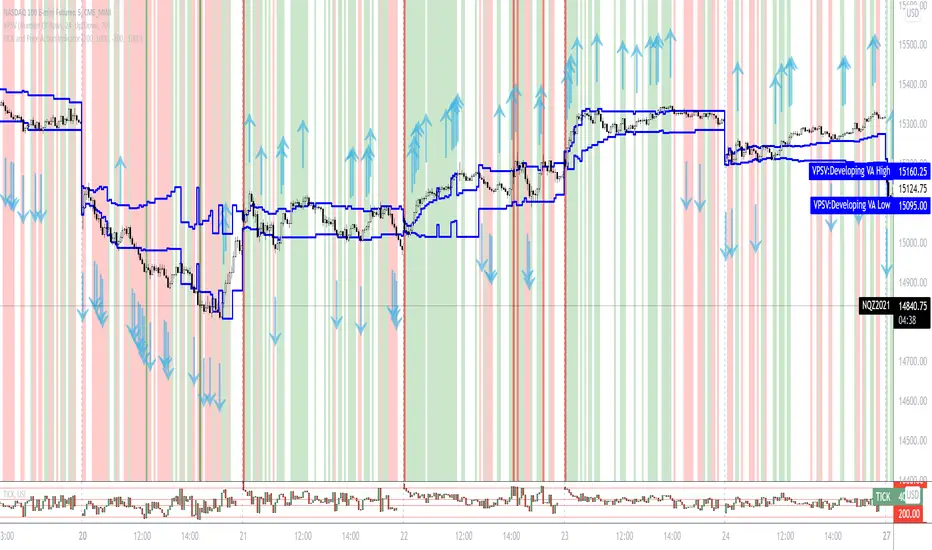
This indicator for 5 minute NQ charts utilises TICK index and price action.
Where TICK opens beyond +1000/-1000 this is an overbought/oversold signal.
Similarly, when TICK closes below -200 it is a sell signal, and above +200 it is a buy signal.
This indicator colours the NQ bars based on the closing/opening values of the previous TICK.
It also draws arrows where price action (close above previous high, close below previous low) is in concordance with TICK behaviour.
發行說明
Debugged code that limited the number of buy signals; debugged code that would otherwise show a number of short signals開源腳本
秉持TradingView一貫精神,這個腳本的創作者將其設為開源,以便交易者檢視並驗證其功能。向作者致敬!您可以免費使用此腳本,但請注意,重新發佈代碼需遵守我們的社群規範。
免責聲明
這些資訊和出版物並非旨在提供,也不構成TradingView提供或認可的任何形式的財務、投資、交易或其他類型的建議或推薦。請閱讀使用條款以了解更多資訊。
開源腳本
秉持TradingView一貫精神,這個腳本的創作者將其設為開源,以便交易者檢視並驗證其功能。向作者致敬!您可以免費使用此腳本,但請注意,重新發佈代碼需遵守我們的社群規範。
免責聲明
這些資訊和出版物並非旨在提供,也不構成TradingView提供或認可的任何形式的財務、投資、交易或其他類型的建議或推薦。請閱讀使用條款以了解更多資訊。