INVITE-ONLY SCRIPT
ZenAlgo - Multiverse
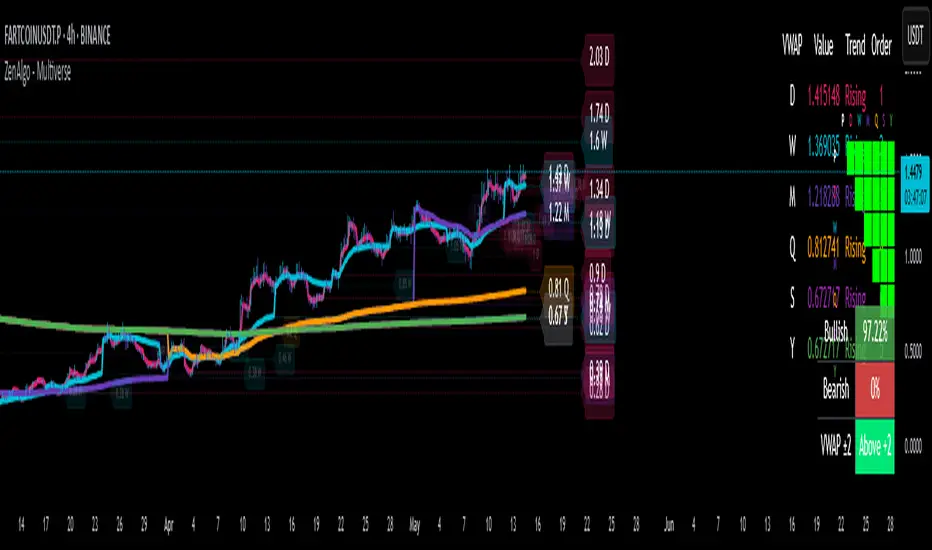
The ZenAlgo – Multiverse indicator provides a multi-timeframe view of Volume-Weighted Average Price (VWAP) levels and their dynamic interaction with price across seven defined timeframes: Daily, Weekly, Monthly, Quarterly, Semi-Annual, and Yearly. The indicator is intended to help traders contextualize price within time-based value areas and examine how price interacts with statistically relevant bands derived from those VWAPs.
VWAP Calculation and Period Structure
At the core, this script computes VWAP levels anchored to six distinct timeframes using volume data and a configurable source (default is HLC3). Each VWAP resets at the start of its corresponding period (e.g., Daily VWAP resets at the beginning of a new day) using timeframe.change() as a detection mechanism. This allows each VWAP level to reflect a clean aggregation of price and volume over its specified period.
VWAP levels are only computed if volume data is present and cumulative volume increases, ensuring logical consistency. If volume is missing or inconsistent, the script terminates execution with an error to prevent invalid outputs.
Band Calculation
Each VWAP is accompanied by one or two optional bands on both sides, calculated using percentage-based offset. Daily VWAP is configurable per user preference to use either standard deviation or a percentage-based offset. These bands provide a dynamic value area that expands or contracts with volatility or proportional price distance, respectively.
The bands help classify price as:
This layering creates a multi-zoned map of value perception across timeframes.
Labeling and Historical Tracking
As each new VWAP is computed, it is stored in a bounded array alongside metadata such as label position, line objects, test count, and test state (whether price has interacted with it). Each level is drawn as a dotted horizontal line and labeled with its value and corresponding period (e.g., "D", "W", "M").
Price interaction with a VWAP level (i.e., candle high/low crossing the line) changes the styling of the label and line, marking it as "tested." A cap on how many tested levels are retained (default 10) avoids excessive clutter and resource usage.
These persistent horizontal levels give the trader a visual reference of where value was defined in previous periods and how price has respected or ignored those levels over time.
Summary Tables and Grid
Two visual table overlays are provided:
1. VWAP Summary Table, this table shows:
The order is recalculated each bar to reflect the vertical positioning of each VWAP on the price chart.
2. VWAP Relationship Grid
A grid matrix compares each VWAP and current price against all others. Each cell reflects whether a given source is above, below, or within a tolerance threshold relative to another. Colors (green, red, gray) visually encode the result, with the diagonal marked in black and unused cells disabled.
This matrix helps identify alignment or dissonance among timeframes, allowing users to detect whether shorter-term value is leading or lagging longer-term value.
Price Band Classification
For the Daily VWAP specifically, the script includes an extra classification system. It assigns the current price to a zone (e.g., "At VWAP", "Bear Band", "Above Bull Band 2") based on where the price lies in relation to the VWAP bands. This classification is also used for dynamic coloring and added to the daily label.
Display Controls
The script offers fine-grained controls:
These options allow traders to declutter their charts and focus on the most relevant context for their strategy.
How to Interpret and Use
This indicator provides a structured view of market value perception across various timeframes. For example:
The band-based classification helps identify transitional zones and whether price is situated in an area where value is being accepted or rejected.
The summary tables offer a high-level dashboard of price positioning and value structure, which can assist with top-down analysis, filtering setups, or contextual decision-making.
Added Value Compared to Free Alternatives
Most free VWAP scripts:
This script consolidates multiple value areas in one consistent framework and goes further by tracking historical relevance, providing interaction logs, and organizing data into actionable overlays.
For traders seeking comprehensive value context across intraday and swing horizons, this tool offers persistent and structured data views that are otherwise unavailable through individual, isolated VWAP tools.
Limitations and Disclaimers
As with any analytical tool, interpretation requires trader discretion and should be combined with broader context.
VWAP Calculation and Period Structure
At the core, this script computes VWAP levels anchored to six distinct timeframes using volume data and a configurable source (default is HLC3). Each VWAP resets at the start of its corresponding period (e.g., Daily VWAP resets at the beginning of a new day) using timeframe.change() as a detection mechanism. This allows each VWAP level to reflect a clean aggregation of price and volume over its specified period.
VWAP levels are only computed if volume data is present and cumulative volume increases, ensuring logical consistency. If volume is missing or inconsistent, the script terminates execution with an error to prevent invalid outputs.
Band Calculation
Each VWAP is accompanied by one or two optional bands on both sides, calculated using percentage-based offset. Daily VWAP is configurable per user preference to use either standard deviation or a percentage-based offset. These bands provide a dynamic value area that expands or contracts with volatility or proportional price distance, respectively.
The bands help classify price as:
- Inside the main band (e.g., between ±1 band): near average value
- Inside extended band (e.g., ±2 bands): stretched but not extreme
- Beyond extended band: potentially overheated or oversold conditions
This layering creates a multi-zoned map of value perception across timeframes.
Labeling and Historical Tracking
As each new VWAP is computed, it is stored in a bounded array alongside metadata such as label position, line objects, test count, and test state (whether price has interacted with it). Each level is drawn as a dotted horizontal line and labeled with its value and corresponding period (e.g., "D", "W", "M").
Price interaction with a VWAP level (i.e., candle high/low crossing the line) changes the styling of the label and line, marking it as "tested." A cap on how many tested levels are retained (default 10) avoids excessive clutter and resource usage.
These persistent horizontal levels give the trader a visual reference of where value was defined in previous periods and how price has respected or ignored those levels over time.
Summary Tables and Grid
Two visual table overlays are provided:
1. VWAP Summary Table, this table shows:
- VWAP values per timeframe
- Trend interpretation (rising, falling, stable) relative to price
- Ranked order of VWAP values (from highest to lowest)
The order is recalculated each bar to reflect the vertical positioning of each VWAP on the price chart.
2. VWAP Relationship Grid
A grid matrix compares each VWAP and current price against all others. Each cell reflects whether a given source is above, below, or within a tolerance threshold relative to another. Colors (green, red, gray) visually encode the result, with the diagonal marked in black and unused cells disabled.
This matrix helps identify alignment or dissonance among timeframes, allowing users to detect whether shorter-term value is leading or lagging longer-term value.
Price Band Classification
For the Daily VWAP specifically, the script includes an extra classification system. It assigns the current price to a zone (e.g., "At VWAP", "Bear Band", "Above Bull Band 2") based on where the price lies in relation to the VWAP bands. This classification is also used for dynamic coloring and added to the daily label.
Display Controls
The script offers fine-grained controls:
- Toggle visibility of each VWAP and band group independently
- Adjust the offset of labels from the current bar
- Customize band multipliers and color transparency
- Limit the number of historical VWAP labels plotted
- Position both the summary and grid tables flexibly on screen
These options allow traders to declutter their charts and focus on the most relevant context for their strategy.
How to Interpret and Use
This indicator provides a structured view of market value perception across various timeframes. For example:
- When price converges with multiple VWAPs, it may suggest consensus on value.
- When price moves away from all VWAPs, it may indicate trending or stretched conditions.
- Crosses and retests of VWAPs (especially higher-timeframe ones) can act as areas of interest.
The band-based classification helps identify transitional zones and whether price is situated in an area where value is being accepted or rejected.
The summary tables offer a high-level dashboard of price positioning and value structure, which can assist with top-down analysis, filtering setups, or contextual decision-making.
Added Value Compared to Free Alternatives
Most free VWAP scripts:
- Cover only a single timeframe (often daily or session-based)
- Lack historical level tracking with tested/retested visualization
- Do not support grid-level relationships or multi-timeframe band analysis
- Offer limited configuration over how bands are calculated or displayed
This script consolidates multiple value areas in one consistent framework and goes further by tracking historical relevance, providing interaction logs, and organizing data into actionable overlays.
For traders seeking comprehensive value context across intraday and swing horizons, this tool offers persistent and structured data views that are otherwise unavailable through individual, isolated VWAP tools.
Limitations and Disclaimers
- The indicator depends on volume data. On instruments with unreliable or synthetic volume (e.g., certain spot forex or CFDs), results may not be meaningful.
- Band-based interpretation should not be used as a signal mechanism on its own.
- On low timeframes, longer-period VWAPs may appear flat or visually compressed.
As with any analytical tool, interpretation requires trader discretion and should be combined with broader context.
僅限邀請腳本
僅作者批准的使用者才能訪問此腳本。您需要申請並獲得使用許可,通常需在付款後才能取得。更多詳情,請依照作者以下的指示操作,或直接聯絡ZenAlgo_Official。
TradingView不建議在未完全信任作者並了解其運作方式的情況下購買或使用腳本。您也可以在我們的社群腳本中找到免費的開源替代方案。
作者的說明
Get access here: https://zenalgo.io
The ZenAlgo team
zenalgo.com
discord.zenalgo.com
zenalgo.com
discord.zenalgo.com
免責聲明
這些資訊和出版物並非旨在提供,也不構成TradingView提供或認可的任何形式的財務、投資、交易或其他類型的建議或推薦。請閱讀使用條款以了解更多資訊。