OPEN-SOURCE SCRIPT
已更新 United HUN City
Purpose and Usage
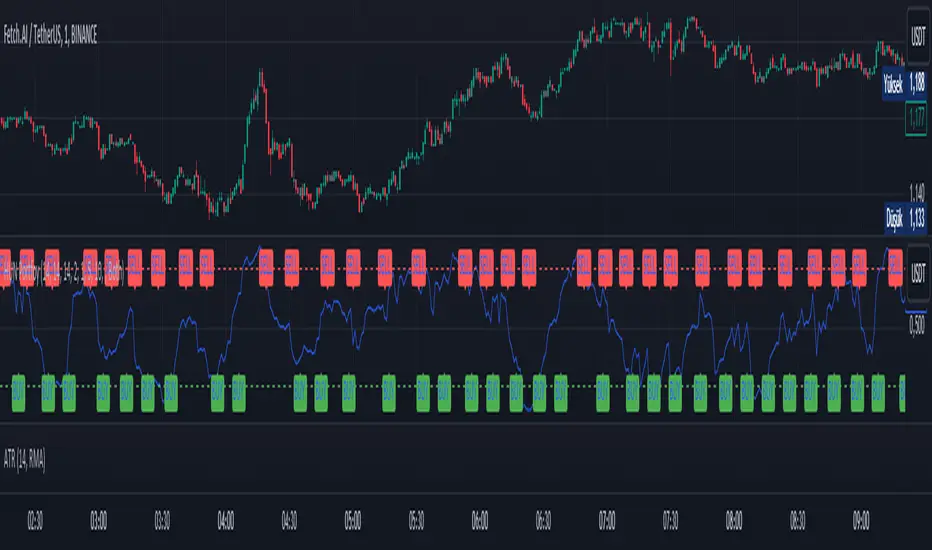
The purpose of this strategy is to create a composite indicator that combines the signals from the MFI, Fisher Transform, and Bollinger Bands %b indicators. By normalizing and averaging these indicators, the script aims to provide a smoother and more comprehensive signal that can be used to make trading decisions.
MFI (Money Flow Index): Measures buying and selling pressure based on price and volume.
Fisher Transform: Highlights potential reversal points by transforming price data to a Gaussian normal distribution.
Bollinger Bands %b: Indicates where the price is relative to the Bollinger Bands, helping to identify overbought or oversold conditions.
The combined indicator can be used to identify potential buy or sell signals based on the smoothed composite value. For instance, a high combined indicator value might indicate overbought conditions, while a low value might indicate oversold conditions.
發行說明
Purpose and UsageThe purpose of this strategy is to create a composite indicator that combines the signals from the MFI, Fisher Transform, and Bollinger Bands %b indicators. By normalizing and averaging these indicators, the script aims to provide a smoother and more comprehensive signal that can be used to make trading decisions.
MFI (Money Flow Index): Measures buying and selling pressure based on price and volume.
Fisher Transform: Highlights potential reversal points by transforming price data to a Gaussian normal distribution.
Bollinger Bands %b: Indicates where the price is relative to the Bollinger Bands, helping to identify overbought or oversold conditions.
The combined indicator can be used to identify potential buy or sell signals based on the smoothed composite value. For instance, a high combined indicator value might indicate overbought conditions, while a low value might indicate oversold conditions.
2 saat önce
Sürüm Notları:
Purpose and Usage
The purpose of this strategy is to create a composite indicator that combines the signals from the MFI, Fisher Transform, and Bollinger Bands %b indicators. By normalizing and averaging these indicators, the script aims to provide a smoother and more comprehensive signal that can be used to make trading decisions.
MFI (Money Flow Index): Measures buying and selling pressure based on price and volume.
Fisher Transform: Highlights potential reversal points by transforming price data to a Gaussian normal distribution.
Bollinger Bands %b: Indicates where the price is relative to the Bollinger Bands, helping to identify overbought or oversold conditions.
The combined indicator can be used to identify potential buy or sell signals based on the smoothed composite value. For instance, a high combined indicator value might indicate overbought conditions, while a low value might indicate oversold conditions.
v2 Notes:
-Buy and Sell Signals Added:
Buy and sell signals are now integrated into the script.
-Band Levels Added:
Horizontal reference lines (bands) at specific levels are included.
-Minimum Number of Bars Between Buy and Sell Signals Added:
A user-defined input for the minimum number of bars between buy and sell signals is implemented.
-HUN Portfoy Percentage Change Added:
The percentage change calculation for the HUN Portfoy combined indicator is included.
發行說明
Added timeframe change on the chart.發行說明
V3 Updates發行說明
v3.1開源腳本
秉持TradingView一貫精神,這個腳本的創作者將其設為開源,以便交易者檢視並驗證其功能。向作者致敬!您可以免費使用此腳本,但請注意,重新發佈代碼需遵守我們的社群規範。
免責聲明
這些資訊和出版物並非旨在提供,也不構成TradingView提供或認可的任何形式的財務、投資、交易或其他類型的建議或推薦。請閱讀使用條款以了解更多資訊。
開源腳本
秉持TradingView一貫精神,這個腳本的創作者將其設為開源,以便交易者檢視並驗證其功能。向作者致敬!您可以免費使用此腳本,但請注意,重新發佈代碼需遵守我們的社群規範。
免責聲明
這些資訊和出版物並非旨在提供,也不構成TradingView提供或認可的任何形式的財務、投資、交易或其他類型的建議或推薦。請閱讀使用條款以了解更多資訊。