INVITE-ONLY SCRIPT
已更新 Summit Line
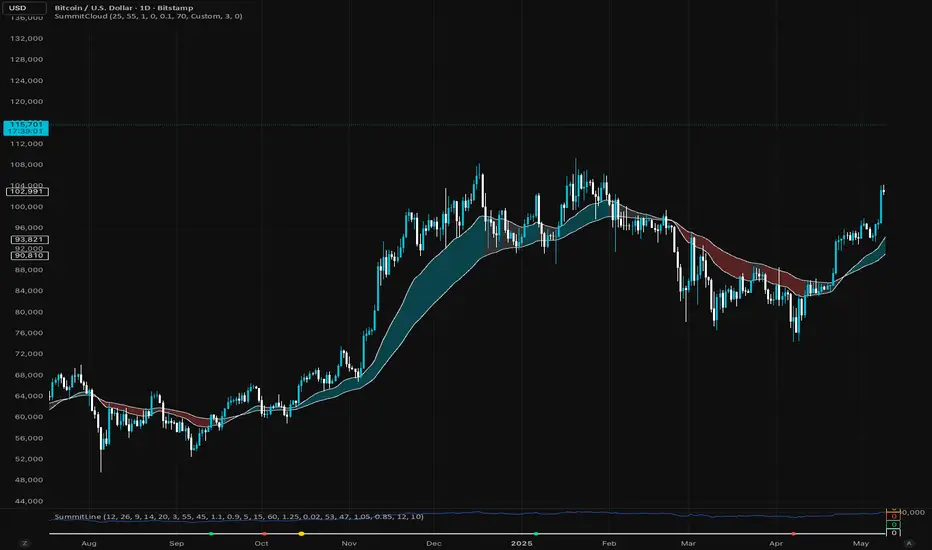
The Summit Line is an advanced momentum and confluence indicator designed to simplify complex market data into clean, actionable dot signals.
It blends MACD, RSI, moving averages and Volume Strength, giving traders a real time gauge of momentum shifts and exhaustion points.
🟢 Green Dot: Bullish confluence
🔴 Red Dot: Bearish confluence
🟡 Gold Dot: “A+” setup, rare alignment of all core metrics, typically at high-probability reversal or breakout zones.
Unlike noisy indicators, Summit Line filters weak signals using RSI slope, volume surges, and EMA trend structure, keeping the chart clean and accurate.
Every dot is pinned along a flat zero baseline for visual simplicity, ideal for combining with the Summit cloud or other price overlays.
發行說明
The Summit Line is an advanced momentum and confluence indicator designed to simplify complex market data into clean, actionable dot signals.It blends MACD, RSI, moving averages and Volume Strength, giving traders a real time gauge of momentum shifts and exhaustion points.
🟢 Green Dot: Bullish confluence
🔴 Red Dot: Bearish confluence
🟡 Gold Dot: “A+” setup, rare alignment of all core metrics, typically at high-probability reversal or breakout zones.
Unlike noisy indicators, Summit Line filters weak signals using RSI slope, volume surges, and EMA trend structure, keeping the chart clean and accurate.
Every dot is pinned along a flat zero baseline for visual simplicity, ideal for combining with the Summit cloud or other price overlays.
僅限邀請腳本
僅作者批准的使用者才能訪問此腳本。您需要申請並獲得使用許可,通常需在付款後才能取得。更多詳情,請依照作者以下的指示操作,或直接聯絡jedhucker。
TradingView不建議在未完全信任作者並了解其運作方式的情況下購買或使用腳本。您也可以在我們的社群腳本中找到免費的開源替代方案。
作者的說明
Welcome to the summit line, a advanced momentum and confluence indicator designed to simplify complex market data into clean, actionable dot signals.
Join the discord for access.
https://whop.com/crypto-summit-club/
免責聲明
這些資訊和出版物並非旨在提供,也不構成TradingView提供或認可的任何形式的財務、投資、交易或其他類型的建議或推薦。請閱讀使用條款以了解更多資訊。