PROTECTED SOURCE SCRIPT
Momentum Squeeze Scalper [M2S} [ITZS]
Overview
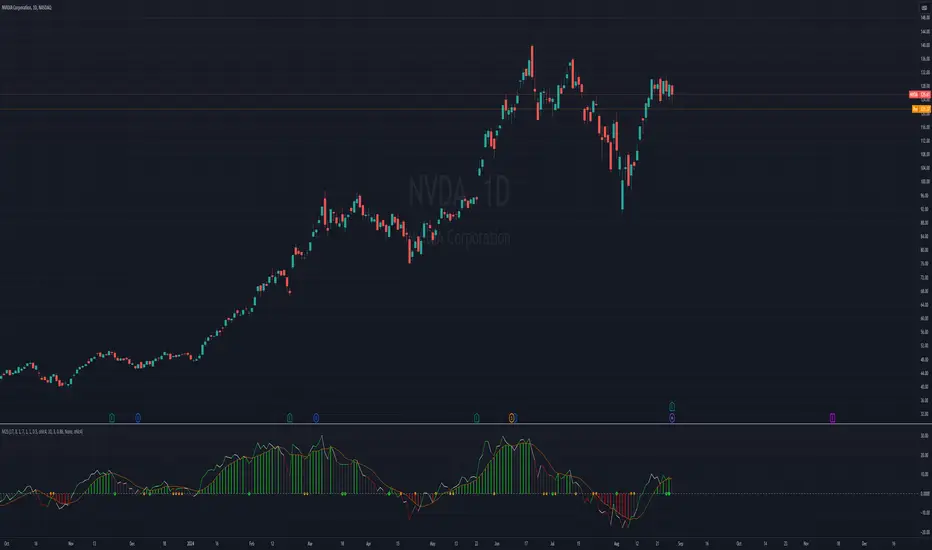
The Momentum Squeeze Scalper [ITZS] is a technical analysis tool designed to identify potential breakout opportunities in the market. It combines elements of momentum analysis with a "squeeze" concept based on Bollinger Bands and Keltner Channels.
Key Components
1. Squeeze Detection
The indicator uses two types of squeezes:
These squeezes can indicate potential breakouts in either direction (long or short).
2. Momentum Line
The Momentum Line is a key feature of this indicator. Its color changes based on specific conditions:
The changing colors of the Momentum Line help traders quickly identify shifts in market momentum and potential trading opportunities.
3. Signal Line
The orange line is the signal line, which is a smoothed version of the momentum line. It can help confirm trend changes when it crosses the momentum line.
Inputs and Their Effects
1. Momentum Period (default: 17):
Purpose: Determines the lookback period for momentum calculation.
Effect: A longer period makes the indicator less sensitive to short-term price changes, resulting in smoother momentum lines but potentially slower signals. A shorter period will make the indicator more responsive to recent price action but may increase noise.
2. Signal Period (default: 8):
Purpose: Sets the smoothing period for the signal line.
Effect: A shorter period makes it more responsive to recent price action, potentially providing earlier signals but with a higher chance of false alerts. A longer period creates a smoother signal line, reducing false signals but potentially delaying entry/exit points.
3. Smooth Momentum (default: false):
Purpose: Determines whether to use EMA smoothing on the source price before momentum calculation.
Effect: When true, it can reduce noise in the momentum calculation, potentially providing clearer signals in choppy markets. When false, it responds more quickly to price changes.
Smoothing Period (default: 1):
Purpose: Sets the period for EMA smoothing when Smooth Momentum is true.
Effect: A higher value creates a smoother momentum line, potentially reducing false signals but also increasing lag.
BB Length (default: 7):
Purpose: Defines the period for Bollinger Bands calculation.
Effect: A shorter length makes the bands more sensitive to price changes, potentially identifying squeezes more quickly but also increasing the chance of false signals. A longer length creates more stable bands but may delay squeeze identification.
StDev (default: 1.0):
Purpose: Standard deviation multiplier for Bollinger Bands.
Effect: Higher values create wider bands, making squeezes less frequent but potentially more significant. Lower values create tighter bands, increasing the frequency of squeezes but potentially reducing their reliability.
Keltner Length (default: 1):
Purpose: Sets the period for Keltner Channel calculation.
Effect: A longer length creates a wider, more stable channel, reducing the frequency of squeezes but potentially making them more reliable. A shorter length creates a tighter channel, increasing squeeze frequency but potentially reducing significance.
Multiplier (default: 0.5):
Purpose: Multiplier for Keltner Channel width.
Effect: Higher values create a wider channel, making squeezes less frequent but potentially more significant. Lower values create a tighter channel, increasing squeeze frequency but potentially reducing their reliability.
KC Smoothing Period (default: 10):
Purpose: Determines the smoothing period for the momentum histogram.
Effect: A longer period creates a smoother histogram, potentially reducing false signals but increasing lag. A shorter period makes the histogram more responsive but potentially noisier.
Smoothing Type (default: None):
Purpose: Allows selection of different smoothing algorithms for the momentum histogram.
Effect: Different smoothing types (e.g., ALMA, DEMA, EMA) can affect how quickly the histogram responds to price changes and how smooth the resulting line is. This can impact the timing and frequency of momentum color changes.
How to Use the Indicator
How to Adjust the Indicator
1. For More Frequent Signals: Decrease the Momentum Period, Signal Period, BB Length, and Keltner Length. Increase the StDev and decrease the Multiplier. This will make the indicator more sensitive but may increase false signals.
2. For Fewer, More Reliable Signals: Increase the Momentum Period, Signal Period, BB Length, and
Keltner Length. Decrease the StDev and increase the Multiplier. This will reduce sensitivity but may miss some opportunities.
3. To Detect Stronger Squeezes: Increase the StDev for Bollinger Bands and decrease the Multiplier for Keltner Channels. This will make it harder for squeezes to occur, potentially identifying stronger setups.
4. To Reduce Noise: Enable Smooth Momentum and increase the Smoothing Period. Choose a smoothing type like EMA or DEMA for the histogram. This can help in choppy or ranging markets.
5. For Faster Response: Decrease the Momentum Period and Signal Period, and choose a responsive smoothing type like EMA for the histogram. This can be useful in fast-moving markets but may increase false signals.
Interpretation and Trading
1. Squeeze Formation: When you see orange (loose) or green (strict) dots, it indicates a potential buildup of energy in the market. This compression often precedes a significant move.
2. Momentum Direction: Watch the Momentum Line color changes:
3. Confirmation: Look for the Momentum Line (colored) to cross above the Signal Line (orange) for bullish confirmation, or below for bearish confirmation.
4. Exit Signals: When the squeeze dots disappear and the Momentum Line color changes, it often indicates that the compressed energy has been released, and the strong move may be ending.
5. Trend Strength: The distance between the Momentum Line and the Signal Line can indicate trend strength. A wider gap suggests a stronger trend.
Remember, no indicator is perfect. Always use this tool in conjunction with other forms of analysis and proper risk management. It's recommended to backtest and practice with this indicator on historical data before using it in live trading. Adjust the inputs based on your trading style, timeframe, and the specific characteristics of the asset you're trading.
The Momentum Squeeze Scalper [ITZS] is a technical analysis tool designed to identify potential breakout opportunities in the market. It combines elements of momentum analysis with a "squeeze" concept based on Bollinger Bands and Keltner Channels.
Key Components
1. Squeeze Detection
The indicator uses two types of squeezes:
- a) Loose TTM Fire (Loose Squeeze): Represented by orange dots. This occurs when one side of the Bollinger Bands is inside the Keltner Channel.
- b) Strict TTM Fire (Strict/Tight Squeeze): Represented by green dots. This happens when both sides of the Bollinger Bands are inside the Keltner Channel.
These squeezes can indicate potential breakouts in either direction (long or short).
- Long Squeeze: Occurs when prices are compressed at a low level, potentially leading to an upward breakout.
- Short Squeeze: Happens when prices are compressed at a high level, possibly leading to a downward breakout.
2. Momentum Line
The Momentum Line is a key feature of this indicator. Its color changes based on specific conditions:
- Color 0 (White): Default color, indicating neutral momentum.
- Color 1 (Green): Indicates positive momentum. This color appears when:
1. The histogram is positive and increasing, or
2. The momentum is increasing during a squeeze (loose or strict), or
3. There's a strict squeeze in place. - Color 2 (Red): Indicates negative momentum. This color appears when:
1. The histogram is negative and decreasing, or
2. The momentum is decreasing during a squeeze (loose or strict), or
3. There's a strict squeeze in place.
The changing colors of the Momentum Line help traders quickly identify shifts in market momentum and potential trading opportunities.
3. Signal Line
The orange line is the signal line, which is a smoothed version of the momentum line. It can help confirm trend changes when it crosses the momentum line.
Inputs and Their Effects
1. Momentum Period (default: 17):
Purpose: Determines the lookback period for momentum calculation.
Effect: A longer period makes the indicator less sensitive to short-term price changes, resulting in smoother momentum lines but potentially slower signals. A shorter period will make the indicator more responsive to recent price action but may increase noise.
2. Signal Period (default: 8):
Purpose: Sets the smoothing period for the signal line.
Effect: A shorter period makes it more responsive to recent price action, potentially providing earlier signals but with a higher chance of false alerts. A longer period creates a smoother signal line, reducing false signals but potentially delaying entry/exit points.
3. Smooth Momentum (default: false):
Purpose: Determines whether to use EMA smoothing on the source price before momentum calculation.
Effect: When true, it can reduce noise in the momentum calculation, potentially providing clearer signals in choppy markets. When false, it responds more quickly to price changes.
Smoothing Period (default: 1):
Purpose: Sets the period for EMA smoothing when Smooth Momentum is true.
Effect: A higher value creates a smoother momentum line, potentially reducing false signals but also increasing lag.
BB Length (default: 7):
Purpose: Defines the period for Bollinger Bands calculation.
Effect: A shorter length makes the bands more sensitive to price changes, potentially identifying squeezes more quickly but also increasing the chance of false signals. A longer length creates more stable bands but may delay squeeze identification.
StDev (default: 1.0):
Purpose: Standard deviation multiplier for Bollinger Bands.
Effect: Higher values create wider bands, making squeezes less frequent but potentially more significant. Lower values create tighter bands, increasing the frequency of squeezes but potentially reducing their reliability.
Keltner Length (default: 1):
Purpose: Sets the period for Keltner Channel calculation.
Effect: A longer length creates a wider, more stable channel, reducing the frequency of squeezes but potentially making them more reliable. A shorter length creates a tighter channel, increasing squeeze frequency but potentially reducing significance.
Multiplier (default: 0.5):
Purpose: Multiplier for Keltner Channel width.
Effect: Higher values create a wider channel, making squeezes less frequent but potentially more significant. Lower values create a tighter channel, increasing squeeze frequency but potentially reducing their reliability.
KC Smoothing Period (default: 10):
Purpose: Determines the smoothing period for the momentum histogram.
Effect: A longer period creates a smoother histogram, potentially reducing false signals but increasing lag. A shorter period makes the histogram more responsive but potentially noisier.
Smoothing Type (default: None):
Purpose: Allows selection of different smoothing algorithms for the momentum histogram.
Effect: Different smoothing types (e.g., ALMA, DEMA, EMA) can affect how quickly the histogram responds to price changes and how smooth the resulting line is. This can impact the timing and frequency of momentum color changes.
How to Use the Indicator
- Look for squeeze dots (orange or green) to identify periods of low volatility.
- Pay attention to the color of the Momentum Line:
1. Green suggests potential bullish momentum
2. Red suggests potential bearish momentum - Use the histogram for additional confirmation of momentum strength and direction.
- Consider entering trades when the squeeze dots disappear and the Momentum Line shows a strong color signal (green for long, red for short).
How to Adjust the Indicator
1. For More Frequent Signals: Decrease the Momentum Period, Signal Period, BB Length, and Keltner Length. Increase the StDev and decrease the Multiplier. This will make the indicator more sensitive but may increase false signals.
2. For Fewer, More Reliable Signals: Increase the Momentum Period, Signal Period, BB Length, and
Keltner Length. Decrease the StDev and increase the Multiplier. This will reduce sensitivity but may miss some opportunities.
3. To Detect Stronger Squeezes: Increase the StDev for Bollinger Bands and decrease the Multiplier for Keltner Channels. This will make it harder for squeezes to occur, potentially identifying stronger setups.
4. To Reduce Noise: Enable Smooth Momentum and increase the Smoothing Period. Choose a smoothing type like EMA or DEMA for the histogram. This can help in choppy or ranging markets.
5. For Faster Response: Decrease the Momentum Period and Signal Period, and choose a responsive smoothing type like EMA for the histogram. This can be useful in fast-moving markets but may increase false signals.
Interpretation and Trading
1. Squeeze Formation: When you see orange (loose) or green (strict) dots, it indicates a potential buildup of energy in the market. This compression often precedes a significant move.
2. Momentum Direction: Watch the Momentum Line color changes:
- Transition to Green: Suggests increasing bullish momentum, especially during a squeeze.
- Transition to Red: Suggests increasing bearish momentum, especially during a squeeze.
- White: Indicates neutral momentum or no clear direction.
3. Confirmation: Look for the Momentum Line (colored) to cross above the Signal Line (orange) for bullish confirmation, or below for bearish confirmation.
4. Exit Signals: When the squeeze dots disappear and the Momentum Line color changes, it often indicates that the compressed energy has been released, and the strong move may be ending.
5. Trend Strength: The distance between the Momentum Line and the Signal Line can indicate trend strength. A wider gap suggests a stronger trend.
Remember, no indicator is perfect. Always use this tool in conjunction with other forms of analysis and proper risk management. It's recommended to backtest and practice with this indicator on historical data before using it in live trading. Adjust the inputs based on your trading style, timeframe, and the specific characteristics of the asset you're trading.
受保護腳本
此腳本以閉源形式發佈。 不過,您可以自由使用,沒有任何限制 — 點擊此處了解更多。
免責聲明
這些資訊和出版物並非旨在提供,也不構成TradingView提供或認可的任何形式的財務、投資、交易或其他類型的建議或推薦。請閱讀使用條款以了解更多資訊。
受保護腳本
此腳本以閉源形式發佈。 不過,您可以自由使用,沒有任何限制 — 點擊此處了解更多。
免責聲明
這些資訊和出版物並非旨在提供,也不構成TradingView提供或認可的任何形式的財務、投資、交易或其他類型的建議或推薦。請閱讀使用條款以了解更多資訊。