OPEN-SOURCE SCRIPT
已更新 TDP 2
Title: Enhanced Candlestick Pattern Identifier with Body Ratio Analysis
Description:
This Pine Script, titled "Enhanced Candlestick Pattern Identifier with Body Ratio Analysis," is designed to aid traders in visualizing key candlestick formations that have significant implications for trend reversals and continuations. It uses the body ratio of candles to identify strong directional movements, enhancing decision-making processes in trading strategies.
Key Features:
Body Ratio Calculation: The script calculates the body ratio of each candle, which is the proportion of the candle's body to its total range. This helps in distinguishing between candles that show decisive market movements versus those with indecision.
Bullish Candle Identification: Identifies bullish candles where the close is greater than the open and the body constitutes at least 55% of the total candle range, indicating strong buying pressure.
Bearish Candle Identification: Flags bearish candles where the open is above the close with a body ratio of 55% or more, highlighting strong selling pressure.
Comparative Analysis: The script not only identifies bearish candles but also categorizes them based on whether they close below the lowest point of the last qualifying bullish candle, offering insights into potential breakdowns or supports.
Visual Markers: Uses distinct shapes and colors to mark each type of candle directly on the chart, making it easy to spot these patterns in real-time trading scenarios.
Utility:
This tool is invaluable for traders who utilize technical analysis to make informed decisions. By providing clear visual cues about significant bullish and bearish candlestick formations, the script facilitates quick interpretations of potential market moves, helping traders to capitalize on trends or protect against losses from reversals.
How to Use:
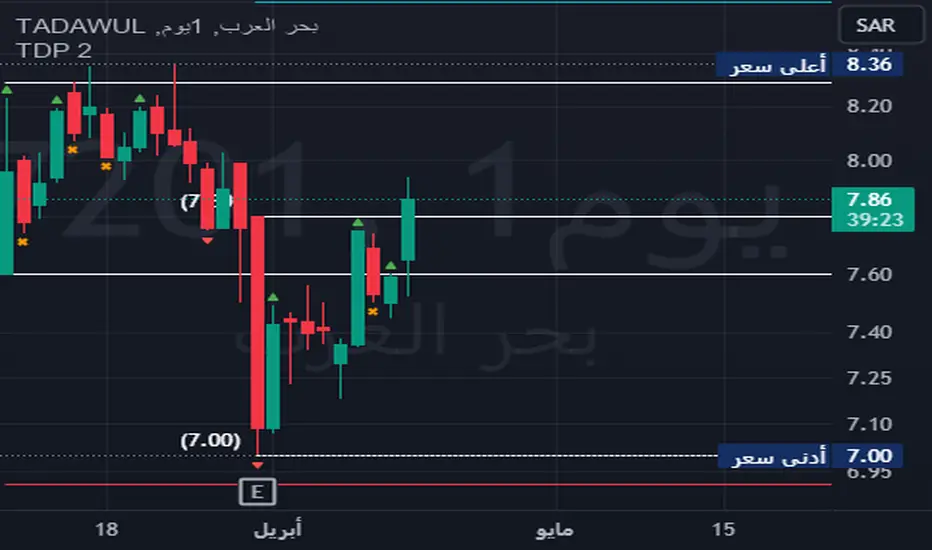
Simply add this script to your chart, and it will automatically highlight the qualifying candles. Green labels indicate strong bullish candles, red labels signify bearish candles closing below the last bullish candle's low, and orange labels show bearish candles that do not close below the bullish low.
Ideal for use in various markets including forex, equities, and commodities, this script is a must-have tool for both novice and experienced traders aiming to enhance their trading strategy with detailed candlestick pattern analysis.
Description:
This Pine Script, titled "Enhanced Candlestick Pattern Identifier with Body Ratio Analysis," is designed to aid traders in visualizing key candlestick formations that have significant implications for trend reversals and continuations. It uses the body ratio of candles to identify strong directional movements, enhancing decision-making processes in trading strategies.
Key Features:
Body Ratio Calculation: The script calculates the body ratio of each candle, which is the proportion of the candle's body to its total range. This helps in distinguishing between candles that show decisive market movements versus those with indecision.
Bullish Candle Identification: Identifies bullish candles where the close is greater than the open and the body constitutes at least 55% of the total candle range, indicating strong buying pressure.
Bearish Candle Identification: Flags bearish candles where the open is above the close with a body ratio of 55% or more, highlighting strong selling pressure.
Comparative Analysis: The script not only identifies bearish candles but also categorizes them based on whether they close below the lowest point of the last qualifying bullish candle, offering insights into potential breakdowns or supports.
Visual Markers: Uses distinct shapes and colors to mark each type of candle directly on the chart, making it easy to spot these patterns in real-time trading scenarios.
Utility:
This tool is invaluable for traders who utilize technical analysis to make informed decisions. By providing clear visual cues about significant bullish and bearish candlestick formations, the script facilitates quick interpretations of potential market moves, helping traders to capitalize on trends or protect against losses from reversals.
How to Use:
Simply add this script to your chart, and it will automatically highlight the qualifying candles. Green labels indicate strong bullish candles, red labels signify bearish candles closing below the last bullish candle's low, and orange labels show bearish candles that do not close below the bullish low.
Ideal for use in various markets including forex, equities, and commodities, this script is a must-have tool for both novice and experienced traders aiming to enhance their trading strategy with detailed candlestick pattern analysis.
發行說明
Title: Enhanced Candlestick Pattern Identifier with Body Ratio AnalysisDescription:
This Pine Script, titled "Enhanced Candlestick Pattern Identifier with Body Ratio Analysis," is designed to aid traders in visualizing key candlestick formations that have significant implications for trend reversals and continuations. It uses the body ratio of candles to identify strong directional movements, enhancing decision-making processes in trading strategies.
Key Features:
Body Ratio Calculation: The script calculates the body ratio of each candle, which is the proportion of the candle's body to its total range. This helps in distinguishing between candles that show decisive market movements versus those with indecision.
Bullish Candle Identification: Identifies bullish candles where the close is greater than the open and the body constitutes at least 55% of the total candle range, indicating strong buying pressure.
Bearish Candle Identification: Flags bearish candles where the open is above the close with a body ratio of 55% or more, highlighting strong selling pressure.
Comparative Analysis: The script not only identifies bearish candles but also categorizes them based on whether they close below the lowest point of the last qualifying bullish candle, offering insights into potential breakdowns or supports.
Visual Markers: Uses distinct shapes and colors to mark each type of candle directly on the chart, making it easy to spot these patterns in real-time trading scenarios.
Utility:
This tool is invaluable for traders who utilize technical analysis to make informed decisions. By providing clear visual cues about significant bullish and bearish candlestick formations, the script facilitates quick interpretations of potential market moves, helping traders to capitalize on trends or protect against losses from reversals.
How to Use:
Simply add this script to your chart, and it will automatically highlight the qualifying candles. Green labels indicate strong bullish candles, red labels signify bearish candles closing below the last bullish candle's low, and orange labels show bearish candles that do not close below the bullish low.
Ideal for use in various markets including forex, equities, and commodities, this script is a must-have tool for both novice and experienced traders aiming to enhance their trading strategy with detailed candlestick pattern analysis.
發行說明
تم حذف الكتابة من الشارت و الاكتفاء بالرموز written word has been removed and just using the symbols to keep the chart clear
開源腳本
秉持TradingView一貫精神,這個腳本的創作者將其設為開源,以便交易者檢視並驗證其功能。向作者致敬!您可以免費使用此腳本,但請注意,重新發佈代碼需遵守我們的社群規範。
免責聲明
這些資訊和出版物並非旨在提供,也不構成TradingView提供或認可的任何形式的財務、投資、交易或其他類型的建議或推薦。請閱讀使用條款以了解更多資訊。
免責聲明
這些資訊和出版物並非旨在提供,也不構成TradingView提供或認可的任何形式的財務、投資、交易或其他類型的建議或推薦。請閱讀使用條款以了解更多資訊。