OPEN-SOURCE SCRIPT
Up vs Down Volume Compared to Price
Hi team,
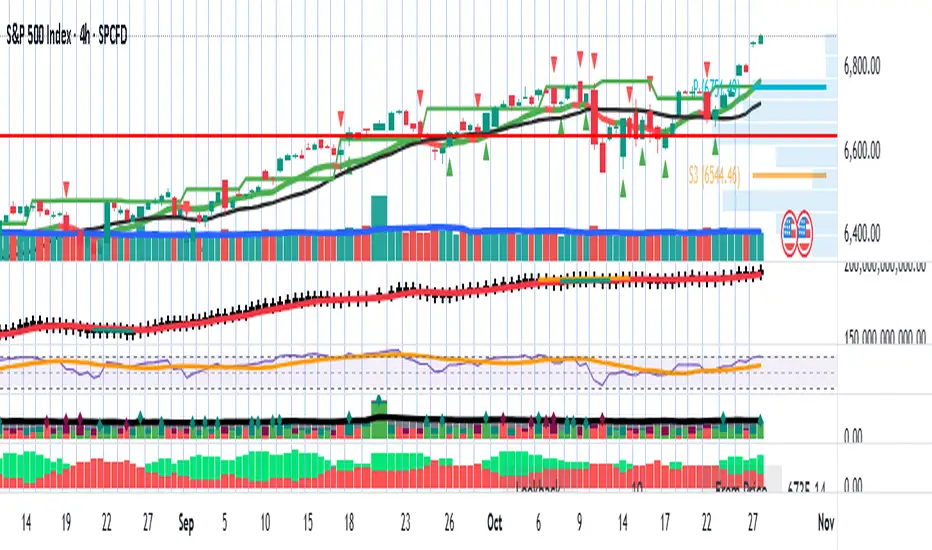
I’ve put together a simple TradingView indicator that breaks down the last N candles into up-moves and down-moves, showing how much volume supported each side. It helps you quickly see whether the market is rallying on strong participation or just drifting higher on weak volume.
The tool tracks total up-volume versus down-volume, compares their ratios, and flags when pullbacks are happening with noticeably lower volume than the prior push up — a setup that often signals a healthy continuation rather than a reversal.
It also shows key metrics like total volume, price change, and up/down ratios directly on the chart for quick assessment. You’ll instantly know if you’re looking at a light-volume pullback or a heavy-volume sell-off.
Let’s test it out across a few symbols and discuss any tweaks we’d like — maybe layering an EMA or VWAP filter for cleaner trend confirmation.
開源腳本
秉持TradingView一貫精神,這個腳本的創作者將其設為開源,以便交易者檢視並驗證其功能。向作者致敬!您可以免費使用此腳本,但請注意,重新發佈代碼需遵守我們的社群規範。
免責聲明
這些資訊和出版物並非旨在提供,也不構成TradingView提供或認可的任何形式的財務、投資、交易或其他類型的建議或推薦。請閱讀使用條款以了解更多資訊。
免責聲明
這些資訊和出版物並非旨在提供,也不構成TradingView提供或認可的任何形式的財務、投資、交易或其他類型的建議或推薦。請閱讀使用條款以了解更多資訊。