OPEN-SOURCE SCRIPT
已更新 Pearson Correlation [Mr_Rakun]
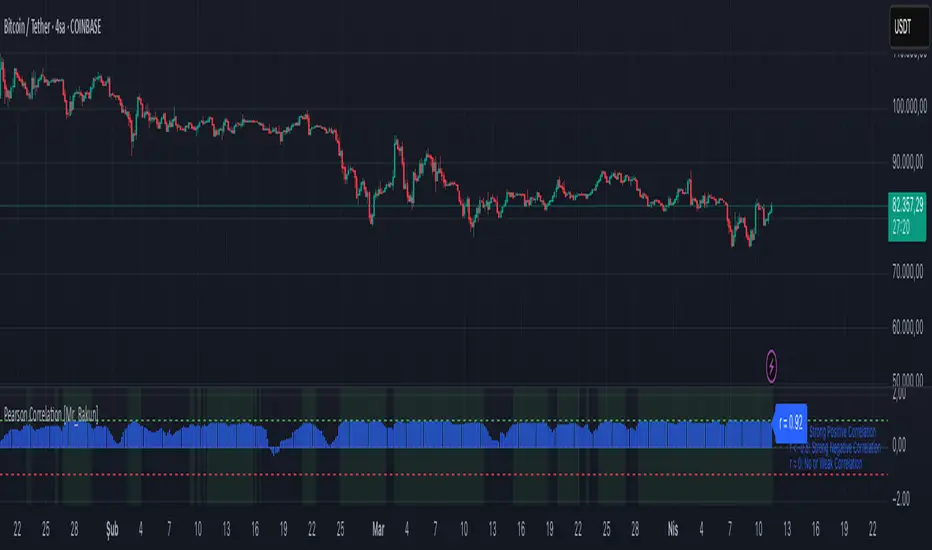
Pearson Correlation
This script calculates the Pearson correlation coefficient (r) between the closing price of the current asset and another selected asset.
🔍 How It Works:
• The user selects a correlation period (default: 20) and a symbol (default: ETH/USDT).
• The script retrieves the closing prices of both assets.
• The Pearson correlation formula is applied:
r = \frac{n(\sum xy) - (\sum x)(\sum y)}{\sqrt{[n\sum x^2 - (\sum x)^2][n\sum y^2 - (\sum y)^2]}}
• The correlation is plotted as a histogram:
• +1 (green line) → Perfect positive correlation
• -1 (red line) → Perfect negative correlation
• 0 (gray line) → No correlation
📊 Why Use This?
This indicator helps traders identify relationships between assets, such as whether two markets move together or inversely. It is useful for hedging strategies, portfolio diversification, and market comparisons.
發行說明
- Info開源腳本
秉持TradingView一貫精神,這個腳本的創作者將其設為開源,以便交易者檢視並驗證其功能。向作者致敬!您可以免費使用此腳本,但請注意,重新發佈代碼需遵守我們的社群規範。
免責聲明
這些資訊和出版物並非旨在提供,也不構成TradingView提供或認可的任何形式的財務、投資、交易或其他類型的建議或推薦。請閱讀使用條款以了解更多資訊。
免責聲明
這些資訊和出版物並非旨在提供,也不構成TradingView提供或認可的任何形式的財務、投資、交易或其他類型的建議或推薦。請閱讀使用條款以了解更多資訊。