INVITE-ONLY SCRIPT
DMA AND SMMA
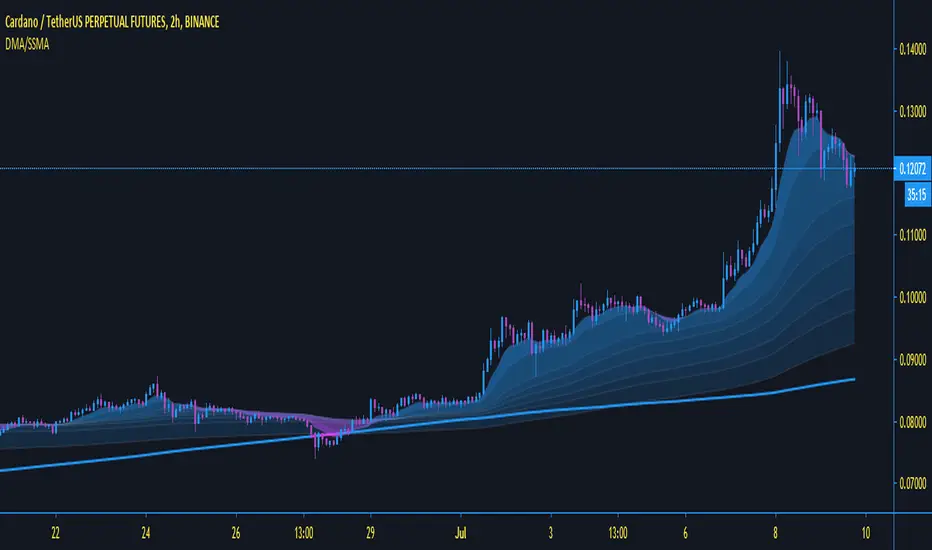
This "on chart" indicator is used purely as a visual sentiment to directional momentum of the pair you are looking at.
it is split into two parts, both of which i will explain below.
1, The SMA (purple and blue fading visual mas) this is used to find the directional momentum
2, the DMA (a slightly delayed Moving Average), is used to decide if the market is in a bullish or bearish move, hence determining whether or not to go long or short.
-only go long when price above DMA, and short, below.
i have found it very good at calling out bad trades, when the direction changes quickly.
same as all my other indicators this is fully adjustable in the settings.
i find, with the standard settings, it works best on the 2 hour timeframe as shown, but again, can be used on any time frame.
For access, send me a DM on TradingView
僅限邀請腳本
僅作者批准的使用者才能訪問此腳本。您需要申請並獲得使用許可,通常需在付款後才能取得。更多詳情,請依照作者以下的指示操作,或直接聯絡Underdog-Trading。
TradingView不建議在未完全信任作者並了解其運作方式的情況下購買或使用腳本。您也可以在我們的社群腳本中找到免費的開源替代方案。
作者的說明
免責聲明
這些資訊和出版物並非旨在提供,也不構成TradingView提供或認可的任何形式的財務、投資、交易或其他類型的建議或推薦。請閱讀使用條款以了解更多資訊。
僅限邀請腳本
僅作者批准的使用者才能訪問此腳本。您需要申請並獲得使用許可,通常需在付款後才能取得。更多詳情,請依照作者以下的指示操作,或直接聯絡Underdog-Trading。
TradingView不建議在未完全信任作者並了解其運作方式的情況下購買或使用腳本。您也可以在我們的社群腳本中找到免費的開源替代方案。
作者的說明
免責聲明
這些資訊和出版物並非旨在提供,也不構成TradingView提供或認可的任何形式的財務、投資、交易或其他類型的建議或推薦。請閱讀使用條款以了解更多資訊。