OPEN-SOURCE SCRIPT
Standard Deviation W/Q/M Pivots
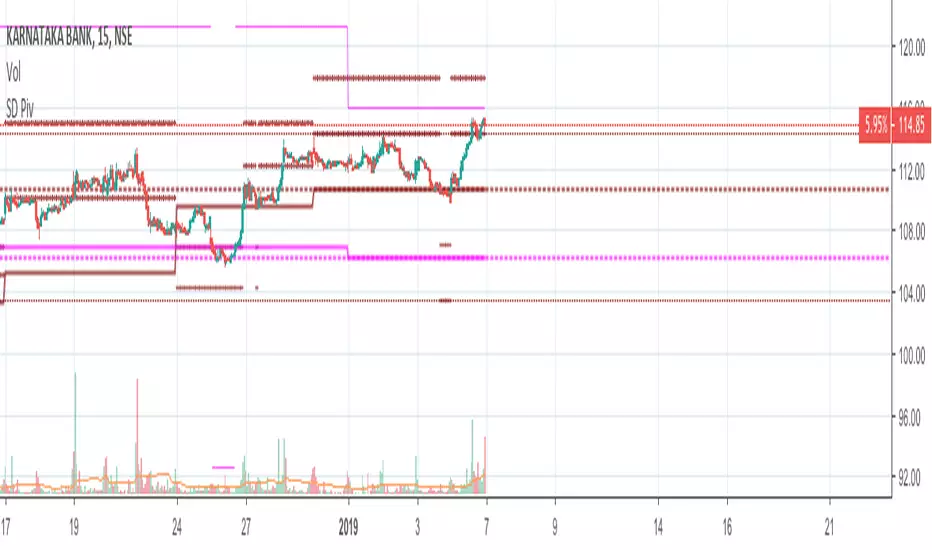
This is a re-iteration of the standard deviation of daily pivots with the pivots applied on weekly, monthly, quarterly and yearly levels. For intraday traders the weekly pivot points will act as a major support resistance levels. Quarterly and monthly pivot points are useful for short-term positions while the yearly pivot determines the stock's long term support-resistance levels and useful in determining if the stock is in a bullish/bearish leg.
開源腳本
秉持TradingView一貫精神,這個腳本的創作者將其設為開源,以便交易者檢視並驗證其功能。向作者致敬!您可以免費使用此腳本,但請注意,重新發佈代碼需遵守我們的社群規範。
免責聲明
這些資訊和出版物並非旨在提供,也不構成TradingView提供或認可的任何形式的財務、投資、交易或其他類型的建議或推薦。請閱讀使用條款以了解更多資訊。
免責聲明
這些資訊和出版物並非旨在提供,也不構成TradingView提供或認可的任何形式的財務、投資、交易或其他類型的建議或推薦。請閱讀使用條款以了解更多資訊。