PINE LIBRARY
已更新 mZigzag
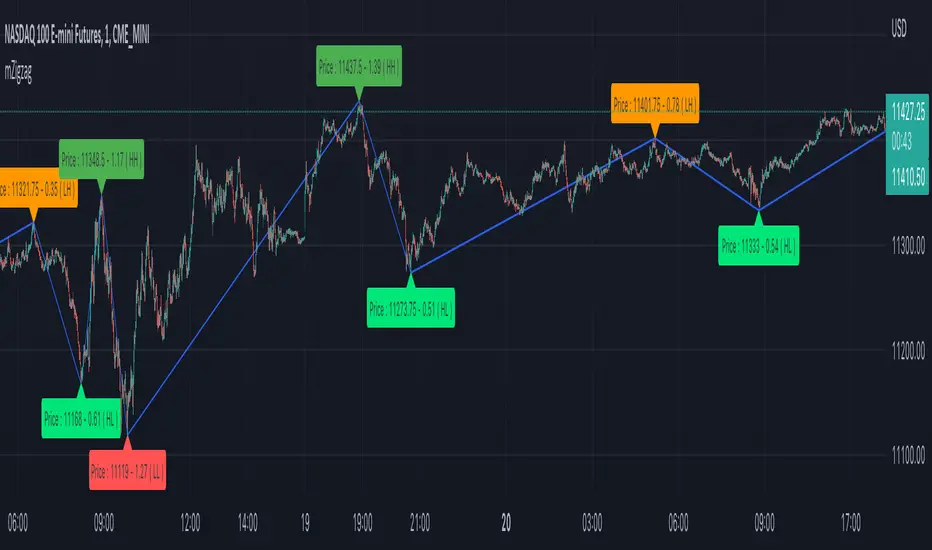
Library "mZigzag"
Matrix implementation of zigzag to allow further possibilities.
Main advantage of this library over previous zigzag methods is that you can attach any number of indicator/oscillator information to zigzag
calculate(length, ohlc, indicatorHigh, indicatorLow, numberOfPivots) calculates zigzag and related information
Parameters:
length: is zigzag length
ohlc: array of OHLC values to be used for zigzag calculation
indicatorHigh: Array of indicator values calculated based on high price of OHLC
indicatorLow: Array of indicators values calculated based on low price of OHLC
numberOfPivots: Number of pivots to be returned
Returns: pivotMatrix Matrix containing zigzag pivots, pivot bars, direction, ratio, and indicators added via indicatorHigh/indicatorLow
newZG is true if a new pivot is added to array
doubleZG is true if last calculation returned two new pivots (Happens on extreme price change)
draw(length, ohlc, indicatorLabels, indicatorHigh, indicatorLow, numberOfPivots, lineColor, lineWidth, lineStyle, showHighLow, showRatios, showIndicators) draws zigzag and related information
Parameters:
length: is zigzag length
ohlc: array of OHLC values to be used for zigzag calculation
indicatorLabels: Array of name of indicators passed
indicatorHigh: Array of indicator values calculated based on high price of OHLC
indicatorLow: Array of indicators values calculated based on low price of OHLC
numberOfPivots: Number of pivots to be returned
lineColor: zigzag line color. set to blue by default
lineWidth: zigzag line width. set to 1 by default
lineStyle: zigzag line style. set to line.style_solid by default
showHighLow: show HH, HL, LH, LL labels
showRatios: show pivot retracement ratios from previous zigzag
showIndicators: show indicator values
Returns: pivotMatrix Matrix containing zigzag pivots, pivot bars, direction, ratio, and indicators added via indicatorHigh/indicatorLow
zigzaglines array of zigzag lines
zigzaglabels array of zigzag labels
發行說明
v2Updated:
draw(length, ohlc, indicatorLabels, indicatorHigh, indicatorLow, numberOfPivots, lineColor, lineWidth, lineStyle, showLabel, showIndicators) draws zigzag and related information
Parameters:
length: is zigzag length
ohlc: array of OHLC values to be used for zigzag calculation
indicatorLabels: Array of name of indicators passed
indicatorHigh: Array of indicator values calculated based on high price of OHLC
indicatorLow: Array of indicators values calculated based on low price of OHLC
numberOfPivots: Number of pivots to be returned
lineColor: zigzag line color. set to blue by default
lineWidth: zigzag line width. set to 1 by default
lineStyle: zigzag line style. set to line.style_solid by default
showLabel: Show pivot label
showIndicators: Include indicators in labels. If set to false, indicators are shown as tooltips
Returns: valueMatrix Matrix containing zigzag pivots for price and indicators
directionMatrix Matrix containing direction of price and indicator values at pivots
ratioMatrix Matrix containing ratios of price and indicator values at pivots
barArray Array containing pivot bars
zigzaglines array of zigzag lines
zigzaglabels array of zigzag labels
發行說明
v3Updated:
calculate(length, ohlc, indicatorHigh, indicatorLow, numberOfPivots, supertrendLength) calculates zigzag and related information
Parameters:
length: is zigzag length
ohlc: array of OHLC values to be used for zigzag calculation
indicatorHigh: Array of indicator values calculated based on high price of OHLC
indicatorLow: Array of indicators values calculated based on low price of OHLC
numberOfPivots: Number of pivots to be returned
supertrendLength: is number of pivot history to calculate supertrend
Returns: valueMatrix Matrix containing zigzag pivots for price and indicators
directionMatrix Matrix containing direction of price and indicator values at pivots
ratioMatrix Matrix containing ratios of price and indicator values at pivots
divergenceMatrix matrix containing divergence details for each indicators
doubleDivergenceMatrix matrix containing double divergence details for each indicators
barArray Array containing pivot bars
supertrendDir is direction of zigzag based supertrend
supertrend is supertrend value of zigzag based supertrend
newZG is true if a new pivot is added to array
doubleZG is true if last calculation returned two new pivots (Happens on extreme price change)
發行說明
v4Added:
calculate2(length, ohlc, indicatorHigh, indicatorLow, numberOfPivots, supertrendLength) calculates zigzag and related information uses shift/unshift rather than pop and push
Parameters:
length: is zigzag length
ohlc: array of OHLC values to be used for zigzag calculation
indicatorHigh: Array of indicator values calculated based on high price of OHLC
indicatorLow: Array of indicators values calculated based on low price of OHLC
numberOfPivots: Number of pivots to be returned
supertrendLength: is number of pivot history to calculate supertrend
Returns: valueMatrix Matrix containing zigzag pivots for price and indicators
directionMatrix Matrix containing direction of price and indicator values at pivots
ratioMatrix Matrix containing ratios of price and indicator values at pivots
divergenceMatrix matrix containing divergence details for each indicators
doubleDivergenceMatrix matrix containing double divergence details for each indicators
barArray Array containing pivot bars
supertrendDir is direction of zigzag based supertrend
supertrend is supertrend value of zigzag based supertrend
newZG is true if a new pivot is added to array
doubleZG is true if last calculation returned two new pivots (Happens on extreme price change)
發行說明
v5Added:
calculateplain(length, ohlc, indicatorHigh, indicatorLow, numberOfPivots) calculates zigzag and related information uses shift/unshift rather than pop and push. Also does not calculate divergence and ratios.
Parameters:
length: is zigzag length
ohlc: array of OHLC values to be used for zigzag calculation
indicatorHigh: Array of indicator values calculated based on high price of OHLC
indicatorLow: Array of indicators values calculated based on low price of OHLC
numberOfPivots: Number of pivots to be returned
Returns: valueMatrix Matrix containing zigzag pivots for price and indicators
directionArray Matrix containing direction of price and indicator values at pivots
barArray Array containing pivot bars
newZG is true if a new pivot is added to array
doubleZG is true if last calculation returned two new pivots (Happens on extreme price change)
Removed:
calculate2(length, ohlc, indicatorHigh, indicatorLow, numberOfPivots, supertrendLength) calculates zigzag and related information uses shift/unshift rather than pop and push
發行說明
v6Updated:
calculateplain(length, ohlc, indicatorHigh, indicatorLow, numberOfPivots) calculates zigzag and related information uses shift/unshift rather than pop and push. Also does not calculate divergence and ratios.
Parameters:
length: is zigzag length
ohlc: array of OHLC values to be used for zigzag calculation
indicatorHigh: Array of indicator values calculated based on high price of OHLC
indicatorLow: Array of indicators values calculated based on low price of OHLC
numberOfPivots: Number of pivots to be returned
Returns: valueMatrix Matrix containing zigzag pivots for price and indicators
directionArray Matrix containing direction of price and indicator values at pivots
barArray Array containing pivot bars
newZG is true if a new pivot is added to array
doubleZG is true if last calculation returned two new pivots (Happens on extreme price change)
發行說明
v7發行說明
v8Fixed an edge case highlighted by mortdiggiddy
發行說明
v9發行說明
v10發行說明
v11發行說明
v12Pine腳本庫
秉持TradingView一貫精神,作者已將此Pine代碼以開源函式庫形式發佈,方便我們社群中的其他Pine程式設計師重複使用。向作者致敬!您可以在私人專案或其他開源發表中使用此函式庫,但在公開發表中重用此代碼須遵守社群規範。
Trial - trendoscope.io/trial
Subscribe - trendoscope.io/pricing
Blog - docs.trendoscope.io
Subscribe - trendoscope.io/pricing
Blog - docs.trendoscope.io
免責聲明
這些資訊和出版物並非旨在提供,也不構成TradingView提供或認可的任何形式的財務、投資、交易或其他類型的建議或推薦。請閱讀使用條款以了解更多資訊。
Pine腳本庫
秉持TradingView一貫精神,作者已將此Pine代碼以開源函式庫形式發佈,方便我們社群中的其他Pine程式設計師重複使用。向作者致敬!您可以在私人專案或其他開源發表中使用此函式庫,但在公開發表中重用此代碼須遵守社群規範。
Trial - trendoscope.io/trial
Subscribe - trendoscope.io/pricing
Blog - docs.trendoscope.io
Subscribe - trendoscope.io/pricing
Blog - docs.trendoscope.io
免責聲明
這些資訊和出版物並非旨在提供,也不構成TradingView提供或認可的任何形式的財務、投資、交易或其他類型的建議或推薦。請閱讀使用條款以了解更多資訊。