OPEN-SOURCE SCRIPT
已更新 David_FairPriceCandlestick_calculated
Description:
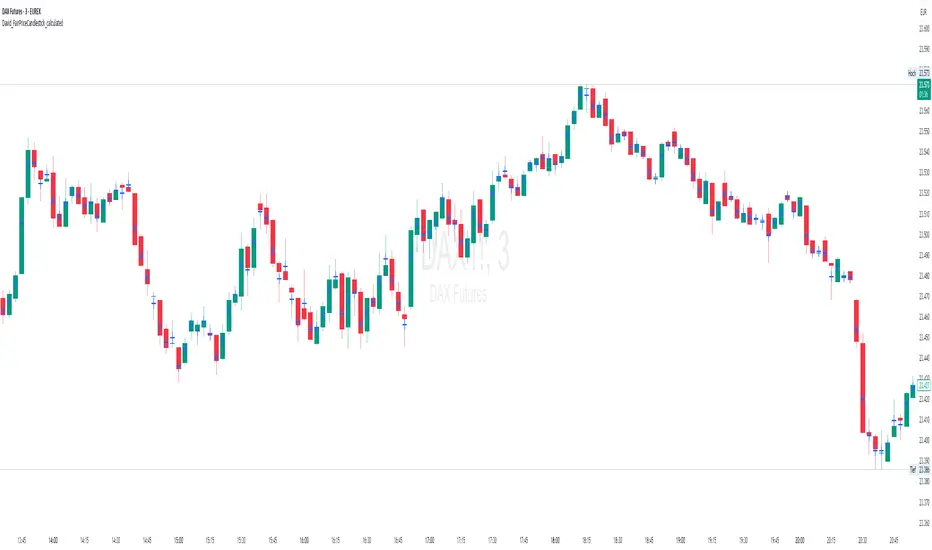
This indicator displays the "Typical Price" for each candle as a visual marker (cross) directly on the chart. The Typical Price is calculated as the average of the High, Low, and Close values of each bar:
(High + Low + Close) / 3
The marker provides a quick visual reference to the fair or average price level within every single candle.
Unlike a Point of Control (POC) or volume-based indicators, this script works purely with price data and is independent of volume or order flow.
Use cases:
Identify where most trading activity may have been concentrated within the candle (for price-based strategies)
Support as a reference line for mean-reversion or fair value concepts
Works on all timeframes and instruments
Customization:
You can easily change the marker style (cross, dot, triangle, etc.) and color within the script.
發行說明
Description:This indicator displays the "Typical Price" for each candle as a visual marker (cross) directly on the chart. The Typical Price is calculated as the average of the High, Low, and Close values of each bar:
(High + Low + Close) / 3
The marker provides a quick visual reference to the fair or average price level within every single candle.
Unlike a Point of Control (POC) or volume-based indicators, this script works purely with price data and is independent of volume or order flow.
Use cases:
Identify where most trading activity may have been concentrated within the candle (for price-based strategies)
Support as a reference line for mean-reversion or fair value concepts
Works on all timeframes and instruments
Customization:
You can easily change the marker style (cross, dot, triangle, etc.) and color within the script.
開源腳本
秉持TradingView一貫精神,這個腳本的創作者將其設為開源,以便交易者檢視並驗證其功能。向作者致敬!您可以免費使用此腳本,但請注意,重新發佈代碼需遵守我們的社群規範。
免責聲明
這些資訊和出版物並非旨在提供,也不構成TradingView提供或認可的任何形式的財務、投資、交易或其他類型的建議或推薦。請閱讀使用條款以了解更多資訊。
免責聲明
這些資訊和出版物並非旨在提供,也不構成TradingView提供或認可的任何形式的財務、投資、交易或其他類型的建議或推薦。請閱讀使用條款以了解更多資訊。