OPEN-SOURCE SCRIPT
LargestMarketCaps
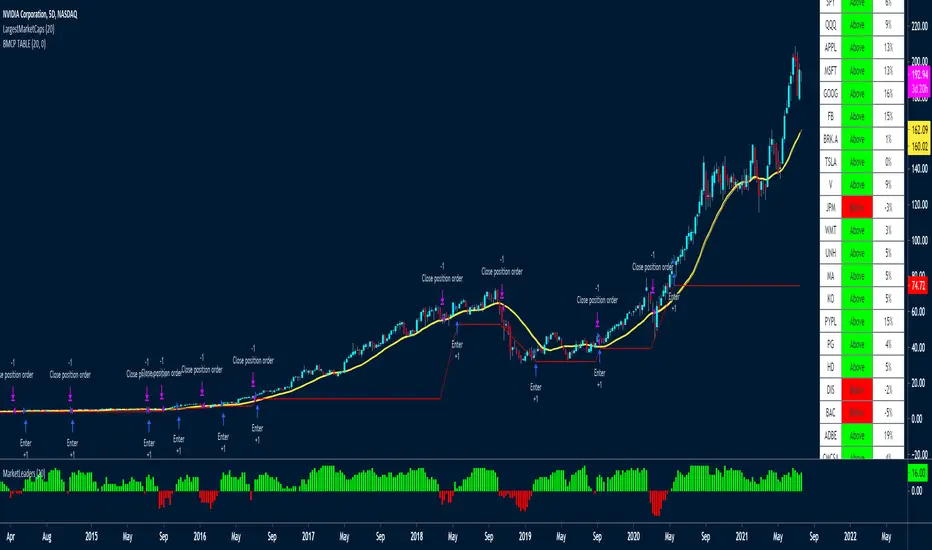
This trading system uses a MA to check if the LARGEST CAP stocks are above or below the MA.
You can see from the indicator below how well it manages to capture big moves.
These are the tickers that the strategy and indicator currently looks at
The tickers will need to be updated every 6-12 months to remove and ad those who have dropped out of the largest 20 stocks.
It would be a good idea to create a watchlist and alerts for the Large Cap tickers so you can scroll through to see how the system performed on each ticker
"SPX"
"QQQ"
"AAPL"
"MSFT"
"GOOG"
"FB"
"BRK.A"
"TSLA"
"V"
"JPM"
"WMT"
"UNH"
"MA"
"KO"
"PYPL"
"PG"
"HD"
"DIS"
"BAC"
"ADBE"
"CMCSA"
"NKE"
RELATED IDEAS / Indicators
* Market Leaders Ribbon

* Market Leaders Large Performance Table

You can see from the indicator below how well it manages to capture big moves.
- It aggregates the data of all the tickers to create the histogram indicator at the bottom of the chart called MarketLeaders.
- If a ticker is above its moving average, then the output will increase by +1 and -1 if a ticker is below its moving average.
- This is a powerful system because it uses not only data from one stock but from the stocks that really affect the market big time. If those stocks don't do well, the market won't do well either.
- Basically if all the market leaders are doing well, then this system will buy those 20 tickers and keep positions open until the MarketLeaders indicator crosses below 0 -- meaning red.
- It also has a red stop loss line, with a wide 15% stop loss to keep us in the trades for the long term.
- I've used a 5-day chart because I wanted fewer signals, but higher quality signals.
- There are no profit targets, this exits when the indicator turns red -- meaning below 0 or if a position falls 15% in price.
- The MA setting is adjustable, the default is 20
These are the tickers that the strategy and indicator currently looks at
The tickers will need to be updated every 6-12 months to remove and ad those who have dropped out of the largest 20 stocks.
It would be a good idea to create a watchlist and alerts for the Large Cap tickers so you can scroll through to see how the system performed on each ticker
"SPX"
"QQQ"
"AAPL"
"MSFT"
"GOOG"
"FB"
"BRK.A"
"TSLA"
"V"
"JPM"
"WMT"
"UNH"
"MA"
"KO"
"PYPL"
"PG"
"HD"
"DIS"
"BAC"
"ADBE"
"CMCSA"
"NKE"
RELATED IDEAS / Indicators
* Market Leaders Ribbon
* Market Leaders Large Performance Table
開源腳本
秉持TradingView一貫精神,這個腳本的創作者將其設為開源,以便交易者檢視並驗證其功能。向作者致敬!您可以免費使用此腳本,但請注意,重新發佈代碼需遵守我們的社群規範。
免責聲明
這些資訊和出版物並非旨在提供,也不構成TradingView提供或認可的任何形式的財務、投資、交易或其他類型的建議或推薦。請閱讀使用條款以了解更多資訊。
開源腳本
秉持TradingView一貫精神,這個腳本的創作者將其設為開源,以便交易者檢視並驗證其功能。向作者致敬!您可以免費使用此腳本,但請注意,重新發佈代碼需遵守我們的社群規範。
免責聲明
這些資訊和出版物並非旨在提供,也不構成TradingView提供或認可的任何形式的財務、投資、交易或其他類型的建議或推薦。請閱讀使用條款以了解更多資訊。