OPEN-SOURCE SCRIPT
已更新 [dharmatech] U.S. Treasury Yield Curve
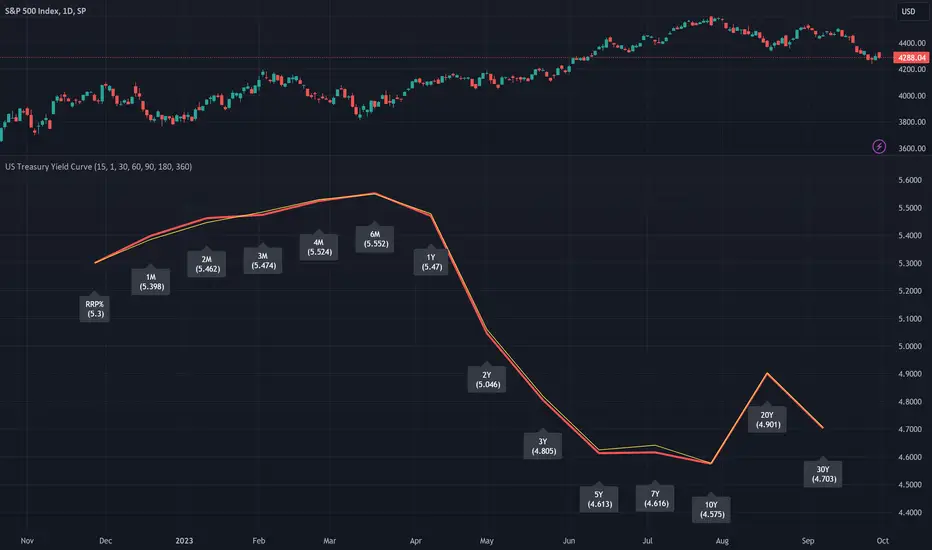
This indicator displays the U.S. Treasury Securities Yield Curve.
This is a fork of the US Treasury Yield Curve indicator by @longflat. Thank you for sharing your work!
There are already so many yield curve indicators on TradingView.
What makes this one different?
Update to version 5 of Pine Script
Add RRP%
Add 4 month
Add 20 year
Show previous day's yield curve
Options for prior yield curves
The thick red line shows the latest yield curve.
The yellow line shows the yield curve 1 bar ago.
So, if your timeframe is set to 1 day, the yellow line will show yesterday's yield curve.
發行說明
Hardcoded timeframe of securities to 1D.Without this, RRP doesn't load at lower timeframes.
Also, without this, at lower timeframes, the yield curve difference is sometimes hardly noticeable.
開源腳本
秉持TradingView一貫精神,這個腳本的創作者將其設為開源,以便交易者檢視並驗證其功能。向作者致敬!您可以免費使用此腳本,但請注意,重新發佈代碼需遵守我們的社群規範。
免責聲明
這些資訊和出版物並非旨在提供,也不構成TradingView提供或認可的任何形式的財務、投資、交易或其他類型的建議或推薦。請閱讀使用條款以了解更多資訊。
開源腳本
秉持TradingView一貫精神,這個腳本的創作者將其設為開源,以便交易者檢視並驗證其功能。向作者致敬!您可以免費使用此腳本,但請注意,重新發佈代碼需遵守我們的社群規範。
免責聲明
這些資訊和出版物並非旨在提供,也不構成TradingView提供或認可的任何形式的財務、投資、交易或其他類型的建議或推薦。請閱讀使用條款以了解更多資訊。