OPEN-SOURCE SCRIPT
CCI Super Bands
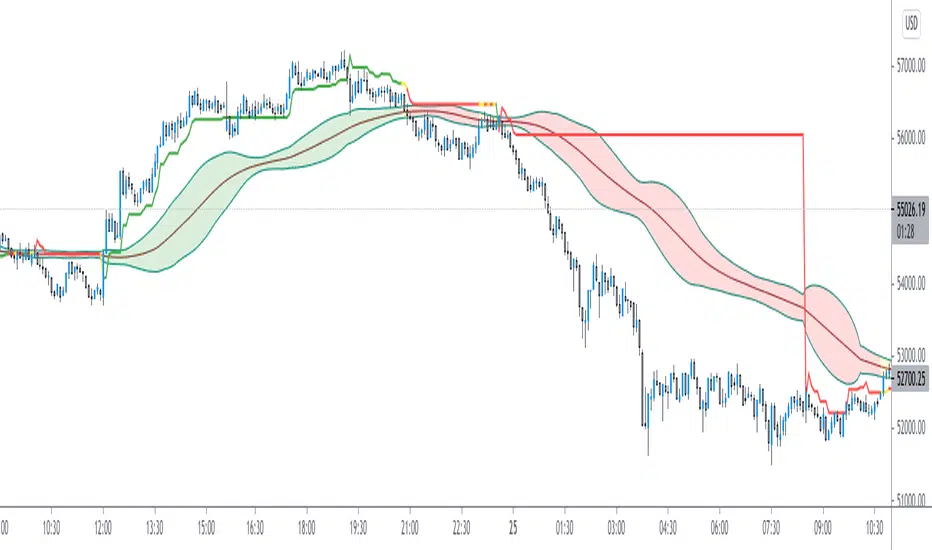
CCi Super Bands,
Is an Indicator to plot Commodity Channel Index Projections over the Price Chart
It's offers interesting price Analysis
There are two major parts to the indicator!
1. The Optimal CCI Line
2. A CCI Standard Deviation Bands
Color Codes Meaning:
Red : Strength in Bearish Intent
Green : Strength in Bullish Intent
Yellow : Consolidation estimations
Try to play with this indicator
and Enjoy
開源腳本
秉持TradingView一貫精神,這個腳本的創作者將其設為開源,以便交易者檢視並驗證其功能。向作者致敬!您可以免費使用此腳本,但請注意,重新發佈代碼需遵守我們的社群規範。
Get Ocs Ai Trader, Your personal Ai Trade Assistant here
→ ocstrader.com
About me
AlgoTrading Certification, ( University of Oxford, Säid Business School )
PGP Research Analysis, ( NISM, SEBI )
Electronics Engineer
→ ocstrader.com
About me
AlgoTrading Certification, ( University of Oxford, Säid Business School )
PGP Research Analysis, ( NISM, SEBI )
Electronics Engineer
免責聲明
這些資訊和出版物並非旨在提供,也不構成TradingView提供或認可的任何形式的財務、投資、交易或其他類型的建議或推薦。請閱讀使用條款以了解更多資訊。