OPEN-SOURCE SCRIPT
已更新 Normalized Dist from 4H MA200 + Chart Highlights
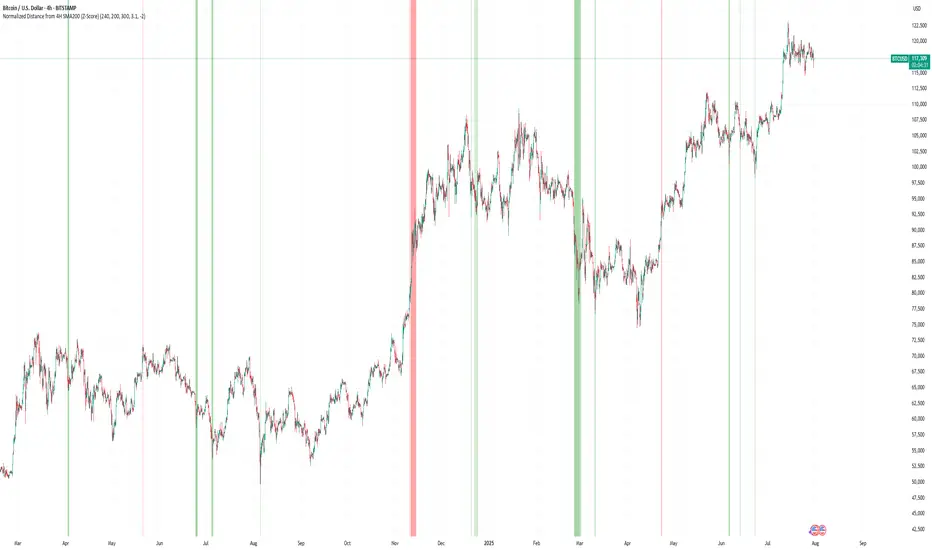
Normalized Distance from 4H EMA200 + Highlighting Extremes
This indicator measures the distance between the current price and the 4-hour EMA200, normalized into a z-score to detect statistically significant deviations.
🔹 The lower pane shows the normalized z-score.
🔹 Green background = price far below EMA200 (z < -2).
🔹 Red background = price far above EMA200 (z > 3.1).
🔹 These thresholds are user-configurable.
🔹 On the main chart:
🟥 Red candles indicate overheated prices (z > upper threshold)
🟩 Green candles signal oversold conditions (z < lower threshold)
The EMA200 is always taken from a fixed 4H timeframe, regardless of your current chart resolution.
發行說明
Normalized Distance from 4H EMA200 + Highlighting ExtremesThis indicator measures the distance between the current price and the 4-hour EMA200, normalized into a z-score to detect statistically significant deviations.
🔹 The lower pane shows the normalized z-score.
🔹 Green background = price far below EMA200 (z < -2).
🔹 Red background = price far above EMA200 (z > 3.1).
🔹 These thresholds are user-configurable.
🔹 On the main chart:
🟥 Red candles indicate overheated prices (z > upper threshold)
🟩 Green candles signal oversold conditions (z < lower threshold)
The EMA200 is always taken from a fixed 4H timeframe, regardless of your current chart resolution.
開源腳本
秉持TradingView一貫精神,這個腳本的創作者將其設為開源,以便交易者檢視並驗證其功能。向作者致敬!您可以免費使用此腳本,但請注意,重新發佈代碼需遵守我們的社群規範。
免責聲明
這些資訊和出版物並非旨在提供,也不構成TradingView提供或認可的任何形式的財務、投資、交易或其他類型的建議或推薦。請閱讀使用條款以了解更多資訊。
免責聲明
這些資訊和出版物並非旨在提供,也不構成TradingView提供或認可的任何形式的財務、投資、交易或其他類型的建議或推薦。請閱讀使用條款以了解更多資訊。