INVITE-ONLY SCRIPT
已更新 Auction Finder
█ OVERVIEW
Auction Finder is an imbalance-based trading indicator that offers valuable insight into supply and demand "auctions" within financial markets. Knowing what type of auctioning is happening around certain prices can give traders a significant advantage.
The framework of this indicator was designed to detect buyer/seller imbalances. This type of information is particularly important for professional traders who rely on a deep understanding of market dynamics to analyze supply and demand when making strategic trading decisions.
Price action trends are a critical aspect of trading, and analyzing supply and demand can provide valuable insights into these trends on all timeframes. Traders who take the time to understand these factors can improve their decision-making processes and achieve greater success in the markets.
Auction Finder helps traders pinpoint supply and demand imbalances that can lead to significant price movements. This is particularly valuable in volatile markets where quick decision-making and careful risk management are essential.
█ CONCEPTS
Auction Finder's algorithm incorporates several technical analysis tools when analyzing whether a supply/demand level is still acting as a support/resistance level. The main component is price action analysis, which involves analyzing how price behaves around the demand level.
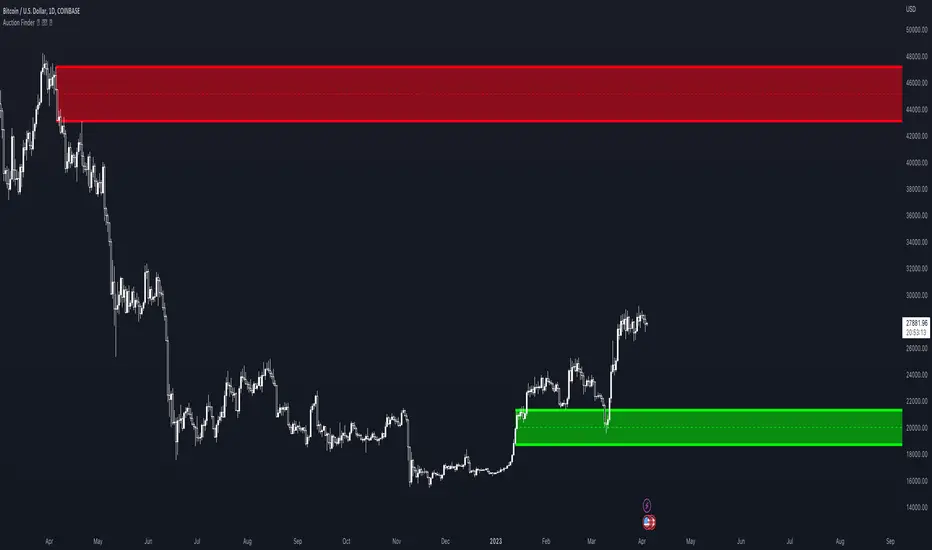
Auction Finder is a technical indicator used in financial markets to identify supply and demand zones or auction areas on a price chart. When the indicator confirms a supply or demand zone, the box representing the zone will be filled with either all-green (for confirmed demand) or all-red (for confirmed supply) color.
However, there are cases where the supply or demand zone is absorbed, meaning that the market has absorbed all the available supply or demand in that zone. In these cases, the box representing the zone may appear green or red, but with no fill. This indicates that the zone was a significant area of interest in the past, but is no longer considered an active supply or demand zone.
Auction Finder's color-coding system can be helpful for traders and investors to identify potential buying or selling opportunities based on historical supply and demand levels. By identifying areas of confirmed or absorbed supply and demand, traders can anticipate potential areas of support or resistance in the future, which can aid in making more informed trading decisions.
For example, if a trader sees a confirmed demand zone with an all-green box fill color, they may expect buyers to be active in that area and anticipate a potential upward movement in price as demand absorbs available supply. Conversely, if a trader sees a confirmed supply zone with an all-red box, they may expect sellers to be active in that area and anticipate a potential downward movement in price as supply absorbs available demand.
If a trader sees a green box with no fill (absorbed supply) or a red box with no fill (absorbed demand), it may indicate a potential shift in market bias as the supply/demand has been absorbed, and price may move in the opposite direction. Overall, Auction Finder's color-coding is used to provide a visual representation of the supply and demand areas on a chart and to indicate the potential bias of the market based on the presence or absence of buying or selling pressure.
See complete Auction Finder Product Guide for more info.
Auction Finder is an imbalance-based trading indicator that offers valuable insight into supply and demand "auctions" within financial markets. Knowing what type of auctioning is happening around certain prices can give traders a significant advantage.
The framework of this indicator was designed to detect buyer/seller imbalances. This type of information is particularly important for professional traders who rely on a deep understanding of market dynamics to analyze supply and demand when making strategic trading decisions.
Price action trends are a critical aspect of trading, and analyzing supply and demand can provide valuable insights into these trends on all timeframes. Traders who take the time to understand these factors can improve their decision-making processes and achieve greater success in the markets.
Auction Finder helps traders pinpoint supply and demand imbalances that can lead to significant price movements. This is particularly valuable in volatile markets where quick decision-making and careful risk management are essential.
█ CONCEPTS
Auction Finder's algorithm incorporates several technical analysis tools when analyzing whether a supply/demand level is still acting as a support/resistance level. The main component is price action analysis, which involves analyzing how price behaves around the demand level.
Auction Finder is a technical indicator used in financial markets to identify supply and demand zones or auction areas on a price chart. When the indicator confirms a supply or demand zone, the box representing the zone will be filled with either all-green (for confirmed demand) or all-red (for confirmed supply) color.
However, there are cases where the supply or demand zone is absorbed, meaning that the market has absorbed all the available supply or demand in that zone. In these cases, the box representing the zone may appear green or red, but with no fill. This indicates that the zone was a significant area of interest in the past, but is no longer considered an active supply or demand zone.
Auction Finder's color-coding system can be helpful for traders and investors to identify potential buying or selling opportunities based on historical supply and demand levels. By identifying areas of confirmed or absorbed supply and demand, traders can anticipate potential areas of support or resistance in the future, which can aid in making more informed trading decisions.
For example, if a trader sees a confirmed demand zone with an all-green box fill color, they may expect buyers to be active in that area and anticipate a potential upward movement in price as demand absorbs available supply. Conversely, if a trader sees a confirmed supply zone with an all-red box, they may expect sellers to be active in that area and anticipate a potential downward movement in price as supply absorbs available demand.
If a trader sees a green box with no fill (absorbed supply) or a red box with no fill (absorbed demand), it may indicate a potential shift in market bias as the supply/demand has been absorbed, and price may move in the opposite direction. Overall, Auction Finder's color-coding is used to provide a visual representation of the supply and demand areas on a chart and to indicate the potential bias of the market based on the presence or absence of buying or selling pressure.
See complete Auction Finder Product Guide for more info.
發行說明
minor changes to Settings僅限邀請腳本
僅作者批准的使用者才能訪問此腳本。您需要申請並獲得使用許可,通常需在付款後才能取得。更多詳情,請依照作者以下的指示操作,或直接聯絡invaderinc。
請注意,此私人、僅限受邀使用者使用的腳本未經腳本審核員審核,其是否符合社群規範尚待確定。 TradingView不建議在未完全信任作者並了解其運作方式的情況下購買或使用腳本。您也可以在我們的社群腳本中找到免費的開源替代方案。
作者的說明
Subscribe to Invader Trading Suite at http://www.invaderinc.com for access. Send DM or email support@invaderinc.com for more info.
免責聲明
這些資訊和出版物並非旨在提供,也不構成TradingView提供或認可的任何形式的財務、投資、交易或其他類型的建議或推薦。請閱讀使用條款以了解更多資訊。
僅限邀請腳本
僅作者批准的使用者才能訪問此腳本。您需要申請並獲得使用許可,通常需在付款後才能取得。更多詳情,請依照作者以下的指示操作,或直接聯絡invaderinc。
請注意,此私人、僅限受邀使用者使用的腳本未經腳本審核員審核,其是否符合社群規範尚待確定。 TradingView不建議在未完全信任作者並了解其運作方式的情況下購買或使用腳本。您也可以在我們的社群腳本中找到免費的開源替代方案。
作者的說明
Subscribe to Invader Trading Suite at http://www.invaderinc.com for access. Send DM or email support@invaderinc.com for more info.
免責聲明
這些資訊和出版物並非旨在提供,也不構成TradingView提供或認可的任何形式的財務、投資、交易或其他類型的建議或推薦。請閱讀使用條款以了解更多資訊。