INVITE-ONLY SCRIPT
已更新 Narratives [Pro+]
Narratives [Pro+] - Release
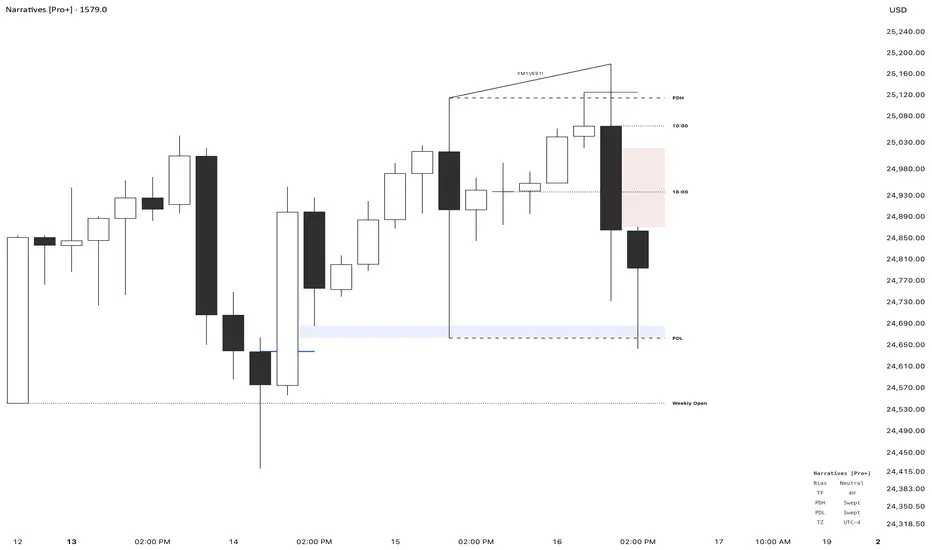
Narratives [Pro+] is a comprehensive trading indicator designed to help traders build a structured narrative around price action. Built on the concepts of Inner Circle Trader, GxT Profiling, and HTF Analysis, It integrates advanced Smart Money concepts such as Fair Value Gaps, SMT Divergence, Liquidity Sweeps, Precision Swing Points, and Session Levels — all within one cohesive and adaptive system. Explore the features below:
Fair Value Gaps (FVG)
- Automatically detects and displays bullish and bearish Fair Value Gaps with dynamic invalidation
- Customizable colors, box limits, and extension behavior until price closes through the gap
- Automatically removes invalidated gaps for a cleaner view
Smart Money Technique (SMT) Divergence
- Detects divergence between correlated assets at Previous Day High/Low levels
- Automatic preset detection for major markets including Indices, Forex, Metals, Energy, and Crypto
- Inversion SMT detection when correlated assets sweep levels while the primary asset does not
- Labels display which specific assets are in divergence
Candle Sweep Detection
- Identifies C2 sweep patterns where Candle 2 sweeps Candle 1’s high or low and closes back
- Detects C3 closure patterns
- Dynamic detection removes sweep lines if subsequent price action invalidates the pattern
- Configurable maximum sweeps and optional bias filtering
Precision Swing Point (PSP)
- Detects swing highs and lows that occur with correlated asset divergence
- Two display modes:
- PSP Only – shows confirmed swing points with divergence
- All Precision Candles – highlights every divergence candle
- Supports up to three correlated assets with both manual and automatic preset modes
Previous Day High/Low (PDH/PDL)
- Plots previous day’s high and low across all intraday timeframes
- Dynamic mitigation stops line extension when levels are swept
- Customizable line styles for active and mitigated states
- Status tracking shows Intact or Swept in the information table
Previous Week High/Low (PWH/PWL)
- Plots previous week’s high and low with automatic detection across all intraday timeframes
- Dynamic mitigation stops line extension when levels are swept
- Customizable line styles for active and mitigated states
- Status tracking shows Intact or Swept in the information table
Premium / Discount Zones
- Automatically calculates and displays Premium and Discount ranges based on current structure
- Helps visualize optimal trade zones within equilibrium
- Optional midpoint (Equilibrium) line
- Fully customizable colors and fill styles
Killzone Levels
- Tracks Asia and London session highs and lows with automatic timezone conversion
- Levels extend until mitigated with optional line removal
- Session-based detection resets daily
Timeline Markers
- Four customizable vertical lines mark key trading times
- Default setup includes major market opens in New York timezone
- Optional display on lower timeframes
Quarterly Theory
- Plots vertical lines marking quarterly cycles across multiple timeframes
- 15M charts: 90m quarters
- 30M charts: Daily quarters (6-hour cycles from 6PM)
- 1H charts: Weekly quarters
- 4H charts: Monthly quarters
- Daily charts: Yearly quarters
Information Table
- Displays current bias, timeframe, PDH/PDL status, and timezone
- Customizable position, colors, font size, and individual element toggles
- Includes Ticker and Timeframe for quick reference
發行說明
- Minor default settings changes發行說明
- Fixed 1H and 4H visibility logic so levels now display correctly on 2H, 3H, 6H, and higher timeframes.發行說明
- Added timeframe alignment option to FVG僅限邀請腳本
僅作者批准的使用者才能訪問此腳本。您需要申請並獲得使用許可,通常需在付款後才能取得。更多詳情,請依照作者以下的指示操作,或直接聯絡chaesmt。
TradingView不建議在未完全信任作者並了解其運作方式的情況下購買或使用腳本。您也可以在我們的社群腳本中找到免費的開源替代方案。
作者的說明
Contact @chaesmt on Discord for instructions or purchase a subscription through Whop - https://whop.com/chaesmt
免責聲明
這些資訊和出版物並非旨在提供,也不構成TradingView提供或認可的任何形式的財務、投資、交易或其他類型的建議或推薦。請閱讀使用條款以了解更多資訊。
僅限邀請腳本
僅作者批准的使用者才能訪問此腳本。您需要申請並獲得使用許可,通常需在付款後才能取得。更多詳情,請依照作者以下的指示操作,或直接聯絡chaesmt。
TradingView不建議在未完全信任作者並了解其運作方式的情況下購買或使用腳本。您也可以在我們的社群腳本中找到免費的開源替代方案。
作者的說明
Contact @chaesmt on Discord for instructions or purchase a subscription through Whop - https://whop.com/chaesmt
免責聲明
這些資訊和出版物並非旨在提供,也不構成TradingView提供或認可的任何形式的財務、投資、交易或其他類型的建議或推薦。請閱讀使用條款以了解更多資訊。