PROTECTED SOURCE SCRIPT
已更新 SMA Oscillation Strength Index
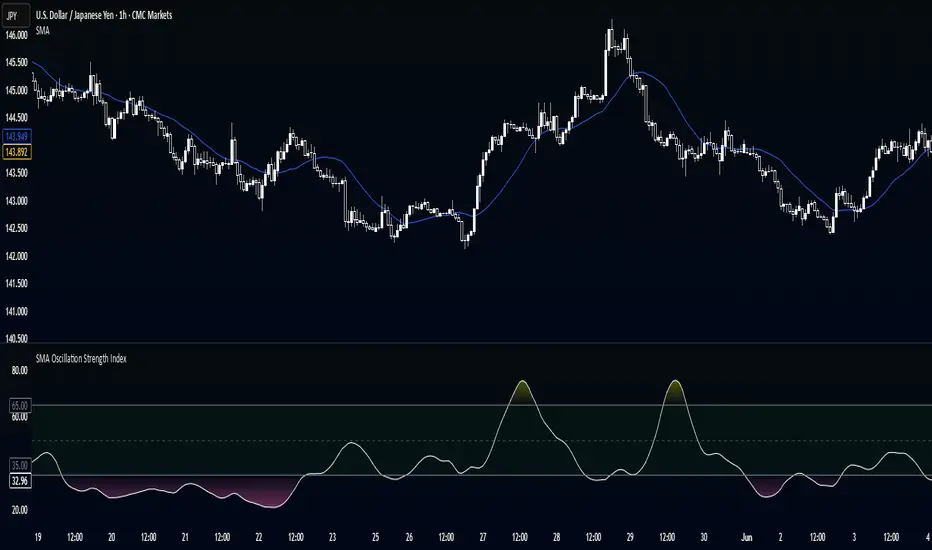
This indicator quantifies how strongly price oscillates around a simple moving average (SMA), normalized to a 0–100 scale for easier interpretation.
It calculates the standard deviation of the distance between price and its SMA over a lookback period, then normalizes that value by dividing it by the current ATR to account for volatility. This produces a raw "oscillation strength" signal.
The signal is then smoothed using an EMA and rescaled from its expected range (0–3) to a normalized 0–100 scale. The final output increases when price oscillates clearly above and below the SMA (e.g., in ranging conditions), and stays low when price hugs the SMA tightly (e.g., in low-volatility or noisy conditions).
Customizable upper and lower thresholds allow the user to mark different strength regimes, such as "ranging" vs "flat".
發行說明
Updated Chart受保護腳本
此腳本以閉源形式發佈。 不過,您可以自由且不受任何限制地使用它 — 在此處了解更多資訊。
免責聲明
這些資訊和出版物並不意味著也不構成TradingView提供或認可的金融、投資、交易或其他類型的意見或建議。請在使用條款閱讀更多資訊。
受保護腳本
此腳本以閉源形式發佈。 不過,您可以自由且不受任何限制地使用它 — 在此處了解更多資訊。
免責聲明
這些資訊和出版物並不意味著也不構成TradingView提供或認可的金融、投資、交易或其他類型的意見或建議。請在使用條款閱讀更多資訊。