OPEN-SOURCE SCRIPT
30min_break
English:
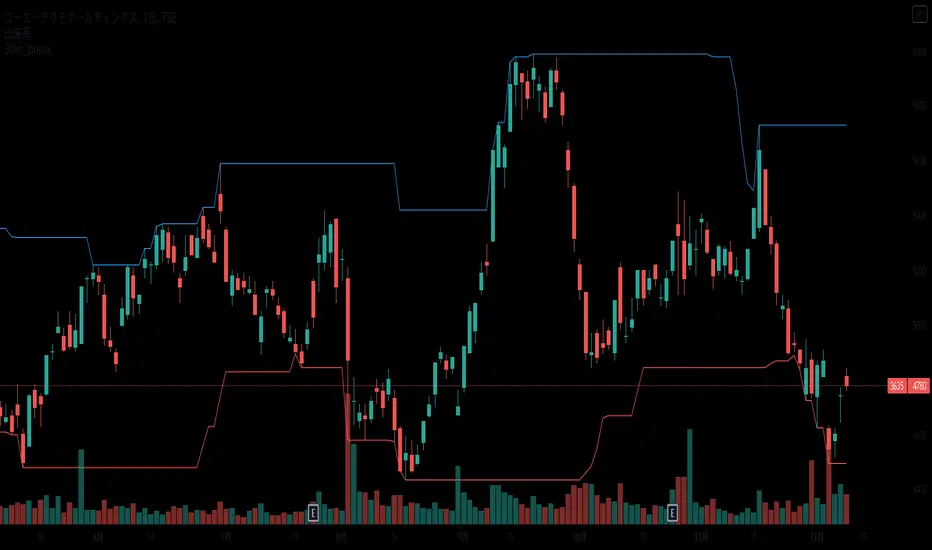
It is an indicator that displays the high and low prices as of 30 minutes before the event,
and when you break it, you can see it with a balloon.
The high and low lines at 30 minutes before the front are shown as candidates for support lines and resistance lines.
Used in the minute chart
Japanese:
前場 30分時点の 高値・安値の線を表示し、そこをBreakしたら吹き出しでわかるようにしたインジケーターです
前場 30分時点の 高値安値の線を支持線・抵抗線の候補として図示します。
分足のチャートで利用します
開源腳本
秉持TradingView一貫精神,這個腳本的創作者將其設為開源,以便交易者檢視並驗證其功能。向作者致敬!您可以免費使用此腳本,但請注意,重新發佈代碼需遵守我們的社群規範。
免責聲明
這些資訊和出版物並非旨在提供,也不構成TradingView提供或認可的任何形式的財務、投資、交易或其他類型的建議或推薦。請閱讀使用條款以了解更多資訊。
免責聲明
這些資訊和出版物並非旨在提供,也不構成TradingView提供或認可的任何形式的財務、投資、交易或其他類型的建議或推薦。請閱讀使用條款以了解更多資訊。