INVITE-ONLY SCRIPT
已更新 BANK NIFTY ALGO
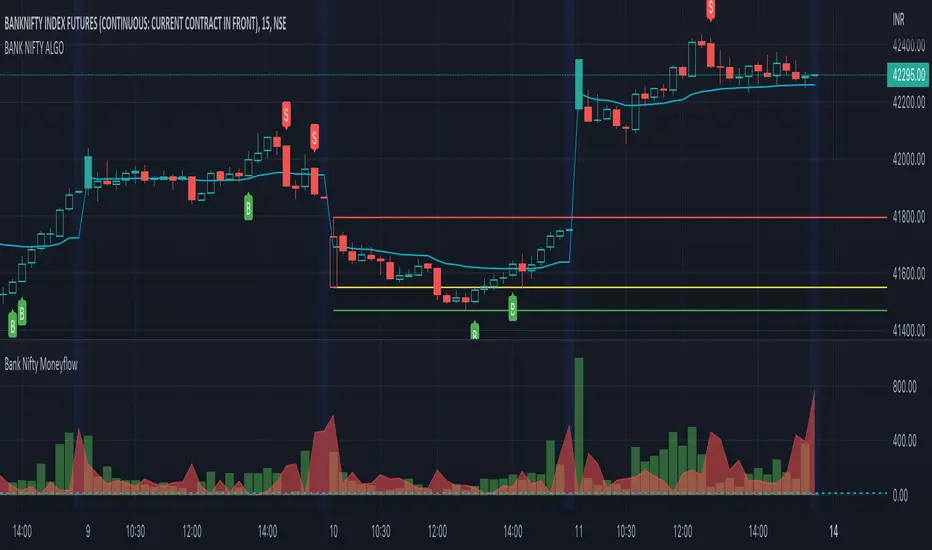
This indicator is specifically designed for trading Bank Nifty (NSE) for intraday trading & short term swing trading
Description :
This indicator is based on Price Action Theory, Volume Profiles and Moneyflow Analytics. It also incorporates important parameters of the underlying assets such as Banking stocks & key benchmark banking metrics. It shows the bias of the index at any given point of time.
USP: It reacts to change in price momentum if that is sustainable; thereby eliminating random spikes & offshoots in price. This is much more conservative way of trading & gives signal only when the trend is strongly stabilized.
How to use ?
Timeframe : Time duration for each bar (Input to given to the indicator by user)
Notations used in the indicator:
B- Signal for Buy
S- Signal for Sell
CS- Close Shorts
CL- Close Longs
BookLong- Book all Longs
BookShort- Book all Shorts
Critical Pivot is a point which is defined as the boundary of bullish & bearish sides. This is the thick line which changes color green to maroon to grey. It gives an idea of bias in the market. Green color is for Bullish bias, Maroon for Bearish bias & Grey for Neutral
Swing High: The dynamic green line at the end of the charts
Swing Low : The dynamic red line at the end of the charts
Major uses of the Indicator:
1. Understanding the direction of Bank Nifty and understands levels for entry / exits --- B & S signals
2. Understanding SL levels in order to prevent loss during unforeseen events ------------- Break of the critical pivot ( green/maroon line )
3. Understanding Trailing SL levels to hold on to the winners --------------------------------- Break of the Green/Red Line
Ideal Timeframes for this Indicator :
1.Intraday ( 5 min/15 mins )
2.Swing ( 30 mins/1 hour)
Disclaimer: This script/strategy is for educational purpose and individual use only. The author of this script/strategy will not accept any liability for loss or damage as a result of reliance on the information contained in the charts. Please be fully informed regarding the risks associated with trading the financial markets.
This is a premium indicator
If you want access to this indicator, please message us (Links/Email in description below )
發行說明
Updated with changes in bnf constituents 發行說明
Weights updated 發行說明
Weights updated 發行說明
..發行說明
Updated weights 僅限邀請腳本
只有經作者批准的使用者才能訪問此腳本。您需要申請並獲得使用權限。該權限通常在付款後授予。如欲了解更多詳情,請依照以下作者的說明操作,或直接聯絡aditya_biswas。
除非您完全信任其作者並了解腳本的工作原理,否則TradingView不建議您付費或使用腳本。您也可以在我們的社群腳本中找到免費的開源替代方案。
作者的說明
Please send over a personal message in trading view or whatsapp for access
Coordinates :
Detailed demo/Live replay : youtube.com/channel/UC79RlSqRn85th7zgpZpz3Iw
email : quantumtradingsystem@gmail.com
Detailed demo/Live replay : youtube.com/channel/UC79RlSqRn85th7zgpZpz3Iw
email : quantumtradingsystem@gmail.com
免責聲明
這些資訊和出版物並不意味著也不構成TradingView提供或認可的金融、投資、交易或其他類型的意見或建議。請在使用條款閱讀更多資訊。
僅限邀請腳本
只有經作者批准的使用者才能訪問此腳本。您需要申請並獲得使用權限。該權限通常在付款後授予。如欲了解更多詳情,請依照以下作者的說明操作,或直接聯絡aditya_biswas。
除非您完全信任其作者並了解腳本的工作原理,否則TradingView不建議您付費或使用腳本。您也可以在我們的社群腳本中找到免費的開源替代方案。
作者的說明
Please send over a personal message in trading view or whatsapp for access
Coordinates :
Detailed demo/Live replay : youtube.com/channel/UC79RlSqRn85th7zgpZpz3Iw
email : quantumtradingsystem@gmail.com
Detailed demo/Live replay : youtube.com/channel/UC79RlSqRn85th7zgpZpz3Iw
email : quantumtradingsystem@gmail.com
免責聲明
這些資訊和出版物並不意味著也不構成TradingView提供或認可的金融、投資、交易或其他類型的意見或建議。請在使用條款閱讀更多資訊。