OPEN-SOURCE SCRIPT
Frank-Setup EMA, RS & RSI ✅
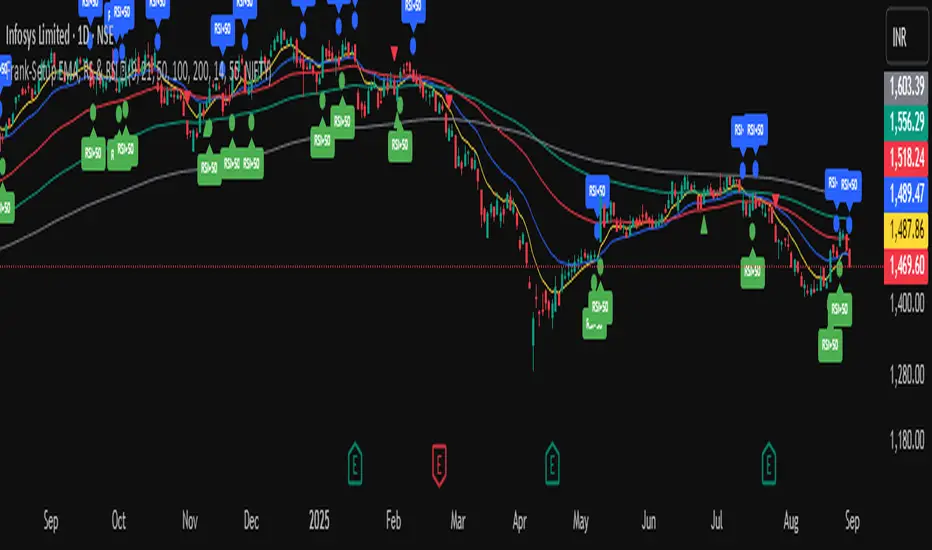
It is a clean and simple indicator designed to identify weakness in stocks using two proven methods: RSI and Relative Strength (RS) vs. a benchmark (e.g., NIFTY).
🔹 Features
RSI Weakness Signals
Plots when RSI crosses below 50 (weakness begins).
Plots when RSI moves back above 50 (weakness ends).
Relative Strength (RS) vs Benchmark
Compares stock performance to a chosen benchmark.
Signals when RS drops below 1 (stock underperforming).
Signals when RS recovers above 1 (strength resumes).
Clear Visual Markers
Circles for RSI signals.
Triangles for RS signals.
Optional RSI labels for clarity.
Built-in Alerts
Get notified instantly when RSI or RS weakness starts or ends.
No need to constantly watch charts.
🎯 Use Case
This tool is built for traders who want to:
Spot shorting opportunities when a stock shows weakness.
Track underperformance vs. the index.
Manage risk by exiting longs when weakness appears.
開源腳本
In true TradingView spirit, the creator of this script has made it open-source, so that traders can review and verify its functionality. Kudos to the author! While you can use it for free, remember that republishing the code is subject to our House Rules.
免責聲明
The information and publications are not meant to be, and do not constitute, financial, investment, trading, or other types of advice or recommendations supplied or endorsed by TradingView. Read more in the Terms of Use.