OPEN-SOURCE SCRIPT
Bar Replay

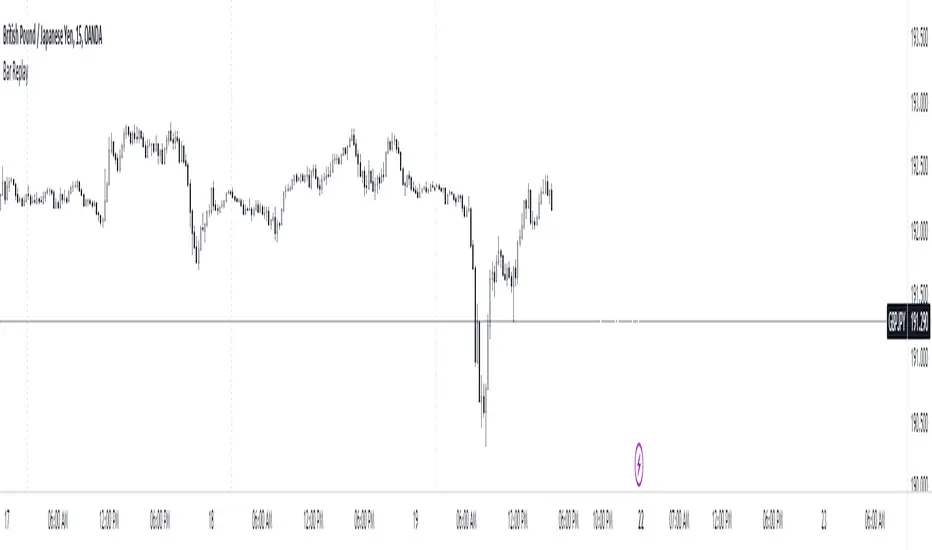
This indicator mirrors TradingView's bar replay feature to a certain extent, offering traders a streamlined way to analyze past market movements. It's a practical tool for strategy testing, pattern recognition, and refining trading approaches.
While it may have some limitations, it offers a practical solution for strategy testing and refining trading approaches for free and gets the job done. After all, having a tool is better than having none.
This is just an experiment so don't take it that seriously. I hope you guys find it useful.
If you have some ideas for improvement or found any bugs, kindly let me know.
How to use it?
Step 1 : Add the indicator to the chart.

Step 2 : Select the candle .
Step 3 : Make the changes visible.

Step 4 : How to Navigate

Step 5 : Change the date easily

The blank screen issue.

Note : There are some limitations
While it may have some limitations, it offers a practical solution for strategy testing and refining trading approaches for free and gets the job done. After all, having a tool is better than having none.
This is just an experiment so don't take it that seriously. I hope you guys find it useful.
If you have some ideas for improvement or found any bugs, kindly let me know.
How to use it?
Step 1 : Add the indicator to the chart.
Step 2 : Select the candle .
Step 3 : Make the changes visible.
Step 4 : How to Navigate
Step 5 : Change the date easily
The blank screen issue.
Note : There are some limitations
- The data is limited to the free plan.
- It's not smooth as the real Bar replay feature.
- I haven't checked the bugs so let me know if you found any.
開源腳本
秉持TradingView一貫精神,這個腳本的創作者將其設為開源,以便交易者檢視並驗證其功能。向作者致敬!您可以免費使用此腳本,但請注意,重新發佈代碼需遵守我們的社群規範。
免責聲明
這些資訊和出版物並非旨在提供,也不構成TradingView提供或認可的任何形式的財務、投資、交易或其他類型的建議或推薦。請閱讀使用條款以了解更多資訊。
開源腳本
秉持TradingView一貫精神,這個腳本的創作者將其設為開源,以便交易者檢視並驗證其功能。向作者致敬!您可以免費使用此腳本,但請注意,重新發佈代碼需遵守我們的社群規範。
免責聲明
這些資訊和出版物並非旨在提供,也不構成TradingView提供或認可的任何形式的財務、投資、交易或其他類型的建議或推薦。請閱讀使用條款以了解更多資訊。