Volume Plus (Volume+)View Total Volume, Bull Volume, and/or Bear Volume. View Volume Effectiveness to reveal how Volume has effected the price. View the Moving Average of any of the above metrics, selecting one or more types of moving averages(SMA, EMA, RMA, SWMA, VWMA, WMA, or ALMA). Create nearly infinite crossovers by activating the Secondary Moving Average and choosing a longer or shorter Length. Use the highlighter to quickly filter out noise and focus the events you're searching for, by choosing one or more highlight-scenarios from the Highlighting Menu. Use the Average Amplifier to fine tune your Highlighting results.
Use as an ordinary Volume Indicator
Show the Bullish volume within Total Volume
Show the Bearish volume within Total Volume
Show the Bullish and Bearish volume simultaneously within Total Volume
Create crossovers like this one, Bullish Volume Average with Bearish Volume Average
Show the gas mileage of volume, the Volume Effectiveness
Create crossovers like this, Volume Effectiveness 14 with Volume Effectiveness 60
Use Amplifiers to show things that are usually out of scale with one another, like Volume Effectiveness with Volume
Use the Highlighter to show anything, like here, when Bearish Volume was above average AND Volume Effectiveness was under average
From left to right, the Indicator Values are as follows:
1) Total True Volume (red, green, or gray when viewed alongside Bulls/Bears)
2) Volume Winner - Bulls v/s Bears (red or green)
3) Volume Loser - Bulls v/s Bears (red or green)
4) Volume Effectiveness (blue)
5) Design Spacer - Ignore This (green)
6) Design Spacer - Ignore This (red)
7) Total True Volume Primary Moving Average (dark gray)
8) Total True Volume Secondary Moving Average (dark gray)
9) Inferred Bullish Volume Primary Moving Average (dark green)
10) Inferred Bullish Volume Secondary Moving Average (dark green)
11) Inferred Bearish Volume Primary Moving Average (dark red)
12) Inferred Bearish Volume Secondary Moving Average (dark red)
13) Volume Effectiveness Primary Moving Average (blue)
14) Volume Effectiveness Secondary Moving Average (blue)
Click the sprocket and you'll find the following settings (which are explained below):
Total True Volume - This is your everyday, ordinary volume indicator, a total sum of the volume from each candle.
Inferred Bullish Volume - This subtracts Bearish Volume out of the Total True Volume. But without the bull-volume data from the exchange, we can only forensically infer the bullish volume by evaluating OHLC data to guess what ratio of upward v/s downward movement happened within the candle.
Inferred Bearish Volume - This subtracts Bullish Volume out of the Total True Volume. But without the bear-volume data from the exchange, we can only forensically infer the bearish volume by evaluating OHLC data to guess what ratio of downward v/s upward movement happened within the candle.
Volume Effectiveness - This shows how much price movement occurred for each unit of Volume, by dividing the Price Change of each candle by the Total True Volume of each candle. If this volume were gas-mileage, then Volume would be the gas and Price would be the mileage.
• Inferred Effectiveness - Rather than using the Price Change divided by the Total True Volume, this method of determining Volume Effectiveness uses the Total Price-Mileage divided by the Total True Volume. The Total Price-Mileage is determined by figuring the high minus low, the wick times two, and the tail times two, and ad
[i]price

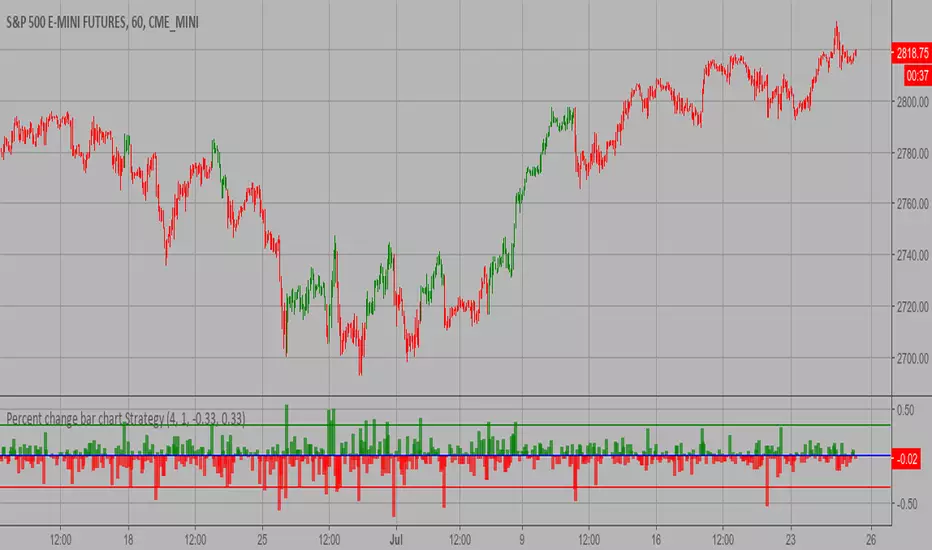
Percent change bar chart Strategy This histogram displays price or % change from previous bar.
WARNING:
- This script to change bars colors.
Modified Price-Volume Trend Strategy The related article is copyrighted material from
Stocks & Commodities.
Strategy by HPotter.
WARNING:
- This script to change bars colors.

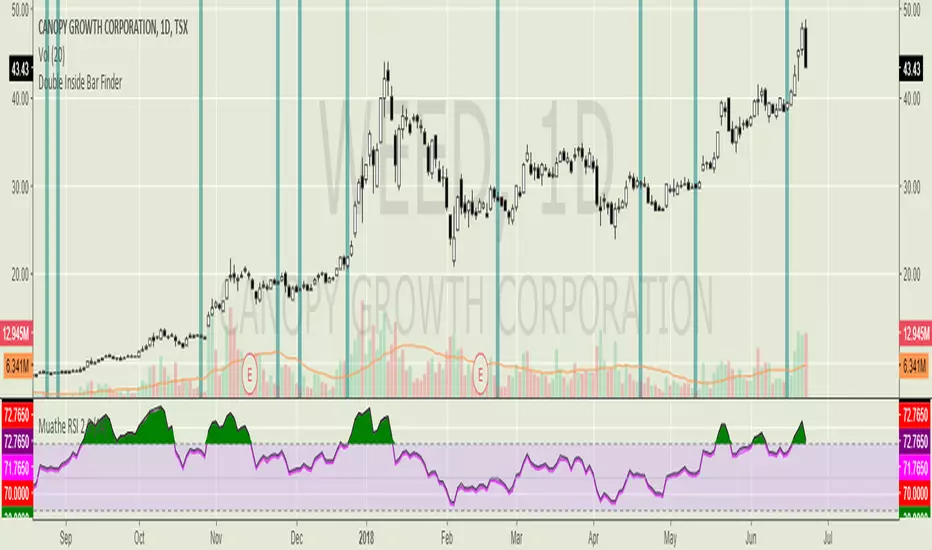
Double Inside Bar FinderHighlights in blue when an inside bar follows an inside bar. Double inside bars (when used on the daily timeframe) are a way of easily finding equilibrium patterns (i.e. pennant shaped price action) on lower time frames. There is usually a strong move in whatever direction these patterns break, so good to have alerts set up for your favourite markets.

PA Patterns Multi CRYPTOThis is the version for cryptocurrencies of my scanner for forex majors
The scope of this script is to work as a scanner of pin bars and engulfing candles of the crypto market.
Best to use with time frames Daily and 4h, lower timeframes gives too many results and may be noisy without trend filter.
Next improvement will be:
- To display in a better way the results, but actually you have to zoom in and out if some results are overlapping.
As the other one, this has alerts and trend filter.
If you like it, please leave a comment and follow me.
Thank you.

PA Patterns Multi tickerThe scope of this script is to work as a forex scanner of pin bars and engulfing candles of the majors.
Best to use with time frames Daily and 4h, lower timeframes gives too many results and may be noisy.
Next improvement will be:
- To display in a better way the results, but actually you have to zoom in and out if some results are overlapping.
- To add allarms (this is easy).
If you are interested in it, I could implement also for cryptos.
Please let me have your feedbacks!
Mayer Multiple(Buffet's Secret)It's just the 200 day moving average / divided by the price. Shows you where Buffet would buy and sell at.

Explosive PotentialThis script looks at times where MACD is within a specified range (very close to 0 values) and price action is very constrained (under 2%). Historically price has made a strong move after these conditions.
I typically run this on an 8H timeframe.
Review on BTCUSD and other cryptos.

LCS/HCR Support and Resistance multi timeframesThis study draws LCS and HCR lines for multi time frames and helps to find important support and resistance levels on lower timeframes.
Levels are based on close price and not low and high.

BTC World Price: Multi-Exchange VWAPBTC World Price: Multi-Exchange VWAP
__________________________
WHAT IT DOES
What you see above are not Bitmex candles, but this indicator's.
Bitcoin is listed on multiple exchanges. Many people have called for a single global index that would quote BTC price and volume across all exchanges: this script is such a virtual aggregate (formerly: Multi-Listed , Volume-Weighted Average Price ).
It will, independently for each tick, for any time-frame:
- Quote the price (O, H, L, C) and volume from Bitfinex (USD), Binance (USDT), bitFlyer (Yen), Bithumb (S. Korean Won), Coinbase (USD), Kraken (EUR) and even Bitmex (USD Contracts).
- Weight each price with the corresponding volume of the exchange.
- Quote the FOREX conversion rate in USD for each currency (USDJPY etc.)
- Finally return global average price (candles) in USD.
- Additionally provide (H+L)/2 etc. values.
No more "on Coinbase this" or "on Bitstamp that", you've now got a global overview!
See CoinMarketCap: Markets for reference. I've included alternative exchanges in the comments at the top of the script.
__________________________
HOW TO USE IT
Basically just add it to your chart and use the indicator's candles instead of the chart's main ticker.
By default, BTC World Price will display candles only, but you can also display OHLC & averages (in whichever style you want).
You may indeed want to hide the main symbol (top-left corner, click the 'eye' button next to its name), or switch it to something else than candles/bars (e.g. line).
Make sure "Scale Price Chart Only" is disabled if you want to use the auto-zoom feature. (if other indicators are messing your zoom, you can try to select "Line with Breaks" or "Area with Breaks" to allow these to overflow from the main window)
By clicking the triangle next to the indicator's name, you can select "Visual Order" (e.g "Bring to Front").
You can select regular Candles or Heikin-Ashi in Options.
In the Format > Inputs tab, you can select which exchanges to quote. By default, all of them are enabled.
The script also exposes the following typical values to the backend, which you can use as Price Source for other indicators: (e.g. MA, RSI, in their "Format > Input" tab)
Open Price (grey)
High Price (green)
Low Price (red)
Close Price (white)
(H + L)/2 (light blue)
(H + L + C)/3 (blue)
(O + H + L + C)/4 (purple)
They are all hidden by default (by means of maximum transparency).
In the Format > Style tab, you can change their color, transparency and style (line, area, etc), as well as uncheck Candles and Wicks to hide these.
If you are using "Indicator Last Value" and want to clear the clutter from all these values, simply uncheck them in Style. They will still be available as Price Source for other indicators.
You can also choose to scale it to the left, right (default) or "screen" (no scaling).
Once you're satisfied with your Style, you may click "Default"> "Save as default" in the botton-left. Everytime you load the indicator, it will look the same. ("Reset Settings" will reset to the script's defaults)
__________________________
Please leave feedback below in comments or pm me directly for bugs and suggestions.

UncleBoUncleBo looks for the institutional finger prints, the whales or the big boys.
Looks for price, volume , momentum analysis tools and COMBINES the most famous indicators.
Works for any kind of market.
Only thing you have to do is forget about any indicator you used before and look at lines. This helps you overcome your emotions.
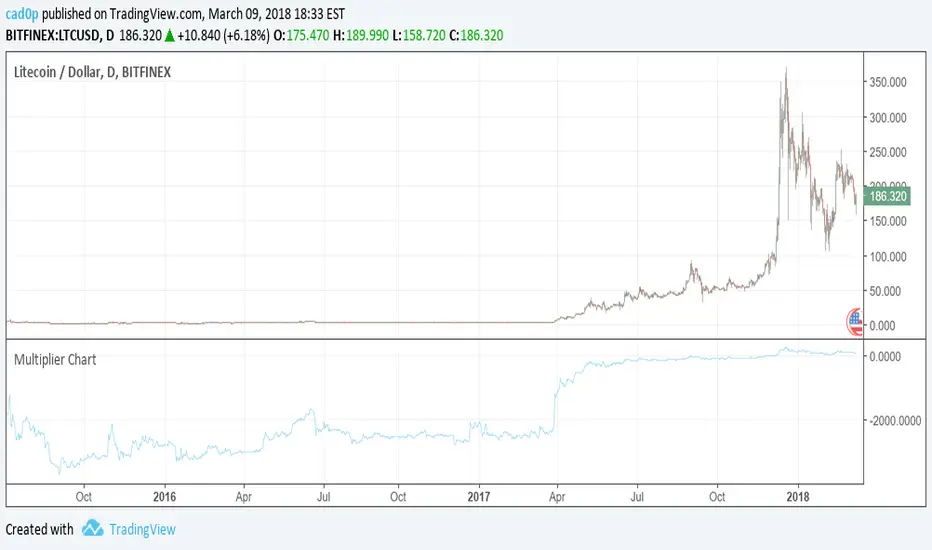
Multiplier ChartI am proposing an alternative to the percent change.
An alternative that is symmetrical to both positive and negative change, unlike percentage change.
The simple idea is to have a positive number if the reference value (called val in the script) is lower than the stock value and needs to be multiplied;
a negative number instead if the reference number is higher than the stock value, so the reference value needs to be divided.
Multiplying all by 100 to give clearer and more readable results, the Multiplier would have a huge gap between +100 and -100, because a stock multiplied by 1 or divided by 1 are the same thing.
So we need to compromise and move all positive numbers down by 100 and all negative numbers up by 100. This actually gives a similar result to percentage change, and it is actually identical in the positive range.
The fundamental difference lies on the negative range, which is completely symmetrical. So if a stock goes up 100 points one day (doubles), and the next it goes down another 100 points (halves), at the end of the second day the stock has the same value as it had at the beginning of the first day! On percentage change it would be +100% the first day and -50% the second.
We mustn't undervalue the human tendency to compare a 1% change to a -1% change, but they do not mean the same even if they seem to indicate so.
A clear example of this can be found on CMC 0.60% -3.56% -3.56% (CoinMarketCap), in which each day are shown the best and worst performing coins of the day. So you might see a +900% there in the top performing, but you'll never see a -900%, because percentage change cannot go further than -100%. It is a fundamentally asymmetric scale that can confuse people a lot especially in those fast moving new markets.ù
I am welcome to feedback and all kinds of opinions and critics.
Some interesting things to note: you can use it as a percentage change indicator or as a different perspective to a stock chart. In fact, it lets you see how big of a difference it made buying coins when they were very cheap, because when they are cheap a difference of what it might seem nothing is amplified by all the gains that the stock/coin made after. So, looking at coins charts using this indicator shows how "not flat" were the early days, which in a normal chart are flattened to 0.
Support and ResistanceThis script uses pivot point calculations to determine support and resistance areas.

First_4_fibo_IntradayMagic of first four 15 min candle H/L with FIBO !!
For Gainers :
Stocks Trading above 38.2 % are expected to touch Day's High.
Stocks Trading above 23.6 % are expected to make a new intraday High. (Tgt1 = 138.2%, Tgt2 = 161.8%).


dynFibo for Intraday - fpsintAutomatically adjusts fibo based on day H and L.
H
37.8 %
50.0 %
61.8 %
L
try out, any issues feel free to ping ! Happy Learning !
- fpsint

BTC Price Spread - Coinbase & Futs - Premiums & DiscountsThis indicator takes the price of Bitcoin on Coinbase and the futures price on Mex, and compares it the average price of Bitcoin across other major exchanges.
This essentials give us a spread at which Bitcoin is going for.
In turn, this could be a possible tool to help determine market sentiment.
This indicator was created for experimental purposes.
Use at your own digression.

MPT - MEDIAN PRICE TRADING - custom forex indicator
MPT is a unique custom indicator i created to enter a trade with the right timing
This indicator catches the momentum of a Forex pair and tells you when to enter
It's based on the idea that when the median price in the current timeframe is crossing the median price of the higher timeframe, the momentum is changing and that is an opportunity to trade
red line is median line of current timeframe (default is 1D)
aqua line is projection of past median line on higher timeframe (default is 1W)
white crosses can be used as a trail stop values to follow a trend
when red cross aqua up the background is green and so momentum of the pair is up
when red cross aqua down no background color and momentum down
You can try this indicator for a limited period, just ask for access in comments
If you want unlimited access you can PM me
Trading is a risky business, use it at your own risk. I'm not responsible for any profit or loss


52 Week High/Low52 Week High / Low Indicator
A simple, unobtrusive indicator that can be used on any timeframe to display the 52 week high/low values.
Features
Works on any timeframe.
Unobtrusive: Simple horizontal lines showing only the current 52 week values.
Allows the user to select whether to calculate the 52-week values from candle close values or the respective highs/lows.
For full overview and code commentary - Visit the backtest-rookies website.

CB SDB HK VOL IndicatorIndicator version of designed for use with independent automation solution.
Custom development published for customer verification and acceptance.
If you are interested in development services, please visit the backtest-rookies website or message me to find out more.
