COVID19 New Cases & Threshold per 100k inhabitantsGoal is to be able to keep track of new COVID cases and see when the relative threshold is passed.
The default threshold is set to 10 new cases per 100.000 inhabitants per 14-days, please change the available inputs to change this metric
Out of curiosity I've added the population density. Because people generally live and socially interact on land I've used the land-area for population density calculation.
When comparing metrics between countries there are many more factors to be considered.
Create your own symbol list for the CONFIRMED tickers:
Create a new list
Paste the following text where you would add a symbol:
COVID19:CONFIRMED_AT,COVID19:CONFIRMED_BE,COVID19:CONFIRMED_DK,COVID19:CONFIRMED_FI,COVID19:CONFIRMED_FR,COVID19:CONFIRMED_DE,COVID19:CONFIRMED_IS,COVID19:CONFIRMED_IE,COVID19:CONFIRMED_IT,COVID19:CONFIRMED_LV,COVID19:CONFIRMED_LI,COVID19:CONFIRMED_LT,COVID19:CONFIRMED_LU,COVID19:CONFIRMED_MT,COVID19:CONFIRMED_MD,COVID19:CONFIRMED_MC,COVID19:CONFIRMED_NO,COVID19:CONFIRMED_PL,COVID19:CONFIRMED_PT,COVID19:CONFIRMED_RO,COVID19:CONFIRMED_RU,COVID19:CONFIRMED_SK,COVID19:CONFIRMED_SI,COVID19:CONFIRMED_ES,COVID19:CONFIRMED_SE,COVID19:CONFIRMED_CH,COVID19:CONFIRMED_TR,COVID19:CONFIRMED_UA,COVID19:CONFIRMED_AE,COVID19:CONFIRMED_AR,COVID19:CONFIRMED_AU,COVID19:CONFIRMED_BR,COVID19:CONFIRMED_CA,COVID19:CONFIRMED_CL,COVID19:CONFIRMED_CN,COVID19:CONFIRMED_CO,COVID19:CONFIRMED_HR,COVID19:CONFIRMED_ID,COVID19:CONFIRMED_IL,COVID19:CONFIRMED_IN,COVID19:CONFIRMED_IR,COVID19:CONFIRMED_JP,COVID19:CONFIRMED_KR,COVID19:CONFIRMED_KW,COVID19:CONFIRMED_MX,COVID19:CONFIRMED_MY,COVID19:CONFIRMED_NZ,COVID19:CONFIRMED_PE,COVID19:CONFIRMED_PH,COVID19:CONFIRMED_SG,COVID19:CONFIRMED_TH,COVID19:CONFIRMED_US,COVID19:CONFIRMED_US_AZ,COVID19:CONFIRMED_US_CA,COVID19:CONFIRMED_US_FL,COVID19:CONFIRMED_US_IL,COVID19:CONFIRMED_US_MA,COVID19:CONFIRMED_US_NC,COVID19:CONFIRMED_US_NJ,COVID19:CONFIRMED_US_NY,COVID19:CONFIRMED_US_TX,COVID19:CONFIRMED_UZ,COVID19:CONFIRMED_VE,COVID19:CONFIRMED_ZA
2019

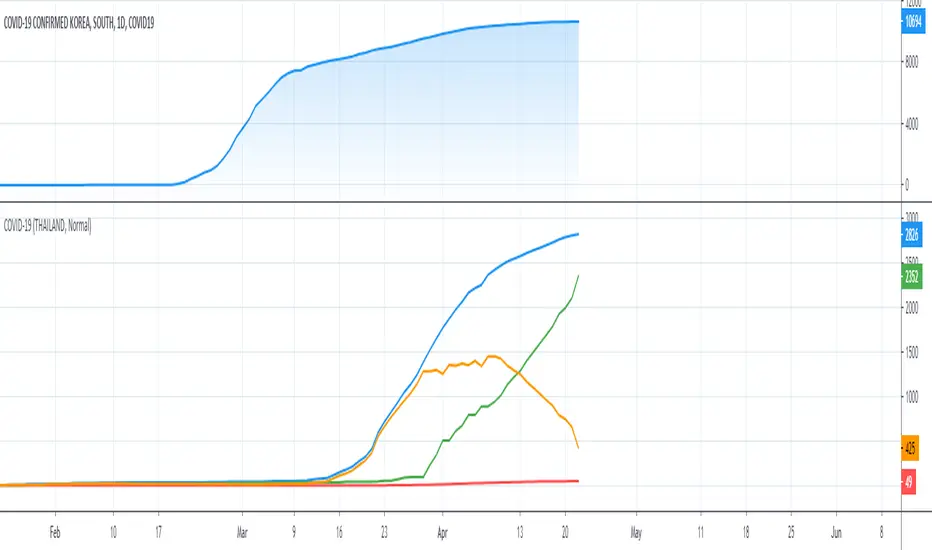
COVID-19 Status by CountryThis script summarizes the daily COVID-19 confirmed and deaths cases by country. You can select the country of interest and the SMA period in inputs.
For how we think COVID-19 will impact the market in the near future, see the idea below:
All thoughts and critics are welcomed!

Major Event Price Indicators (Coronavirus Lows)This very simple script adds a corridor for two low price ranges, where Corona started to hit. Useful to visualize where a stock currently trades at, relative to the Corona / Covid-19 crisis.
Can easily be adjusted for different dates regarding any major events, crashes. Useful when you run out of Alarms and just want to see "is that still below or above where it was before ?".
Add as many dates as you want, just alter the names of each indicator.
Built upon the script of vitvlkv.

COVID-19 Case ComparisonDuring this global pandemic, there is limited information available on the COVID-19 disease itself. However one thing we do have is data; and we get more of this every day.
Use this indicator to track the live number of new cases each day, along with the current mortality, recovery, and transmission rates.
Easily switch data output between multiple countries.
If you don't see your country available, please comment below and I will gladly add it.

COVID-19: Daily change per capita (EU only)New confirmed cases per day (daily change) is one thing, just an absolute value but when we put this number in context of population (per million people) of each country the situation is a bit different.
We can easily see that, at the moment (Apr 2nd, 2020), the most affected country is Spain (~150 new cases per million people per day) and surprisingly the second one is Switzerland (CH). We can also see Spain or Belgium's steep curve relative to other countries.
I know that some countries run more tests than the others and the outcome might not be reflect the reality but this is the official data that is available.


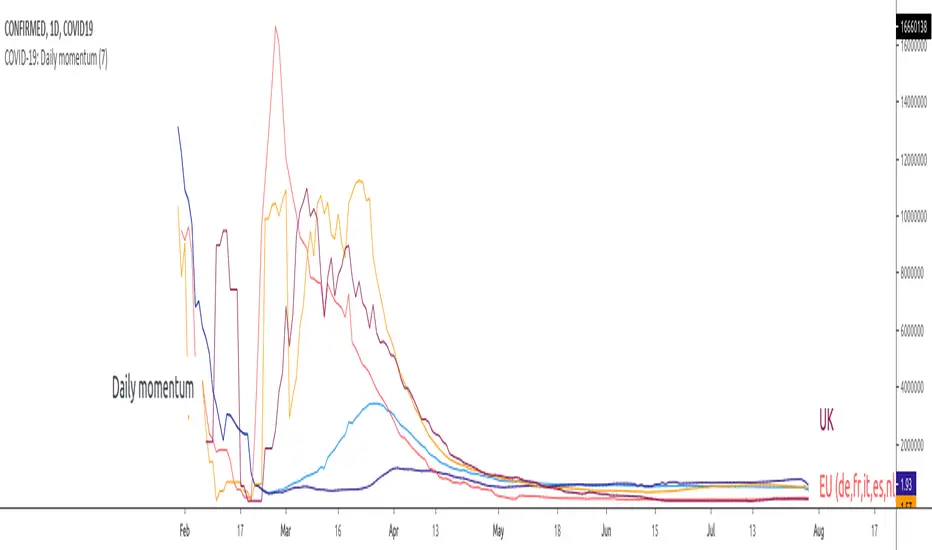
COVID-19: Daily momentumThis indicator shows 14-days moving average of daily rate of change (momentum, acceleration), in other words:
- up trends means that virus accelerates at the rate displayed on the right scale
- consolidation/horizontal movement - virus spreads at constant rate
- down trend - virus looses momentum IMPORTANT: the virus STILL accelerates but at a lower rate
By default the graphic displays World vs. EU vs. US vs. Asia while individual countries are available in Settings.
- EU includes the following countries (DE, FR, IT, ES, CH), all with more than 10k confirmed cases and more than 1k new daily infections.
- Asia includes CH and KR
To use the indicator it is important to disconnect main chart from the right scale, on main chart click on More (the 3 dots) -> Pin to scale -> Select "No Scale".
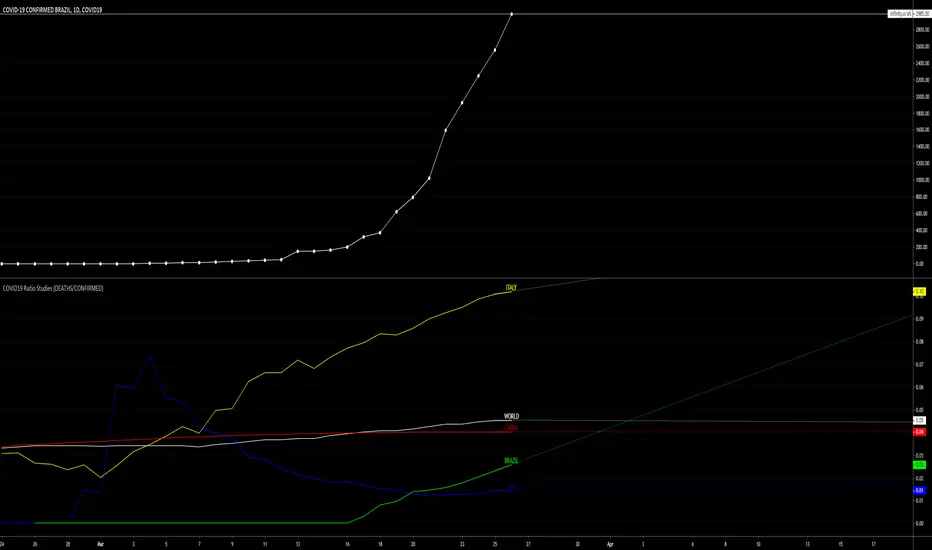
COVID19 Ratio StudiesA made this study to help understand how COVID19 is spreading in my country (Brazil).
Feel free to change the script, but if you can't do by yourself, ask me and I will help you.
In anyway, lets be safe!
COVID-19: Daily changeNew daily infections (daily change) of COVID-19.
The chart shows new daily cases across the entire planet, the US, EU (de+fr+it+es only) and a small country (RO) that does not matter to anybody but me. You can show/hide different country in Settings.
Select "COVID-19: CONFIRMED" data in main chart and add the indicator.

Covid-19 CFR, Difference Indicator [Bitduke]Simple indicator to track case fatality rate and difference in deaths | recovered cases for novel coronavirus. It could help to trace the impact on the stock market and cryptocurrencies.
Case fatality rate (CFR) - an indicator equal to the ratio of the number of deaths from a disease to the number of patients with this disease for a certain period of time. That is, if CFR = 30% it means one died, two cured out of 3 infected.
The percentage change between recovered cases
The percentage change between deaths
Assumption
It can be assumed that if we consider bitcoin as a store of value, then when the situation getting worse (CFR + deaths difference increase and recovery difference decreases) bitcoin price tends to rise and vice versa.
But this is only an assumption that requires additional tests; there is still little data for a robust statistical analysis.

COVID19-USCOVID19 data United States and 5 states.
Choose mode for Active, Change, or Total cases.
Edit States in script code n1-n5

COVID19COVID19 data worldwide and 5 countries.
Choose mode for Active, Change, or Total cases.
Edit Countries in script code n1-n5
