ACAT Period Tracker (14-600 Std-Res) [acatwithcharts]This is the corresponding period length tracker for ACAT (14-600 Std-Res). The constraints of Pinescript make it necessary to plot a separate indicator in a separate window to actually read out the period numbers without massively skewing the chart by default.
Taking some lessons from how subscribers ended up making best use of the period length trackers for my prior scripts, I've set the default line widths wide so that it pairs well on the same window as 3D WAVE-PM.
My volatility indicators are available by subscription in several packages through SharkCharts.live - and this is planned to be the first new one ready to add. I plan to release a video explaining how to use this indicator coinciding with launch, as there's a lot to talk about. Videos on my other indicators are currently hosted on DadShark's YouTube channel.
Current pricing and subscription details will be kept up-to-date on SharkCharts.live
Adaptive

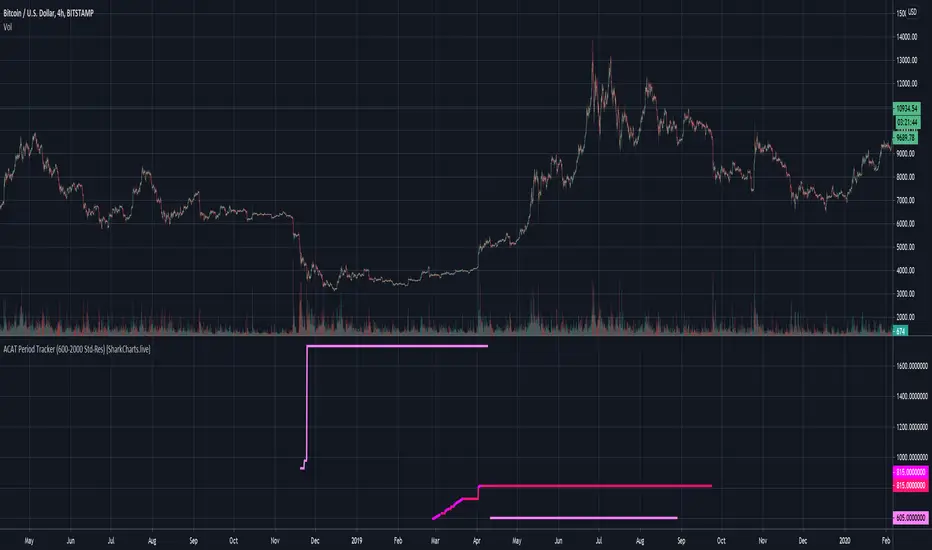
ACAT Period Tracker (600-2000 Std-Res) [acatwithcharts]This is the corresponding period length tracker for ACAT (600-2000 Std-Res). The constraints of Pinescript make it necessary to plot a separate indicator in a separate window to actually read out the period numbers without massively skewing the chart by default.
Taking some lessons from how subscribers ended up making best use of the period length trackers for my prior scripts, I've set the default line widths wide so that it pairs well on the same window as 3D WAVE-PM. Notably, you would need to use the Hi-Res 605-2000 period version to pair with this higher tracking range in that setup.
My volatility indicators are available by subscription in several packages through SharkCharts.live - and this is planned to be the first new one ready to add. I plan to release a video explaining how to use this indicator coinciding with launch, as there's a lot to talk about. Videos on my other indicators are currently hosted on DadShark's YouTube channel.
Current pricing and subscription details will be kept up-to-date on SharkCharts.live
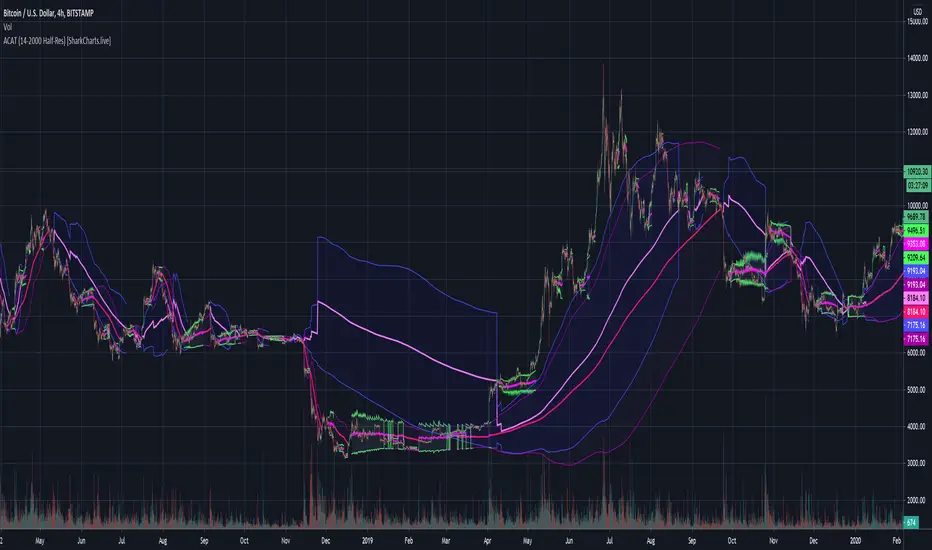
ACAT (14-2000 Half-Res) [acatwithcharts]Adaptive Comprehensive Average Tracker is a 2 in 1 version of Mean Reversion MA and Compression MA. The slightly odd name is a backronym that spells "ACAT" - suffice it to say, I'm pretty proud of what these two indicators have developed into.
As I've looked into ways to lower variable count and optimize ACAT, I've found that decreasing the resolution in half to allow the full range that I otherwise split across two indicators is broadly more convenient to use and seems to have faster loading and far fewer timeouts. There is a significant precision tradeoff that is most acutely felt with more dramatic sawtoothing when plotting the current highest compressed period. For most practical use cases, I think people will want to make this trade-off and then if necessary to look at a compression range do a second pass with a higher resolution version of the indicator.
My volatility indicators are available by subscription in several packages through SharkCharts.live - and this is planned to be the first new one ready to add. I plan to release a video explaining how to use this indicator coinciding with launch, as there's a lot to talk about. Videos on my other indicators are currently hosted on DadShark's YouTube channel.
Current pricing and subscription details will be kept up-to-date on SharkCharts.live
Edge-Preserving FilterIntroduction
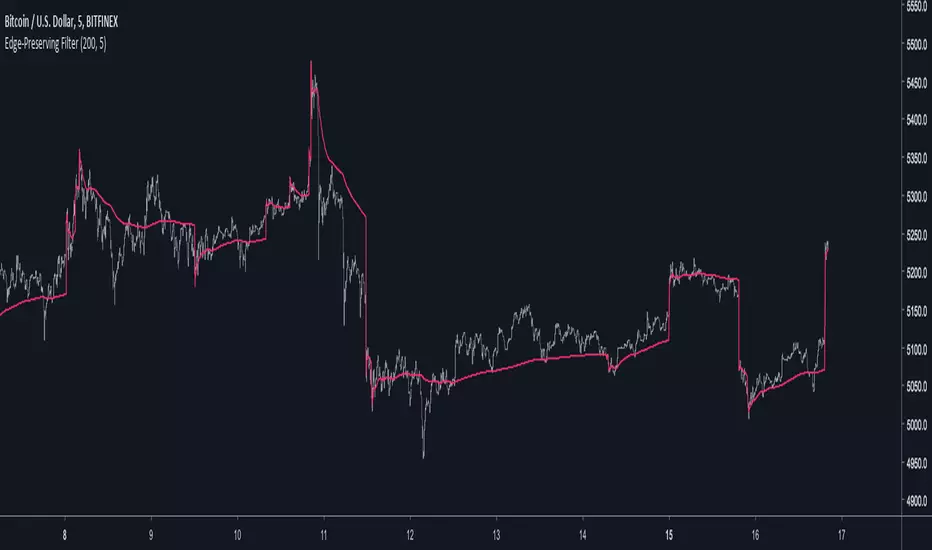
Edge-preserving smoothing is often used in image processing in order to preserve edge information while filtering the remaining signal. I introduce two concepts in this indicator, edge preservation and an adaptive cumulative average allowing for fast edge-signal transition with period increase over time. This filter have nothing to do with classic filters for image processing, those filters use kernels convolution and are most of the time in a spatial domain.
Edge Detection Method
We want to minimize smoothing when an edge is detected, so our first goal is to detect an edge. An edge will be considered as being a peak or a valley, if you recall there is one of my indicator who aim to detect peaks and valley (reference at the bottom of the post) , since this estimation return binary outputs we will use it to tell our filter when to stop filtering.
Filtering Increase By Using Multi Steps Cumulative Average
The edge detection is a binary output, using a exponential smoothing could be possible and certainly more efficient but i wanted instead to try using a cumulative average approach because it smooth more and is a bit more original to use an adaptive architecture using something else than exponential averaging. A cumulative average is defined as the sum of the price and the previous value of the cumulative average and then this result is divided by n with n = number of data points. You could say that a cumulative average is a moving average with a linear increasing period.
So lets call CMA our cumulative average and n our divisor. When an edge is detected CMA = close price and n = 1 , else n is equal to previous n+1 and the CMA act as a normal cumulative average by summing its previous values with the price and dividing the sum by n until a new edge is detected, so there is a "no filtering state" and a "filtering state" with linear period increase transition, this is why its multi-steps.
The Filter
The filter have two parameters, a length parameter and a smooth parameter, length refer to the edge detection sensitivity, small values will detect short terms edges while higher values will detect more long terms edges. Smooth is directly related to the edge detection method, high values of smooth can avoid the detection of some edges.
smooth = 200
smooth = 50
smooth = 3
Conclusion
Preserving the price edges can be useful when it come to allow for reactivity during important price points, such filter can help with moving average crossover methods or can be used as a source for other indicators making those directly dependent of the edge detection.
Rsi with a period of 200 and our filter as source, will cross triggers line when an edge is detected
Feel free to share suggestions ! Thanks for reading !
References
Peak/Valley estimator used for the detection of edges in price.
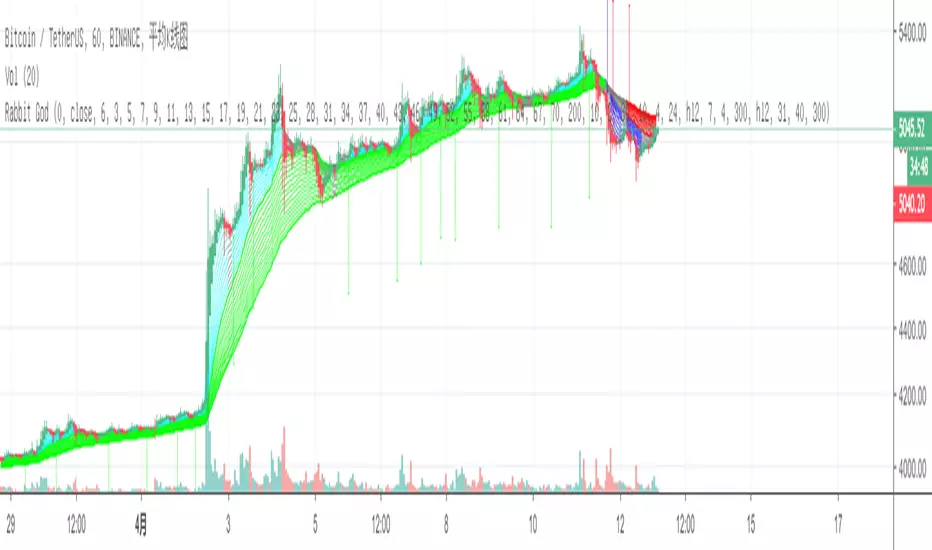
Trend tracking strategy of proprietary traders-RabbitThis is my latest strategy integration. It is a combination of trend tracking strategy and visualization trend. I believe it will bring you a clear trend discrimination and relatively reliable trading signal hints.
(Note: This strategy parameter has special parameter debugging and Optimization for BTC1h/BIANACE Heikin-ashi chart. It works best here. Other trade pairs or parameter versions of investment targets will be published specially if necessary.)
Statement of strategy concept:
The concept of strategy is trend tracking. The formation and continuation of trend is the product of speculation market for thousands of years. There are various strategies including CTA trend strategy, shock regression strategy, grid strategy, Martin strategy, Alpha strategy and so on. These strategies have their own merits just like different schools of Chinese knight-errant. Choose one, a master is not able to do hundreds of tricks, but to practice one trick thousands of times.
Every strategy has its own right and wrong. Trading is not violence, but a process of advancing, retreating, and making profits steadily. Therefore, the use of trend tracking strategy must overcome greed in human nature, profit and loss homology, dare to bear the shock of withdrawal in order to make a big profit when the real trend arrives. (Of course, this strategy has largely avoided filtering shocks, which will be explained later.)
Policy-building instructions:
Any trend tracking strategy can produce good results when there is a trend, so judging whether a trend strategy is good or bad depends on its withdrawal performance when it is shaking. This CTA trend tracking strategy uses Kauffman adaptive algorithm, fractal adaptive dimension, self-research algorithm and other tools, and has largely avoided filtering the signal in the shock without delay to follow the trend.
New version of the note:
The latest version adds the trend drawing of negativity, which can clearly distinguish the rising or falling or oscillating trend. However, the algorithm of strategy signal has no direct relationship with trend color. Trend color helps you to distinguish trend, and point signal helps you to refer to trade. This strategy is only a simple trading signal, risk control, warehouse management also need manual operation.
(Note: This strategy parameter has special parameter debugging and Optimization for BTC1h/BIANACE Heikin-ashi chart. It works best here. Other trade pairs or parameter versions of investment targets will be published specially if necessary.)
Good luck to all of you and a smooth deal.~

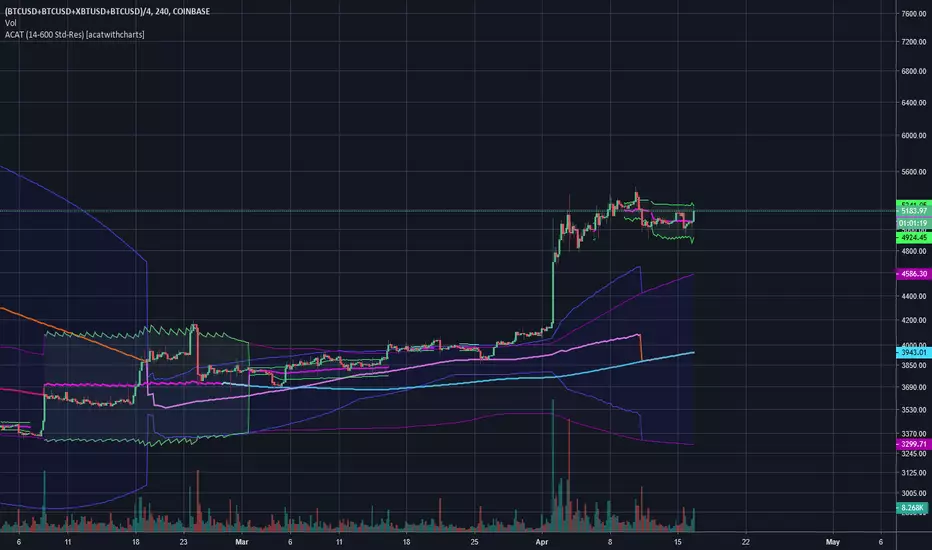
ACAT (600-2000) [acatwithcharts]Adaptive Comprehensive Average Tracker is a 2 in 1 version of Mean Reversion MA and Compression MA. The slightly odd name is a backronym that spells "ACAT" - suffice it to say, I'm pretty proud of what these two indicators have developed into.
The best solution I've managed to find to the variable count limits in Pinescript is to split the indicator into two that cover different ranges. This version covers period lengths from 600-2000. I've then added features to hide the lower indicator's plot while it's maxed out which makes them look roughly stitched together and has a nice added benefit that it require less work by the higher period script so it loads more quickly.
This is still a work in progress at the time of posting as I attempt to try to add more functionality and improve the intuitiveness of the combined menu, but assuming all goes well, I may be able to mostly deprecate the individual indicators and replace them with this combined version when I'm satisfied that it's ready to release to subscribers.
My volatility indicators are available by subscription in several packages through SharkCharts.live - and this is planned to be the first new one ready to add. I plan to release a video explaining how to use this indicator coinciding with launch, as there's a lot to talk about. Videos on my other indicators are currently hosted on DadShark's YouTube channel.
Current pricing and subscription details will be kept up-to-date on SharkCharts.live

Adaptive Comprehensive Average Tracker (ACAT) [acatwithcharts]Adaptive Comprehensive Average Tracker is a 2 in 1 version of Mean Reversion MA and Compression MA. The slightly odd name is a backronym that spells "ACAT" - suffice it to say, I'm pretty proud of what these two indicators have developed into.
At the moment, it is limited to the 600-period cap; just using the logic of the two indicators in one hits runs into the limits of Pinescript. I've got some ideas to try, but for most practical purposes, the 600 cap was generally enough and the longer lookbacks are very prone to timing out anyway.
The hope is to replace two indicators that have periodic issues timing out with one, which should be substantially more convenient to use and on average mean dealing with fewer refreshes.
This is still a work in progress at the time of posting as I attempt to try to add more functionality and improve the intuitiveness of the combined menu, but assuming all goes well, I may be able to mostly deprecate the individual indicators and replace them with this combined version when I'm satisfied that it's ready to release to subscribers.
My volatility indicators are available by subscription in several packages through SharkCharts.live - and this is planned to be the first new one ready to add. I plan to release a video explaining how to use this indicator coinciding with launch, as there's a lot to talk about. Videos on my other indicators are currently hosted on DadShark's YouTube channel.
Current pricing and subscription details will be kept up-to-date on SharkCharts.live
Best Rabbit Strategy fiterResults after a long period of research
This strategy uses CTA Trend Tracking Strategy, which is given to the person who is close to you. And add filter with fractal dimension. Please note that any strategy is correct and wrong. Please accept the loss list calmly so as to make a big profit when the trend comes.
It works better with Heikinashi chart.
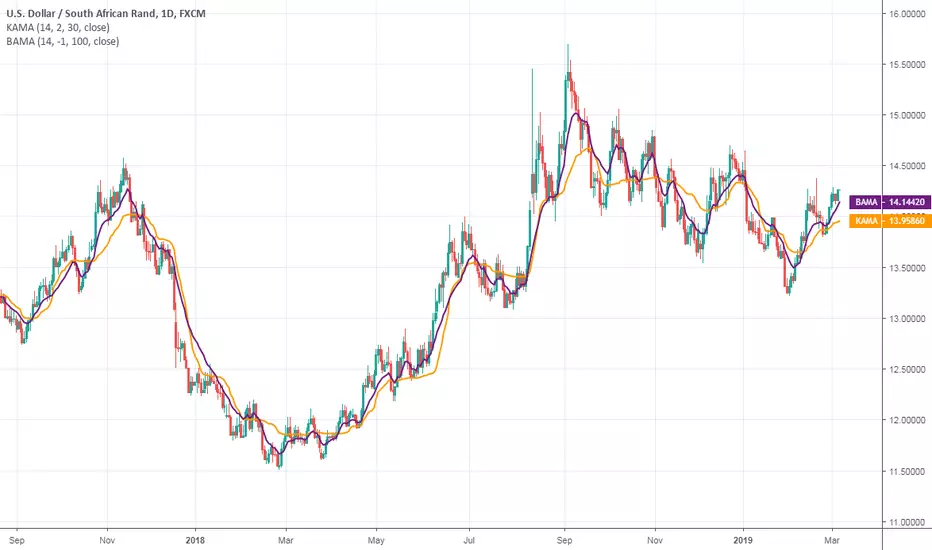
Bryant Adaptive Moving Average@ChartArt got my attention to this idea.
This type of moving average was originally developed by Michael R. Bryant (Adaptrade Software newsletter, April 2014). Mr. Bryant suggested a new approach, so called Variable Efficiency Ratio (VER), to obtain adaptive behaviour for the moving average. This approach is based on Perry Kaufman' idea with Efficiency Ratio (ER) which was used by Mr. Kaufman to create KAMA.
As result Mr. Bryant got a moving average with adaptive lookback period. This moving average has 3 parameters:
Initial lookback
Trend Parameter
Maximum lookback
The 2nd parameter, Trend Parameter can take any positive or negative value and determines whether the lookback length will increase or decrease with increasing ER.
Changing Trend Parameter we can obtain KAMA' behaviour
To learn more see www.adaptrade.com
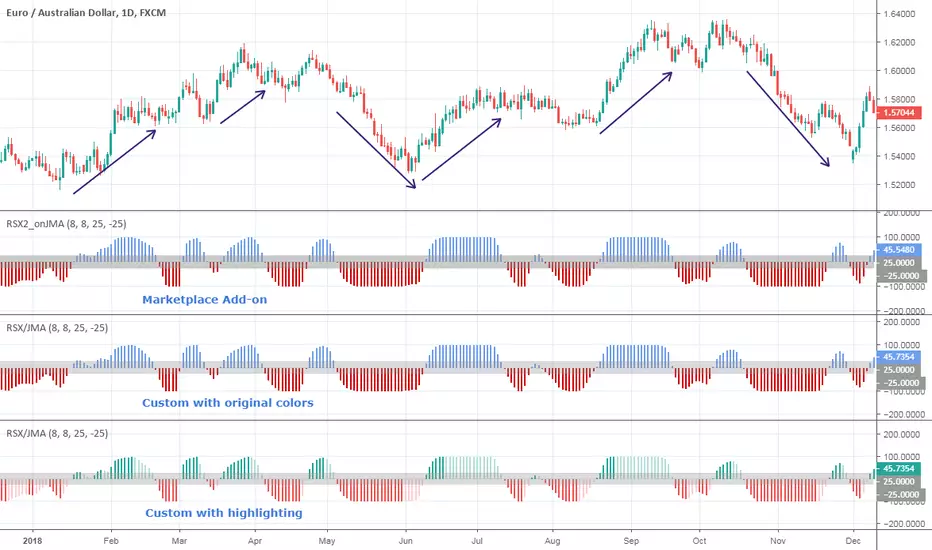
Jurik RSX on JMAHello friends,
Meet Jurik RSX on JMA — a refined version of Jurik's classic RSX that applies advanced pre-smoothing using the best
original JMA clone available on TradingView. By filtering the input price through JMA, it delivers a cleaner, faster, and more efficient representation of market momentum — maintaining exceptional smoothness with almost no lag.
🛠 How It Works
RSX is Jurik's noise-free alternative to the traditional RSI, designed to measure trend direction and efficiency with minimal distortion. However, when the input price is noisy, even RSX can lose precision.
To solve this, the input price is first smoothed with JMA — Jurik's most advanced low-lag filter. As Jurik Research noted:
“A smooth (low noise) trend is more efficient than a noisy trend... RSX would respond better when fed pre-smoothed price data. And there's no better way to pre-smooth than by using JMA.”
This approach allows RSX to reverse with the market almost instantly , reacting sharply to genuine turning points while ignoring random fluctuations — providing traders with a clear, stable view of trend dynamics.
🔥 Key Features
JMA pre-smoothing integrated with Jurik RSX
Near-zero lag response with reduced noise
Optional overbought/oversold breakout highlighting
If you have any questions or would like to explore related Jurik-based tools, feel free to contact me directly via DM.
👋 Good luck and happy trading!
付費腳本
Jurik JMA/DWMA MACDHello friends,
Meet the Jurik JMA/DWMA MACD — an oscillator version of the crossover system originally recommended by Mark Jurik. It combines the Jurik Moving Average (JMA) and the Double Weighted Moving Average (DWMA) to form a smooth yet highly responsive convergence/divergence signal.
🛠 How It Works
Unlike standard EMA-based MACDs, this version uses Jurik's advanced non-lagging smoothing method to eliminate noise without sacrificing responsiveness , resulting in exceptionally clear and timely momentum readings.
I use the best original JMA clone available on TradingView — its behavior closely matches the genuine Jurik algorithm.
As Mark Jurik stated:
“Of all the different combinations of moving average filters to use for a MACD oscillator, we prefer using the JMA–DWMA combination.”
This oscillator measures the distance between JMA and DWMA, revealing when short-term momentum diverges from the longer-term trend. The result is a non-lagging MACD-style signal that highlights shifts in trend strength, early reversals, and exhaustion zones — all with Jurik-level smoothness and precision.
🔥 Key Features
Non-lagging, noise-reduced oscillator response
Peak highlighting
Built-in alerts for bullish and bearish peaks
If you'd like access or have any questions, feel free to reach out to me directly via DM.
👋 Good luck and happy trading!
付費腳本

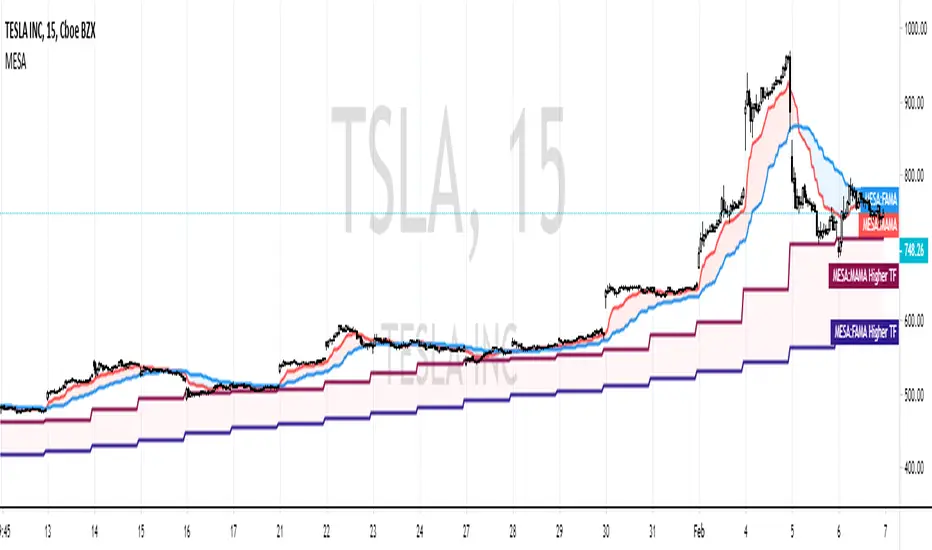
MESA Adaptive Moving AverageIntro
One of Ehlers most well-known indicators! I've seen many variations of this on TradingView, however, none seem to be true to the original released by Ehlers himself.
I've taken it upon myself to simply translate the MAMA into Pinescript, instead of re-writing like some others have done.
You can use it as a very effective & adaptive moving average with other signals or
as a standalone signal.
In the case that you're going to use it for signals and not simple technical trading (non-quantitative),
I've also added a threshold parameter to filter out weak signals.
My MAMA indicator is different from others in very simple ways - I don't use the nz() command, which sets all "Not a Number" values to 0. In others' scripts, you immediately load the indicator with several 0 values,
causing a slight lag in future calculations since this code is recursive (refers to previous values it generated).
In my version, I simply wait until the script has access to all the bar data it needs, instead of instantly performing calculations and
setting erroneous values to 0. In this case, we start with the correct values (or closer to correct).
If you want to compare this indicator the current most popular MAMA by LazyBear, you'll notice it often gives buy and sell crosses one bar earlier than theirs.
Setting Parameters
Source - the data series to perform calculations on. (Initially, Ehlers himself favored hl/2, but conceded that there isn't empirical benefit over close.)
Fast Limit - controls how quickly the MAMA will "ratchet up" fast price action. (Higher values are faster)
Slow Limit - controls how closely the FAMA will follow the MAMA. (Again, higher is faster. You typically want the FAMA to be slower though.)
Crossover Threshold - simple error thresholding to limit the number of weak trade signals. (Lower means lower tolerance)
Show Crosses? - show/hide the arrows at moving average crosses
Robust Cycle Measurement [Ehlers]The last of Ehlers Instantaneous Frequency Measurement methods.
This is a more robust version of this script.
I wrote it as a function, so you can simply copy and paste it into any script to add an adaptive period setting capability.
Cheers,
DasanC
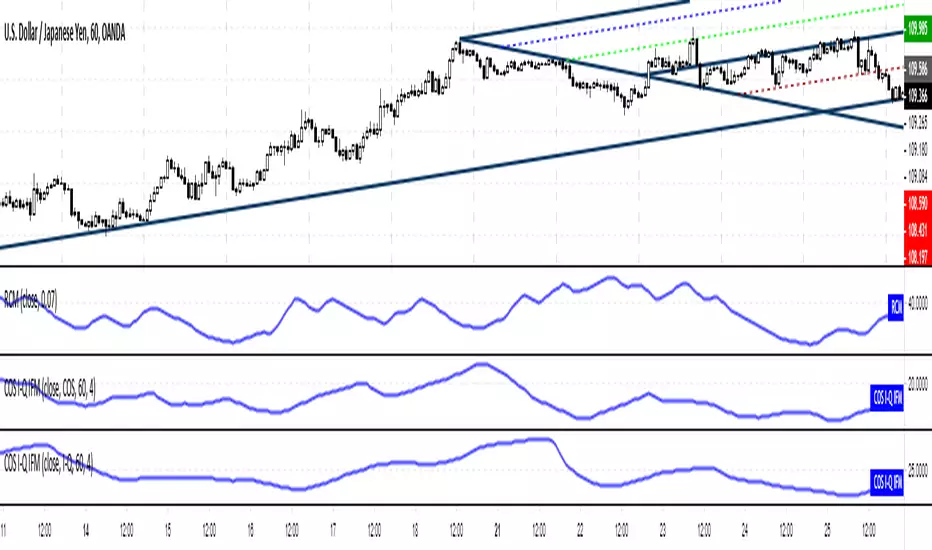
Adaptive Zero Lag EMA v2This is my most successful strategy to date! Please enjoy and join the Open Source movement by sharing your code and ideas online!
OPERATING PRINCIPLE
The strategy is based on Ehlers idea that any indicator can be turned into a signal-producing trade system through smoothing and other filtering processes.
In fact, I'm using his Zero Lag EMA (ZLEMA) as a baseline indicator as well as some code snippets he has made public (1). God bless open source!
Next, I've provided the option to use an Instantaneous Frequency Measurement (IFM) method, which will adaptively choose the best period for the ZLEMA (2)
I've written other studies that use the differential calculus approximations for IFM, so it was only natural to include them in this strategy.
The primary two are Cosine IFM (3) and In-phase Quadrature IFM (4). You can also find an indicator with both plotted and the ability to average them together, as one IFM prefers long periods and the other short. (5)
BEFORE WE BEGIN
1. This strategy only runs on "normal" FX pairs (EURUSD, GBPJPY, AUDUSD ...) and will fail on Metals or Commodities.
Cryptos are largely untested.
2. Please run it on these time frames: M15 to D.
Anything outside this range will likely fail.
HOW TO USE AND SUCCEED
1. If the Default settings don't produce good results right off the bat, then lower gain limit to 1 or 2 and threshold to 0.01.
2. Test each setting under adaptive method . If you want to leave it Off , then I'd recommend using some kind of IFM (see my links below) to
discover the most efficient period to use.
3. Once you have the best adaptive method chosen, begin incrementing gain limit until you find a nice balance between profit factor (PF) and drawdown.
4. Now, begin incrementing threshold . The goal is to have PF above 2 and a drawdown as low as possible.
5. Finally, change the source ! Typically, close is the best option, but I have run into cases where high
yielded the highest returns and win rate.
6. Sit back, relax, and tweak the risk until you're happy with the return and drawdown amounts.
ADVANCED
You may need to adjust take profit (TP) points and stop loss (SL) points to create the best entry possible. Don't be greedy! You'll likely have poor
results if the TP is set to 300 and SL is 50.
If you are trading a pair that has a long Dominant Cycle Period , then you may increase Max Period to allow the IFM
to accept longer periods. Any period above the Max Period will be rejected. This may increase lag time!
Cheers and good luck trading!
-DasanC
PS - This code doesn't repaint or have future-leak, which was present in Pinescript v2.
PPS - Believe me! These returns are typical! Sometimes you must push aside the "if it's too good to be true..." mindset that society has ingrained in you.
Do you really believe the most successful pass up opportunities before investigating them? ;)
(1) Ehlers & Ric Zero Lag EMA
(2) Measuring Cycles by Ehlers
(3) Cosine IFM
(4) Inphase Quadrature IFM
(5) Averaging IFM

Low Lag Exponential Moving AverageThis is a low-lag EMA, colorized to help identify turn around points. You have the option of making it adaptive as well, different methods
of signal processing or simply an average of the two.
See my previous script to understand how these adaptive methods work

Adaptive Bandpass Filter [Ehlers]This is my latest bandpass filter - used to determine if a security is in a trend or cycle.
Now with an adaptive period setting! I use Ehlers in-phase & quadrature dominant cycle measurement (IQ IFM) method to set the period dynamically.
This method favors longer periods which tend to produce smoother, albeit laggier bandpass oscillator plots. From my quick tests, I tend to have lag between 4 and 8 bars, depending on the Timeframe.
The lower timeframes tend to have more noise and thus produce more interfering frequencies that may cause lag.
>Settings
Source: Select the data source to perform calc's on (close, open, etc...)
Period: Select the period to tune. Periods outside of this value will be attenuated (reduced)
Adaptive: Enable to have the I-Q IFM set the period for you (disables Period setting)
Bandpass Tolerance: Allow periods that are plus/minus the chosen period to pass.
Cycle Tolerance: Sensitivity of cycle mode. Lower values consider trends more frequent, higher values consider cycles more frequent.
Bandpass tolerance example: for instance, if this setting is 0.1 (10%) and Period is set to 20, then waves with a period of 18 - 22 will pass.
>How to read
Red line is the bandpass output, showing a lagged version of the dominant cycle representing the
Black lines are the upper and lower bounds for a cycle
Green Background indicates an uptrend
Red background indicates a downtrend

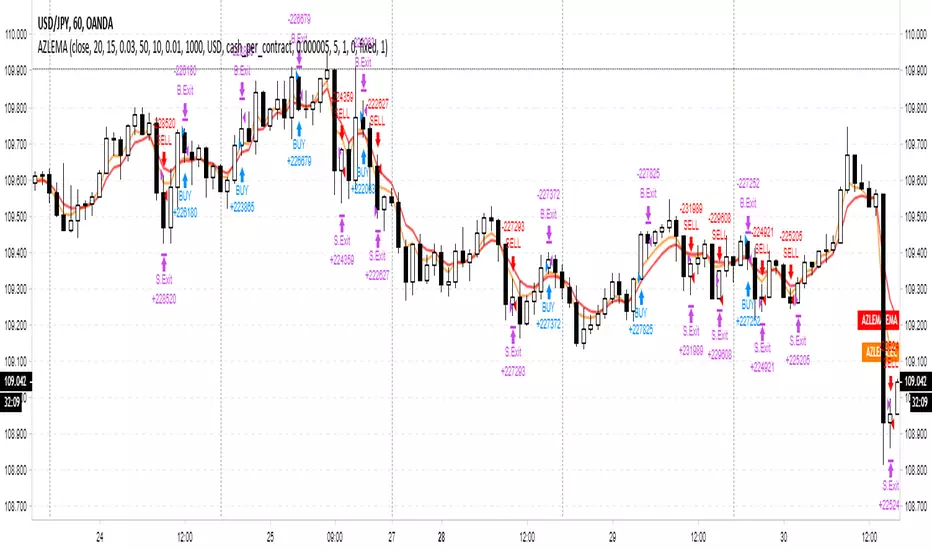
Adaptive Zero Lag EMA Strategy [Ehlers + Ric]Behold! A strategy that makes use of Ehlers research into the field of signal processing and wins so consistently, on multiple time frames AND on multiple currency pairs.
The Adaptive Zero Lag EMA (AZLEMA) is based on an informative report by Ehlers and Ric .
I've modified it by using Cosine IFM, a method by Ehlers on determining the dominant cycle period without using fast-Fourier transforms
Instead, we use some basic differential equations that are simplified to approximate the cycle period over a 100 bar sample size.
The settings for this strategy allow you to scalp or swing trade! High versatility!
Since this strategy is frequency based, you can run it on any timeframe (M1 is untested) and even have the option of using adaptive settings for a best-fit.
>Settings
Source : Choose the value for calculations (close, open, high + low / 2, etc...)
Period : Choose the dominant cycle for the ZLEMA (typically under 100)
Adaptive? : Allow the strategy to continuously update the Period for you (disables Period setting)
Gain Limit : Higher = faster response. Lower = smoother response. See for more information.
Threshold : Provides a bit more control over entering a trade. Lower = less selective. Higher = More selective. (range from 0 to 1)
SL Points : Stop Poss level in points (10 points = 1 pip)
TP Points : Take Profit level in points
Risk : Percent of current balance to risk on each trade (0.01 = 1%)
www.mesasoftware.com
www.jamesgoulding.com(Measuring%20Cycles).doc
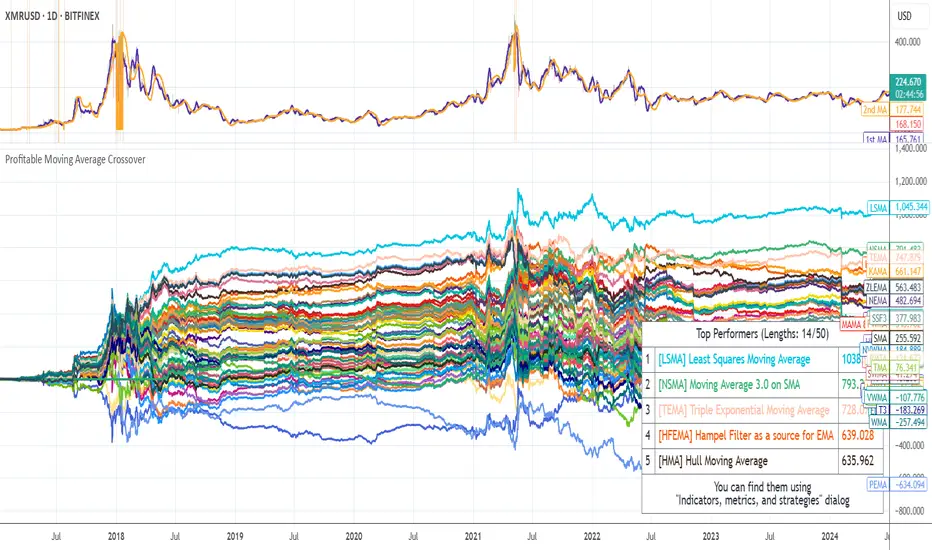
Profitable Moving Average CrossoverHello friends,
I'm glad to introduce a powerful research and optimization tool that takes the classic moving average crossover concept to a new level. Instead of relying on guesswork or fixed MA types, it lets you objectively discover the most profitable moving average pair for any instrument and timeframe.
🛠 How It Works
Moving average crossovers are among the most popular trading systems. A buy signal occurs when a shorter (faster) moving average crosses above a longer (slower) one, and a sell signal when it crosses below. The system's responsiveness — and the number of generated signals — depend on the chosen MA lengths and types.
This script evaluates 61 moving average types (including Jurik, Kaufman, Ehlers, Apirine, and others) and backtests all possible crossover combinations either across the entire chart history or within a custom backtest window . It then plots continuous profit metric lines for each crossover type and displays the top 5 performers in a results table. Each MA type is color-coded, allowing quick visual identification of which systems have historically delivered the strongest results.
🔥 Key Features
Pine Script V6 — optimized for performance and stability
Tests 61 moving average types , from classic to adaptive designs
Custom Backtest Window — analyze the entire history or a specific date range
Continuous profit curves for every crossover type plotted on chart
Top 5 crossover systems displayed in a compact summary table
Color-coded MA identifiers for fast visual comparison
Supports custom parameters for advanced MAs (JMA, ALMA, McGinley Dynamic, Adaptive Laguerre Filter, etc.)
Works seamlessly across all assets and timeframes
NOTE: Results will vary across different tickers and timeframes. Seeing strong performance in one preview does not imply similar profitability elsewhere — this variability is normal due to differing market structures.
NOTE 2: You can experiment with the tool independently or request a full study, in which case I'll share a spreadsheet of all backtest results with you.
👋 Good luck and happy trading!
付費腳本
Jurik Moving AverageThis is my best attempt to reproduce the original Jurik Moving Average. It differs from Jurik's a little bit, but in most cases it behaves like the original.
Jurik Moving Average is known as a superior noise elimination (causal, nonlinear and adaptive) filter and a world class moving average that tracks and smoothes price charts or any market-related time series with surprising agility.
Settings
Length (default: 7 )
Phase (default: 50 )
Price Source (default: close )
I attached some screenshots to show you how it works with other instruments
USDJPY, D
USDJPY, 60
USDCAD, D
USDCHF, D
EURUSD, D
GBPJPY, D
AUDUSD, D
XAUUSD, D
XAUUSD, 60
AAPL, D
AAPL, 60
MSFT, D
AMZN, D
BTCUSD, D
BTCUSD, 60
ETHUSD, D
Good luck and happy trading!

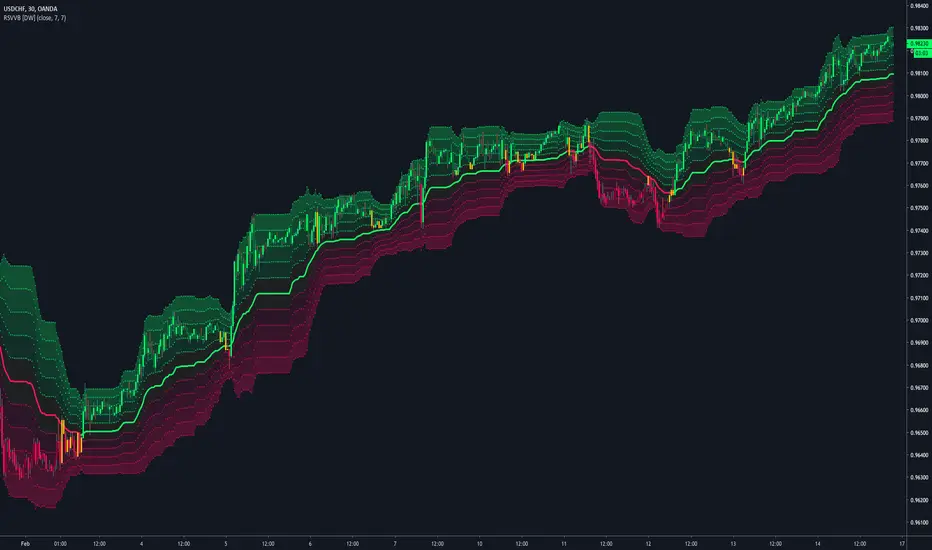
Relative Strength Volatility Variable Bands [DW]This is an experimental adaptive trend following study inspired by Giorgos Siligardos's Reverse Engineering RSI and Tushar S. Chande's Variable Moving Average.
In this study, reverse engineered RSI levels are calculated and used to generate a volatility index for VMA calculation.
First, price levels are calculated for when RSI will equal 70 and 30. The difference between the levels is taken and normalized to create the volatility index.
Next, an initial VMA is calculated using the created volatility index. The moving average is an exponential calculation that adjusts the sampling length as volatility changes.
Then, upper and lower VMAs are calculated by taking a VMA of prices above and below the initial VMA. The midline is produced by taking the median of the upper and lower VMAs.
Lastly, the band levels are calculated by multiplying the distance from the midline to the upper and lower VMAs by 1, 2, 3, 4, and 5.
Bar colors are included. They're based on the midline trend and price action relative to the upper and lower VMAs.
Adaptive StochasticAdapt To The Right Situation
There are already some Adaptive Stochastic scripts out there, but i didn't see the concept of using different periods highest/lowest for their calculations. What we want
for such oscillator is to be active when price is trending and silent during range periods. Like that the information we will see will be clear and easy to use.
Switching between a long term highest/lowest during range periods and a short term highest/lowest during trending periods is what will create the adaptive stochastic.
The switching is made thanks to the Efficiency Ratio , the period of the efficiency ratio is determined by the length parameter.
The period of the highest and lowest will depend on the slow and fast parameters, if our efficiency ratio is close to one (trending market) then the indicator will use highest and lowest of period fast , making the indicator more reactive, if our efficiency ratio is low (ranging market) then the indicator will use highest and lowest of period slow , making the indicator less reactive.
The source of the indicator is a running line ( lsma ) of period slow-fast .
it is also possible to switch the parameters values, making the indicator reactive during ranging market and less reactive during trending ones.
Hope you enjoy
For any questions/demands feel free to pm me, i would be happy to help you

Retention-Acceleration FilterAnother Adaptive Filter
This indicator share the same structure as a classic adaptive filter using an exponential window with a smoothing constant.
However the smoothing constant used is different than any previously made (Kalman Gain, Efficiency ratio, Scaled Fractal Dimension Index) ,
here the smoothing constant is inspired by the different formulations for parameters resolution used in HPLC S. Said (J. High Resolution Chromatograpy &Chromatography Communciations, (1979) 193).
Different assumptions can be made which lead to different expressions for resolution in chromatographic parameters, therefore we will use highest's and lowest's in order to estimate an optimal smoothing constant based on if the market is trending or not. It can be complicated at first but the goal is to provide both smoothness at the right time and a fast estimation of the market center.
Handling Noise
In Red a Pure Sinewave. In White Sinewave + Noise. In Blue our filter of Period 3
Handling stationary signals is not the best thing to do since we need highest's and lowest's and for that non stationary signals with trend + cycle + noise are more suitable.
It is also possible to make it act faster by quiting the pow() function of AltK with sqrt(length) and smoothing the remaining constant.
