DMI + HMA - No Risk ManagementDMI (Directional Movement Index) and HMA (Hull Moving Average)
The DMI and HMA make a great combination, The DMI will gauge the market direction, while the HMA will add confirmation to the trend strength.
What is the DMI?
The DMI is an indicator that was developed by J. Welles Wilder in 1978. The Indicator was designed to identify in which direction the price is moving. This is done by comparing previous highs and lows and drawing 2 lines.
1. A Positive movement line
2. A Negative movement line
A third line can be added, which would be known as the ADX line or Average Directional Index. This can also be used to gauge the strength in which direction the market is moving.
When the Positive movement line (DI+) is above the Negative movement line (DI-) there is more upward pressure. Ofcourse visa versa, when the DI- is above the DI+ that would indicate more downwards pressure.
Want to know more about HMA? Check out one of our other published scripts
What is this strategy doing?
We are first waiting for the DMI to cross in our favoured direction, after that, we wait for the HMA to signal the entry. Without both conditions being true, no trade will be made.
Long Entries
1. DI+ crosses above DI-
2. HMA line 1 is above HMA line 2
Short Entries
1. DI- Crosses above DI+
2. HMA line 1 is below HMA lilne 2
Its as simple as that.
Conclusion
While this strategy does have its downsides, that can be reduced by adding some risk manegment into the script. In general the trade profitability is above average, And the max drawdown is at a minimum.
The settings have been optimised to suite BTCUSDT PERP markets. Though with small adjustments it can be used on many assets!
Algorithm

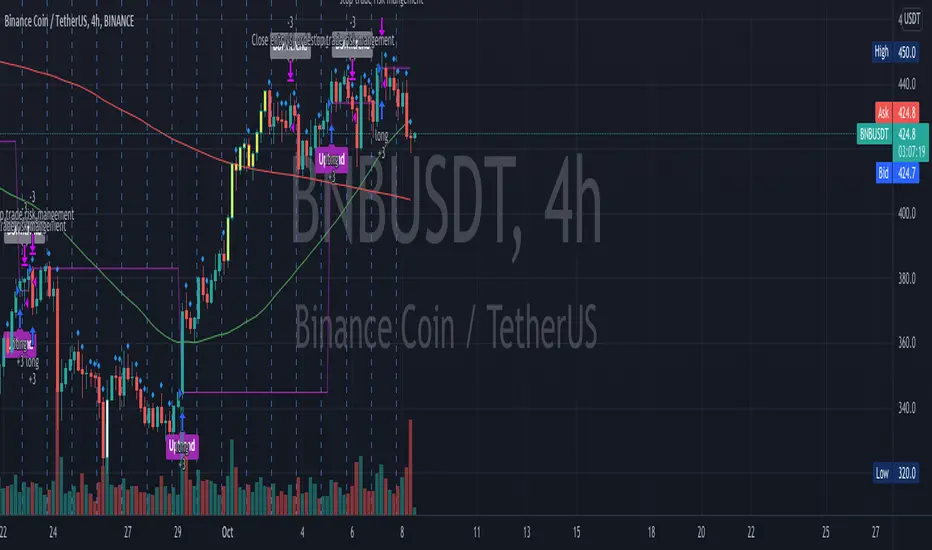
OnePunch Algo Momentum Indicator V1This is another Plugin from One Punch Algo Team. We call it OnePunch Algo Momentum Indicator V1.
Basic Use:
One Punch Algo Momentum Indicator plugin is used for momentum stocks and high volatility crypto. It provide signals based on Simple Moving Average, Volume, Support & Resistance Lines.
SIGNALS/ALERTS
Buy Signal: Purple Color uptrend icon gives you a signal of an up-trending movement or we call it momentum movement. This signal basically happen when a stock land in a high volatility zone. We use in-build systems such as SMA, Support and Resistance and Trends to come up with the Buy Signal.
Sell Signal: Gray Color downtrend icon gives you a signal of a downtrend movement.
Other Lines Shown in the Diagram:
Red Line is the 200 Day Simple Moving Average (SMA)
Green Line is the 50 Day Simple Moving Average (SMA)
Strategy Tester
Always make sure to use the strategy tester to test how historically our Algo has performed in different time frames. One Punch Algo Momentum Indicator provide the ability to backtest based on certain time periods. This allows you to backtest our Algo vs some other Algo to find which performed well for the given time period, you if you want to see buy and hold performance better than the use of an Algo. This is a strong tool to use for your analysis of a stock or crypto.
What are the timeframes where it is most effective?
Different Stocks or Crypto perform differently with One Punch Algo Momentum Indicator. Please make sure to backtest a stock or crypto before you use the strategy.
Short Term/Day Trading Setup
For Short Term or Day Trade: 1min, 5min, 15min & 30min candlesticks works really well.
Also 3min, 5min, 7min and 15min works as well
Mid Term Trading Setup
For Mid-term traders: 30min, 1hr,2hr, and 4hr setup works really well.
For Long Term Trading Setup
For long term traders: 4hr, 1D, 1Week and 1Month Setup works well.
Best used with Heikin Ashi or Candlestick charts.
DISCLAIMER: Stocks and options trading involves substantial RISK of LOSS and is NOT suitable for every investor. The valuation of stocks and options may fluctuate, and, as a result, clients may lose more than their original investment. If the market moves against you, you may sustain a total loss greater than the amount you deposited into your account. You are responsible for all the risks and financial resources you use and for the chosen trading system. You should not engage in trading unless you fully understand the nature of the transactions you are entering into and the extent of your exposure to loss. If you do not fully understand these risks, you must seek independent advice from your financial advisor.
All trading strategies are used at your own risk. And OnePunch ALGO Developer, Youtuber or the channel does NOT take any responsibility for your losses using any of the advice or suggestions or strategies are shown/said in any of OnePunch ALGO Youtuber or the channel videos.
Hull Crossover Strategy no TP or SLWhat is it?
A simple yet effective strategy ran on the 30m chart.
This is a basic idea that can be expanded on using different indicator to either add signals or filter out certain bad signals!
The strategy consists of 1 fast moving average and 1 slow moving average.
Both of these moving averages are the Hull Moving Average
What is the Hull Moving Average?
The Hull Moving Average ( HMA ) is a directional trend indicator.
It captures the current market conditions and uses recent price action to determine if conditions are bullish or bearish relative to historical data.
The Hull is different from traditional trend indicators like the EMA and the SMA .
It is designed to reduce the lag often associated with other MAs by providing a faster signal on a smoother visual plane.
How it works?
When the fast HMA crosses over the slow HMA , we initiate a long signal, and
when the fast HMA crosses under the slow HMA , we initiate a short signal.
Conclusion
The power of simplicity is what makes this such a great core to use to build onto making something even better!
The results were optimised to suit the most common market conditions seen today.
******** Not financial advice! ********

Ichimoku Cloud Strategy Long Only [Bitduke]Slightly modificated and optimized for Pine Script 4.0, Ichimoku Cloud Strategy which, suddenly, good suitable for the several crypto assets.
Details:
Enter position when conversion line crosses base line up, and close it when the opposite happens.
Additional condition for open / close the trade is lagging span, it should be higher than cloud to open position and below - to close it.
Backtesting:
Backtested on SOLUSDT ( FTX, Binance )
+150% for 2021 year, 8% dd
+191% for all time, 32% dd
Disadvantages:
- Small number of trades
- Need to vary parameters for different coins (not very robust)
Should be tested carefully for other coins / stock market. Different parameters could be needed or even algo modifications.
Strategy doesn't repaint.

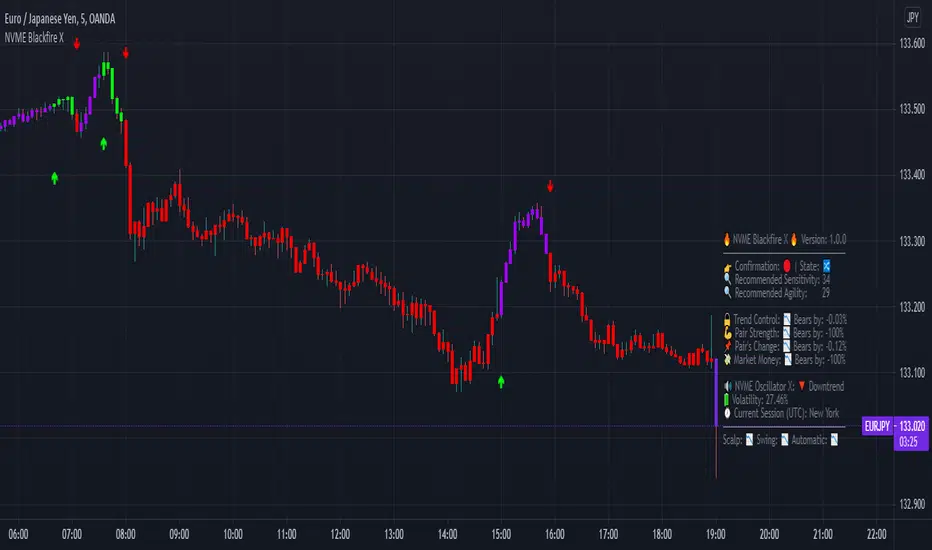
NVME Blackfire XNVME Blackfire X Indicator is a trend-confirmation indicator that includes Buy and Sell signals on the chart, Support & Resistance lines, Automatic Trendlines, Session Highs and Lows, Previous MTF Candle's Highs and Lows, Strategy Mode with Working Win/Loss Calculator, Built-In Position Size Calculator, Institutional Zones, Re-Entry Points and Filters, Customisable Market Dashboard and Alerts for Many Features.
The 2 main settings for the algorithm are 'Sensitivity' and 'Agility'. When you place Blackfire X onto your charts, you should be met automatically with the best settings we've found so far and don't worry if you are struggling to find settings because our system has an onboard system that provides you with an automatic "Best Settings" for the current pair that you are on. You can choose to enable this feature on the algorithm settings or simply see what is ideal on the dashboard too.
The 'Sensitivity' controls how quickly the algorithm responds to the market's trend changes. The higher the sensitivity, the less trades on the chart. The lower the sensitivity, the more trades you'll find on the chart.
The 'Agility' controls where the signals are placed within the trend change, a lower agility will give you signals closer to its reversal points and a higher agility will give you slower signals.
We also have the option to change the indicator to your trading style, there are four modes that heavily impacts the algorithm's calculations.
These are "default", "swing mode", "scalp mode", "strategy mode".
"Default" is our normal algorithm module that utilises the user's input to provide signals using a basic filtration system.
"Swing Mode" is our algorithm that has been modified to give signals that are more delayed for swing traders.
"Scalp Mode" is our algorithm that has been modified to give signals that are quick and fast for scalps.
"Strategy Mode" utilises our default mode but instead places the user in a mode where trades will only appear if a stop loss or a take profit area has been met by the price after the signal call.
Our third key option is our bar colour switches, there are multiple options such as "Cloud-Based", "Pivot Based", "S/R Based", "Change-Based" and "Two Colour Modes". NVME Blackfire X colours the candles in the direction of the trend and a green colour shows an uptrend, a purple colour shows an unconfirmed trend or often a ranging area and a red colour shows a downtrend.
We must let traders know that the signals should be used carefully and with a trader's strategy rather than following signals for the sake of it being printed there!
Since we want this algorithm to have necessary features and respond fast too, we have chosen only trend-following and analysis features that will be quick to use and easy to understand. We want this to be different from our Vanquisher X algorithm as that is a massive multi-tool full of features for traders to enjoy.
The first main feature is our 'Trend Cloud' system, it utilises two moving average plots that creates a cloud filling and with our algorithm you can customise both of the moving averages to any currently existing moving average in the PineScript Library.
The second feature is our 'Institutional Zones' system, which plots area of the market where the institutions have placed orders and these can be used as an extra support and resistance zone for trades. There is an input option that allows the user to get more or less zones and it is called "The Detection Strength", increasing this will show more zones whilst decreasing it will show less.
The third feature is our 'Automatic Trendlines' system, which utilises two input methods ('Trendline Period' and 'Trendline Detection Ratio'), the period controls how many bars of data to lookback to for the trend-lines and the detection ratio controls how many trend-lines are plotted onto the chart.
The fourth feature is our 'Session High and Lows' system, which plots the highest high and the lowest low of each session in the trading hours, these plots can be useful for breakout traders.
The fifth feature is our 'MTF Candle Info' system, which plots the candle's high and low or the candle's open and close for a timeframe and the previous candle of choice. This can also be used for breakout traders such as having a lower timeframe breakout for a higher timeframe plot.
The sixth feature is our 'Adaptive S/R Zones', which plots support and resistance zones into any market pair that are accurate points at which the market could react and reject from.
* Informative Market Dashboard *
Our simple panel on your chart displays the most relevant data from all of our features and calculations in real-time.
Confirmation
The confirmation simply tells the user what the previous signal was and this can be useful if the user may decide to have their signals turned off on the charts.
Market State
The market state informs the user the direction of the trend whether it be ranging, in an uptrend or downtrend, you'll see the emoji that corresponds to that.
Recommended Sensitivity
This feature will show the user what the recommended sensitivity is for the current pair that the user is on and the user may find this helpful if they don't know what settings to use.
Recommended Agility
This feature will show the user what the recommended agility is for the current pair that the user is on and the user may find this helpful if they don't know what settings to use.
Trend Control
The trend control feature calculates data using the user set bars back input and it determines all the factors within the trend to give you an informative response, an uptrend will have "Bulls by: " + percentage of control and a downtrend will have "Bears by" + percentage of control.
Pair Strength
The pair strength is measures the control of bulls or bears in the form of the market strength and it will give the same response as the trend control but the percentage will be based on the buying or selling pressure.
Pair's Change
The pairs change measures the change in price from point A to point B, if the change is greater than 0%, the dashboard will inform you that Bulls are in control, and if not the dashboard will inform you that Bears are in control.
Market Money
The market money measures the amount of volume and money that is going into the current asset and if the net change is greater than 0%, bulls will be in control, if not then bears are giving the market their money.
NVME Oscillator X
This is our very own oscillator that has been integrated into our dashboard, allowing the user to see the trend of our other indicator without having to fill their charts up with more noise. If the oscillator is in a downtrend then the dashboard will state that its in a downtrend and if it is in an uptrend then it will show an uptrend text.
Volatility
This feature measures the amount of volatility in any pair and provides user with the percentage value so they can see whether or not the market is extremely volatile at the current time.
Current Session
This feature will tell the user what session they are currently on such as London, Europe, New York, Asia, Australia.
MechaOscillatorWhat is MechaOscillator?
MechaOscillator was created as a companion to our main script MechaAlgo. Using MechaOscillator along with MechaAlgo will allow you to boost your overall understanding of any market, and make more informed decisions as a trader.
Feature List
Built-In Improved WaveTrend Oscillator
Buy & Sell Signals
Bullish and Bearish Divergences
Short and Long Term Trend Indicators
Trend Strength Indicator
Market State Indicator
Real Time Informational Dashboard
Bullish and Bearish Breakout Indicator
Many More Features to Come!
By using this script you acknowledge that MechaOscillator cannot guarantee you profit, and that this product was only created in attempt to benefit traders. You also acknowledge that past performance is not indicative of future results, and that the experience of other users or what you see online may not always be your experience.

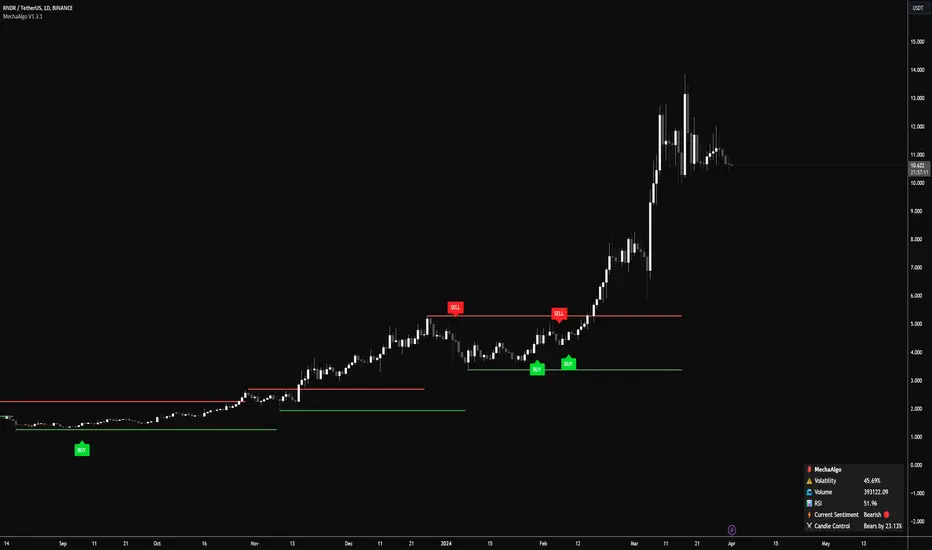
MechaAlgoWhat is MechaAlgo?
MechaAlgo was created to assist any type of trader on a day to day basis. Our intelligent and accurate algorithms turn complex charts into profitable plays, minimizing losses and maximizing profits. We hope that you will find use in the tools and resources we provide, and we will continue to improve on our products in order to take your trading to new heights!
Any Time, Any Market
Our indicators work with real time data on any market. This means that any kind of trader will find our tools useful, regardless of what you are trading.
Feature List
Multiple Signal Modes
Numerous Candle Coloring Modes
Reversal Cloud Overlay
Auto Support & Resistance
Auto Trendlines
Auto Profit Targets
Real Time Informational Dashboard
Multi-Timeframe Trend Panel
Future Trend Projection
Many More Features to Come!
By using this script you acknowledge that MechaAlgo cannot guarantee you profit, and that this product was only created in attempt to benefit traders. You also acknowledge that past performance is not indicative of future results, and that the experience of other users or what you see online may not always be your experience.
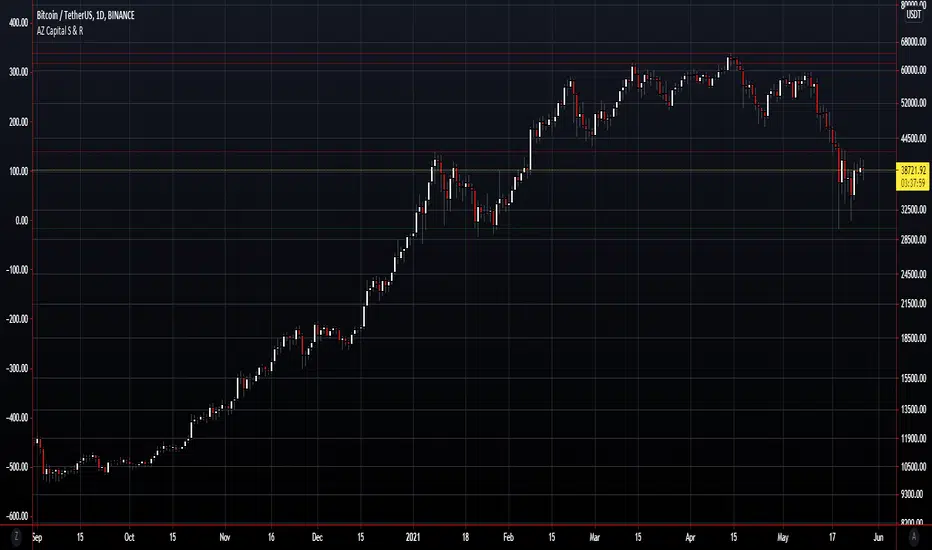
AZ Capital S & ROverview
The algorithm endeavours to robotize the identification of support and resistance levels by recognizing enormous swings/turns in authentic value activity.
These tops and bottoms in value activity shows where the bunches of buyers or sellers came into the market and may go about as future degrees of support or resistance.
The code identifies the last 3 huge swing highs and the last 3 swing lows. It at that point places lines on the outline to feature those levels.
In support and resistance hypothesis, frequently the support becomes resistance and the other way around. Along these lines, the algorithm doesn't just sort swings lows as "support" and swing highs as "resistance". All things considered, the algorithm takes a gander at the swing position comparative with the current close cost.
In the event that the price is over the level, the algorithm thinks of it as support. On the off chance that the price is beneath the level, the algorithm believes it to be resistance.
In light of this, the lines are naturally shaded by whether the prices are above or beneath the current close cost. At the point when any of the levels are beneath the nearby value, the lines are shaded green. Then again, at whatever point they are over the nearby, they are shaded red.
NVME Vanquisher X"Enter with precision, focus on the mission, dismiss the indecision, support NVME's vision" ~ That is what the Vanquisher X will provide.
One may ask, what is so unique about it compared to other algorithms?
We have our own calculation module and strategy that uses other indicators and maths to determine the next location of the trend and with our algorithm you can have full customisation of all the features we have. You can change the overall colour scheme of every single plot within the indicator, you can change the algorithms sensitivity and scalar to as many different numbers as possible, there are helpful drawings, trend confirming drawings, pullback drawings, pair mark-ups, custom dashboards and much more. Our settings panel is also simple and easy to use providing you with different appropriately named subsections for each feature and there are tooltips to let you know what each tab or input does. So, traders if that doesn't get you hooked then keeping reading!
Traders commonly struggle to decide whether or not to enter a trade, hold a trade, stop a trade or take profit and that is what makes us different. You stop when you see the opposite signal or a change in candle colour, you can follow our automatic TP and SL levels for trade goals and you enter when a signal meets your analysis.
NVME Vanquisher X is to be used as confluence with your analysis or trading style and should not in anyway shape or form be used as a indication to buy or sell just because the signal says so, it is there to give you a higher chance of having a high probability trade though past results is not indicative of future results and getting access doesn't mean you will become a millionaire in a day as it is not a get rich quick indicator so it won't guarantee 100% success.
What is your goal?
Our goal is to give you traders an edge in trading, whether it be for stocks, indices, cryptos, forex, commodities, futures and altcoins, all assets are supported and we want to make the best of every trader with NVME.
Recommended Timeframes:
15 Minutes, 1 Hour, 4 Hour with our settings of 2 or 3 sensitivity and 144 on the algo scalar.
Does it support all chart types?
Yes, all charts supported, however we recommend Heikin-Ashi as an optimal choice for trading but if you are already experienced with something else then you can use that :)
Screenshots:
Features:
/Trend Confirming Drawings:
-200 EMA (Added so that free users don't have to waste 1 indicator space)
-Trend Cloud (Colour switches from negative to positive depending on the trend and the cloud has a low fill opacity)
-Confirmation Highlight (Highlights the background with a positive or negative colour depending on the trend identified)
-Following Highlight (Unique highlighting to the background that shows either a positive or negative colour based on the trend however it doesn't identify ranging markets)
//Combinations//
-TC+EMA, EMA+Highlight, Cloud+Highlight, FH+EMA, FH+CLOUD, All v1 (EMA+CLOUD+CH), All v2 (EMA+CLOUD+FH)
/Helpful Drawings:
-Predictive Channel (Using candle maths, this will plot a price following linear regression channel that can be useful for breakout trading or using as support and resistance)
-Predictive S/R (Using candle maths and validation, this will plot support and resistance zones across the market to show you different areas where price could reject or reverse)
-Predictive Trend-Lines (Using candle maths and EMA, this will plot a trend-line in the direction of the trend and this can be useful for breakout trading or following the trend)
-Predictive Supply and Demand Highlight (Using other indicators, this will plot a highlight filled plot that will outline areas of supply and demand, which can be useful for support and resistance trading)
-Previous Order Blocks (Using candle maths, validation and confirmation latency, this will plot filled in squares of potential orders blocks from the past so they can be used for future reference in analysis)
-Predictive ZigZag (Using candle maths, this will plot a price following line that forms a zig zag pattern to show if the market is going in a higher high and higher low formation or lower low and lower high formation)
-Predictive Pivot-Points (Using candle maths and higher-timeframe data, this will plot pivot zones up to support 5 and resistance 5 with midpoints for every section there is)
/Pullback Drawings:
-EMA Pullback (Added so that free users don't have to waste 1 indicator space)
-Bollinger Heatbands (Using the Bollinger Bands indicator, we have created a price following support and resistance heat-map that shows you the whereabouts of the dynamic support and resistance that is indicator based)
-EMA+HB (This combines the ema and the heatbands)
-Fib Retracements (This feature will automatically plot a fibonacci retracement based off predictive market data and our own optimal settings so that you don't need to change them)
/Pair Mark-Ups:
-Weekly Info (This will show you the previous lows and high of the weekly candle and using an ATR, we have added potential reversal zones in those areas and we have a midpoint too)
-Daily Info (Same as the weekly info but for the daily timeframe)
-4 Hr Info (Same as the weekly info but for the 4 hourly timeframe)
/Colour Schemes:
-Default (Strong green, dark purple, strong red)
-Blue and Orange
-Strawberry and Lime
-Apple and Mango
-Orange Passionfruit
-Rhubarb and Custard
-Black and White
-Forest Greens
-Galaxy
-No Colour Scheme (removes the preset colours so they are the same as your TradingView bar settings)
-Show ATR TP and SL levels (This will plot 4 lines, 3 lines are the take profit levels, and the 4th line is the stop loss line, since it is atr based it may fluctuate the distance between each line indicating possible liquidity)
/Dashboard Settings
-High (Will place the dashboard's Y position to follow the high of the price)
-Middle (Will place the dashboard's Y position to the difference of the lowest low and highest high)
-Forced Middle (Will place the dashboard's Y position to the difference of the lowest low further back and highest high further back)
-Low (Will place the dashboard's Y position to follow the low of the price)
-No Dashboard (Deletes the dashboard from the charts)
-Dashboard's X position (Input field, this will change the X value, the higher it is the further away it is from price and the lower it is the closer the dashboard is towards price)
/Dashboard W/R Goals:
-Adaptive (Randomly chooses a strategy follow, can be highly inaccurate, and when price hits tp 1 it will add a win and if it hits sl it will count as a loss)
-5 Pips to 5 Pips (This will change the calculator to only add values for this set condition and this won't be strategy based but instead signal based)
-5 Pips to 10 Pips (1:2 Risk Reward)
-10 Pips to 20 Pips (1:2 Risk Reward, Higher Stop and TP)
-10 Pips to 30 Pips (1:3 Risk Reward, Higher Stop and TP)
-20 Pips to 40 Pips (1:2 Risk Reward, Higher Stop and TP)
/Dashboard Add-ons:
-MTF Trends (This will add more text onto the dashboard and this will show you the trends of the higher timeframes)
-EMA (This will show you the EMA trends on the dashboard)
-VWMA (This will show you the VWMA trends on the dashboard)
-HMA (This will show you the HMA trends on the dashboard)
-Text Colour (This is a colour input and this allows you to change the colour of the dashboard to anything you like)
/Customisable Alerts:
-Buy Alerts (This will allow buy alerts to be sent through any TradingView notifications)
-Sell Alerts (This will allow sell alerts to be sent through any TradingView notifications)
-Range to Uptrend (May be buggy, this will send an alert if the colour goes from undecided to an uptrend colour (positive colour))
-Range to Downtrend (May be buggy, this will send an alert if the colour goes from undecided to a downtrend colour (negative colour))
-Previous Bullish Order Block (This will send an alert if a previous bullish order block has been printed to help with your analysis)
-Previous Bearish Order Block (This will send an alert if a previous bearish order block has been printed to help with your analysis)

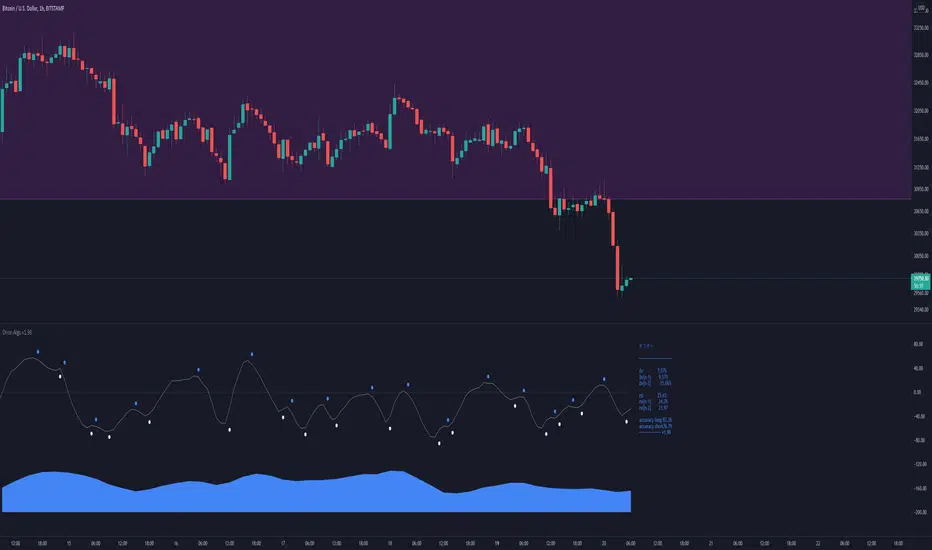
Orion AlgoOrion Algo is a next-gen trading algorithm designed to help traders find the highs and lows of the market before, during, and after they happen. We wanted to give an indicator to people that was simple to use. In fact we created the algorithm in such a way that it currently only needs a single input from the user. Since no indicator can predict the market perfectly, Orion should be used as just another tool (although quite a sharp one) for you to trade with. Fundamental knowledge of price action and TA should be used with Orion Algo.
Being an oscillator, Orion currently has a bias towards market volatility. So you will want to be trading markets over 30% volatility. We have plans to develop future versions that take this into account and adjust automatically for dead conditions. Also, while there are some similarities across all oscillators, what sets ours apart is the prediction curve. The prediction curve looks at the current signal values and gives it a relative score to approximate tops and bottoms 1-2 bars ahead of the signal curve. We also designed a velocity curve that attempts to predict the signal curve 2+ bars ahead. You can find the relative change in velocity in the Info panel. The bottom momentum wave is based on the signal curve and helps find overall market direction of higher time-frames while in a lower one.
Future Roadmap:
Create secondary on-bar indicator to pair with Orion Algo
Automatically adjust internal variables based on market volatility
Indicator style selection
Simple Strategy:
1. Start at a high time-frame to get an overview of the market you are wanting to enter. Daily is usually a good starting time.
2. If you can, add Orion to a second chart with a lower time-frame such as 4H.
3. Check the lower time frame to find potential medium term entry points based on where the trend was heading from the higher time-frame.
4. Step even lower to the 1H to find your optimal entry based on the higher times and technical analysis of the charts (support/resistance, patterns, etc)
5. The momentum wave can be used to find overall trend of the market. When it starts curving up, the market is bullish. When it curves down, the market could be bearish.
Intermediate Strategy:
1. Use simple strategy first.
2. Use the Prediction and ∆v curves to see future reversals in the works.
3. You can use these curves as potential entries as well as exit points.
4. Take into account potential divergence of the signal lines and price action.
Settings and How to Use them:
User Agreement – Orion Algo is a tool for you to use while trading. We aren’t responsible for losses OR the gains you make with it. By clicking the checkbox on the left you are agreeing to the terms.
Super Smooth – Smooths the main signal line based on the value inside the box. Lower values shift the pivot points to the left but also make things more noisy. Higher values move things to the right making it lag a bit more while creating a smoother signal. 8 is a good value to start with.
Theme – Changes the color scheme of Orion.
Info – Turns on a dashboard with useful stats, such as Delta v, Volatility, Rsi, etc. Changing the value box will move the dashboard left and right.
Pivots – Toggles main bull/bear dots.
Prediction – A secondary prediction model that attempts to predict a reversal before it happens (0-2bars). This can be noisy some times so make your best judgement. Curve will toggle a curve view of the prediction. Pivots will toggle bull/bear dots.
∆v – Delta v (change in velocity). This shows momentum of the signal. Crossing 0 signals a reversal. If you see the delta v changing direction, it may signify a reversal in the several bars depending on the overall momentum of the market.
Divergence – Toggles divergence lines. Hidden will show hidden divergences. Cross will show divergences that cross the 0 line.
Momentum Wave – Uses the signal as a macro trend indicator. Changes in direction of the wave can signify macro changes in the market. Average will toggle an averaging algorithm of the momentum waves and makes it easy to understand.
OBOS – Overbought/Oversold lines. Dyn will convert them to dynamic OBOS lines. The value box will adjust the smoothing.
TV Community AlgoTV Community Algo is a free TradingView script that I designed from the ground to benefit the traders of this community. It has plenty of features that you will enjoy, and I have included documentation for how to use this below!
Settings:
Basic:
Turn the Void Lines on or off
Turn the Dashboard on or off
Turn the Signal Bars on or off
Turn the Support & Resistance Lines on or off
Turn the EMA 8 and EMA 200 on or off
Turn the Buy & Sell Signals on or off
Turn the Fibonacci Retracement Tool on or off
Style:
Change the Dashboard's distance from the price action
Change the Dashboard's Color and Transparency
Change the Dashboard Text Color
Change the Fibonacci Deviation
Make the Fibonacci Retracement Tool reverse
Make the Fibonacci Lines extend left, right, both directions, or none
Turn Fibonacci Prices on or off
Turn Fibonacci Levels on or off and change between percent or value
Change Fibonacci Label Position from the left or the right
Usage:
This algo has many uses including but not limited to:
Finding entries and exits using the EMA 8 and EMA 200 crossovers
Using the Void Lines to identify bounces or reversals
Using the Signal Bars to identify trend and confirmation for entries and exits
Using the Dashboard information for confirmation and informational purposes
In the images below, I give a few examples of the many uses of the TV Community Algo!
VOID LINES
The Void Lines are very helpful when it comes to identifying reversals.
TV COMMUNITY ALGO DASHBOARD
The Dashboard is filled with useful information that all traders can benefit from!
SIGNAL BARS
The colored candles known as Signal Bars inform you of when the price action is above or below the midpoint of the Void Lines.
AUTO SUPPORT & RESISTANCE LINES
These lines help traders find accurate levels of support & resistance on all time frames, and the lines change color depending on if the price is above or below them.
EMA 8 AND 200
The EMA 8 and EMA 200 crossovers can be used as entry and exit signals.
BUY & SELL SIGNALS
The BUY & SELL signals can be used to find optimal entries and exits for trades on any time frame. Smaller time frames are best for scalping, while larger time frames are more suited for longer trades. When combined with the EMA lines and Dashboard information, these signals can produce incredibly profitable trades.
AUTO FIBONACCI RETRACEMENT TOOL
The Auto Fibonacci Retracement Tool allows you to plot perfect Fib Lines every time.
Conclusion:
I truly hope that the TV Community Algo benefits the TradingView community and that you all find some value in it. I worked very hard on this product and I would love to see it put to good use.
with love,
-Lemon 🍋
This work is licensed under a Attribution-NonCommercial-ShareAlike 4.0 International (CC BY-NC-SA 4.0) creativecommons.org

hamster-bot PDD Pump and Dump DetectorPump and Dump detector by hamster-bot
strategy author: foresterufa
Pump and Dump detector (PDD)
This is a trend strategy, with a unique mechanism of multi-stage re-entry into a position (Take Profit-Entry) when a significant trend develops, based on our HiDeep indicator.
Positions are opened by the HiDeep indicator signal with trend direction filtering and volatility filtering. Positions are closed by a HiDeep indicator signal or a change in the trend direction.
The position can be accompanied by a unique Stoploss trailing MA.

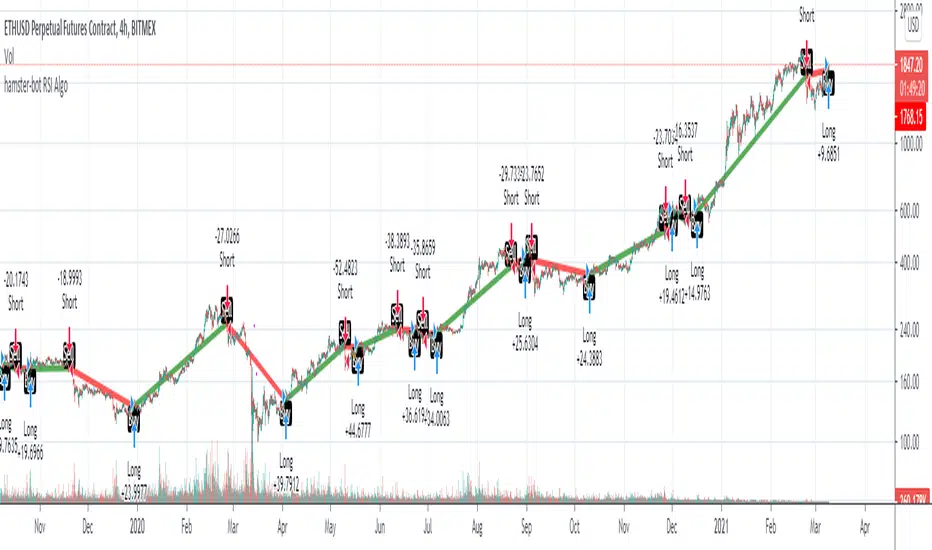
hamster-bot RSI AlgoThis is a simple RSI based signal indicator. It is designed for algorithmic bot trading.
For best results, leave a time-frame of at least 1 hour.
When the RSI reaches 70, it gives a buy signal, and when the RSI reaches 30, it gives a sell signal. The position is then maintained until the opposite signal is given. If backtesting shows poor results, but looks like the opposite would be good, there is a simple switch in the settings to turn it over.
original indicator on the basis of which the strategy is made:
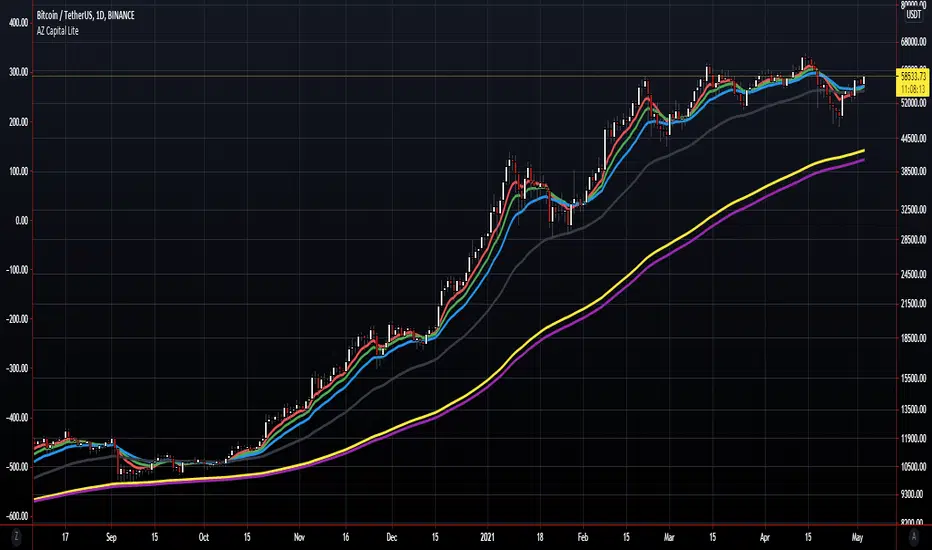
AZ Capital Lite 2.0
AZ Capital Lite 2.0 is the Updated Version of our Previous Lite Version of our trading algorithm/indicator. This algorithm is once again based on different indicators such as RSI and a combination of MA's along with ATR. Custom values that provide assistance to our PRO trading algorithm helping concluding analysis and finalising a trade even better.
AZ Capital Lite 2.0 combines various default indicators with custom values into One simple algorithm that helps the user to assess if an asset is moving upward or downwards.
AZ Capital Lite 2.0 works perfectly along with our AZ Capital PRO algorithm/indicator and helps the user to finalise the movement of an asset.
For Past Performances of this Algorithm/Indicator, Contact me Privately!
If you have any doubts on how to use the Algorithm/Indicator, Contact me Privately!
Commenting is RESTRICTED to only Comments about the Algorithm/Indicator and NOT asking for HOW-TO's and ACCESS!
Always DYOR and Trade Safely!
Regards,
Azyad (Founder of AZ Capital)

LordPepe Stochastic SignalsThis is the Lord Pepe. Howdy. Basic buy/sell indicator to accumulate along a downtrend and release your stack during the uptrend and oversold levels of the stochastic. The buys should be used to stack, and sells indicate levels of profit taking, they do not signal a long term reversal, only < 25% of stack should be released on "OB" signals.
OB - overbought (sell)
OS - oversold (buy)
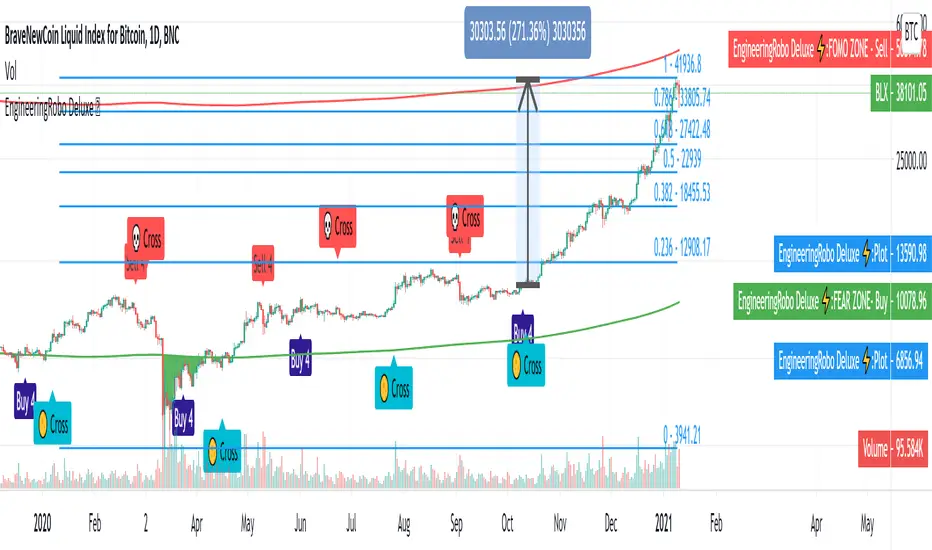
EngineeringRobo DeluxeToday we are releasing the EngineeringRobo Deluxe!
New advanced trading tools for traders and investors. The new Robo 4 is extremely powerful !
It works perfectly with other existing strategies as an add-on feature. EngineeringRobo Deluxe has seen major improvements in accuracy of levels, speed and intelligence to detect the best possible trade setups.
This script is equipped with
🔵 EngineeringRobo 4
It offers strategic trading entry and exit points, so you can preserve capital before markets tumble, and take full advantage as they start to rebound. At a glance, market timing indicators tell investors whether market conditions are right or whether it’s safer on the sideline.
Truly unique tool for technical analysis for the financial market as it includes calculation of specific metrics like SAR + MACD + Price Movement.
You no longer have to worry about spending hours in front of the computer looking for a trade.You can use the indicator on every assets available on your broker.
🔵 Change Candle Color
You can change the colors depending on buy 4 and sell 4 signals. It helps traders a lot to see the direction clearly.
🔵 BB Signals :
This strategy uses the MACD indicator together with the Bollinger Bands to sell when the price is above the upper Bollinger Band (and to buy when this value is below the lower band). This simple strategy only triggers when both the MACD and the Bollinger Band indicators are at the same time in a overbought or oversold condition.
Removed Upper & Lower bands & SMA20 from the charts.
To see bands, You can activate the Bollinger Bands on EngineeringRobo - not the Deluxe version.
If you are buying it with BB BUY, No need to wait for BB Sell to sell it. Vice versa.
They are not the opposite to each other. Get your profit at your target level and move on.
🔵 Ultimate MA crossover signals :
As a general guideline,the idea behind trading crossovers is that a short-term moving average above a long-term moving average is an indicator of upward momentum in a stock & crypto , and the opposite is true about a short-term average trading below a long-term average.
For this guideline to be of use, the moving average should have provided insights into trends and trend changes in the past.
Are the settings of SMA 50 & SMA 200 really the best for Golden Cross and Death Cross?
Have you ever tested ROI for MA cross strategies?
Do you think MA 20 and MA 50 are the best pair for traders?
Do you know that Exponential Moving Average ( EMA ) beats the Simple Moving Average ( SMA ) ?
In order to answer these questions we applied some brute mathematical force and tested 1830 different MA combination to find out the best pair through 50 years of data across stock / forex and 5 years of data across crypto markets . We have done the hard work and you get the benefits .
P.S. The oldest date is 1872 on SPCFD:SPX chart on tradingview . Almost 150 years of backtesting is possible from 1872 to 2020!
🔵 Cloud Signals :
This is a strategy made from ichimoku cloud , together with MACD . Changed Ichimoku cloud formula. Based on that we have a long or a short entry.
it is an effective strategy when paired with a trailing stop loss. Removed standard line ( Kijun Sen ), turning line ( Tenkan Sen ), lagging line ( Chikou Span ) and senkou lines, added buy & sell signals. Traders can use EngineeringRobo's cloud to see the clouds on the chart.
This method doesn't work in sideways markets, only in volatile trending markets.
🔵 EMA TrendLines & Custom Moving Average :
Moving averages help traders isolate the trend in a security or market, or the lack of one, and can also signal when a trend may be reversing. Two of the most common types are simple and exponential. We will look at the differences between these two moving averages, helping traders determine which one to use. Simple moving averages and the more complex exponential moving averages help visualize the trend by smoothing out price movements.
Each trader must decide which MA is better for his or her particular strategy. Many shorter-term traders use EMAs because they want to be alerted as soon as the price is moving the other way. Longer-term traders tend to rely on SMAs since these investors aren't rushing to act and prefer to be less actively engaged in their trades.
🟠50 And 200 Day Moving Average Rules
Trend reversal (downtrend to uptrend) - MA 50 crossover MA 200 from below.
Trend reversal (uptrend to downtrend) - MA 50 crossover MA 200 from above.
Weekly open –close above MA 20 ( bullish trend )
Weekly open –close below MA 50 ( Bearish trend )
Super Bullish : The candle is above MA 20 ( Daily )
Bullish : MA 50 Above MA 100 ( Daily )
Bearish : MA 50 below MA 100 ( Daily )
🔵 Fear & Greed Index
This strategy uses two unique EMA indicators in the formula.
1. Use the indicator to identify when investors are greedy.
2. Use the indicator to identify potential bottom levels
For best testing example:
Open BLX Chart, pick 1D time frame, open only FEAR & Greed Index
🟢Green Area : Ready to buy a lot of cryptocurrencies
🔴Red Area : Ready to sell a lot of cryptocurrencies
Price crosses above red line = Entering overbought zone
Price crosses below red line = Exiting overbought zone
Price crosses below green line = Entering oversold zone
Price crosses above green line = Exiting oversold zone
🔵 Automated Trend Channel Lines
It’s 2020 and you are still drawing lines?
The automated trend lines helps you find the best trend lines and you can stop re-drawing over and over. You don't need to flip back and forth between different timeframes. You can let your robo advisor do the work for you.
🔵 Dynamic Support and Resistance Levels
On the most fundamental level, support and resistance are simple concepts. The price finds a level that it’s unable to break through, with this level acting as a barrier of some sort. In the case of support, price finds a “floor,” while in the case of resistance, it finds a “ceiling.”
Basically, you could think of support as a zone of demand and resistance as a zone of supply.
While more traditionally, support and resistance are indicated as lines, the real-world cases are usually not as precise. Bear in mind; the markets aren’t driven by some physical law that prevents them from breaching a specific level. This is why it may be more beneficial to think of support and resistance as areas. You can think of these areas as ranges on a price chart that will likely drive increased activity from traders.
🔵 Automated Fibonacci Retracements
Automatic Fibonacci let you replace subjective manual analysis with objective automated analysis so you always get the best Fibonacci levels, this can really improve the quality of your trading decisions.
Fibonacci retracements are often used to identify the end of a correction or a counter-trend bounce. Corrections and counter-trend bounces often retrace a portion of the prior move. While short 23.6% retracements do occur, the 38.2-61.8% zone covers the most possibilities (with 50% in the middle). This zone may seem big, but it is just a reversal alert zone. One of the best ways to use the Fibonacci retracement tool is to spot potential support and resistance levels and see if they line up with Fibonacci retracement levels.
Even though Fibonacci levels are extremely popular among technical traders, one should not rely solely on Fibonacci retracement and extension levels in trading. Fibonacci tools return the best results when combined with other technical tools, such as trendlines , chart patterns, candlestick patterns, channels or technical indicators.
If you are following any EngineeringRobo Deluxe signals, you should always wait for the candle close before buying or selling.
The signal can come and go anytime during the live candle. ALL indicators do that, that is not considered repainting.
Repainting is when a signal appears, the candle is closed, and when you refresh the chart it disappeared. It is logical that until the candle is closed the signal is not decided yet, hence the alert setup as Once per bar Close.
Deluxe never repaints! Yes, you heard it right: you will never have to worry about signal changing after the candle is closed.
*** Added alarm system alerts for all signals.
________________________________________________________________________ Timeframes _____________________________________________________________________
Our recommendations to get the best results:
Swing Trading Crypto : Use 1D Time Frame Candles
Swing Trading Stocks : Use 1W Time Frame Candles
Swing Trading Commodities : Use 1W Time Frame Candles
Day Trading Crypto : Use 3H Time Frame Candles
Day Trading Stocks : Use 1D Time Frame Candles
Day Trading Commodities : Use 1D Time Frame Candles
Not recommended any other time frames.
What Is Risk-Reward Ratio RRR?
Your risk-reward ratio is how much you risk per trade, relative to how much you expect to make (reward).
When trading with Robo , you should always aim for a bigger reward compared to your risk per trade.
A good rule is only to risk 1% per trade for day traders and 5% per trade for swing trader . Robo follows strong risk management rules on the algorithm .
One of the biggest advantages of algo trading is removing human emotion from the financial markets,humans trading are susceptible to emotions that lead to irrational decisions. Robo doesn't have to think or feel good to make a trade. If conditions are met, it enters.When the trade goes the wrong way or hits a profit target, It exits. It doesn't get angry at the market or feel invincible after making a few good trades.
EngineeringRobo gives you all the tools and information you need for day-to-day trading and investing, while also keeping a great buy and sell signals! No excuse to lose in any financial market anymore! Try now!
How can you add the algorithm into your chart?
1. Login to TradingView.com
2. From the homepage, click on ‘Chart’ in the top navigation bar
3. Select “Indicators” on the top-center-middle panel
4. In the indicator library, type "EngineeringRobo Deluxe "
5. Use the website link below to obtain access to this indicator
The indicator will be added to your chart after It is approved.
function: Array DownsamplingA low cost function to down sample a array.
specially useful for pattern recognition algorithms.

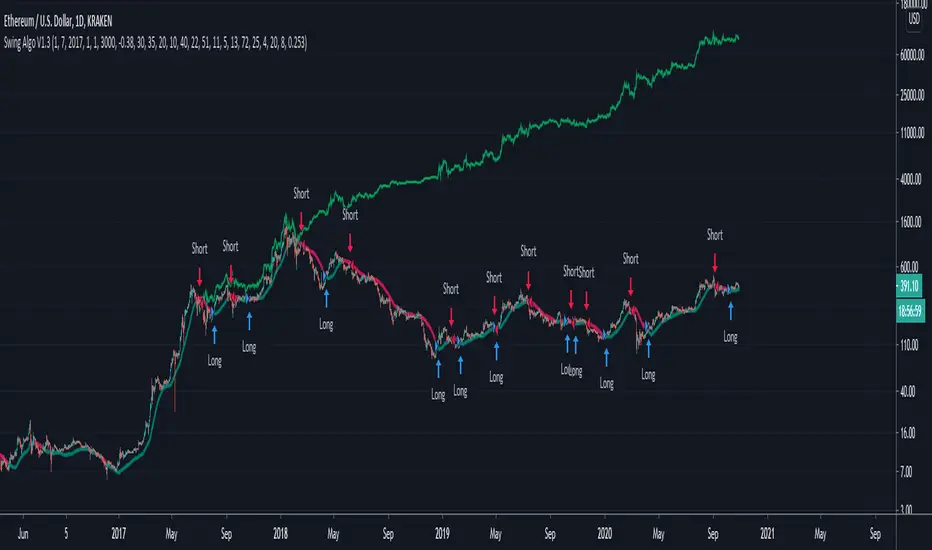
Swing Algo V1.3An upgrade of Swing Algo V1.2 to reduce chop heavily, used for trading ETH. For differences to other versions, see below.
This indicator can be used for e.g. swing algorithmic trading. It will give Buy/Long and Sell/Short signals on the chart. This algorithm uses a combination of several (custom) functions and rules to find good entry points for trend trading. After many iterations and tests I came up with this particular setup, which is highly optimized for the ETH/USD trading pair on the daily (D) timeframe. Attention was also paid to stability, as all parameters are set onto plateaus, so that smaller changes in the characteristic price action should not affect the efficiancy too much. For other assets and/or timeframes it is however possible to change algorithmic parameters within the indicator settings to tune this swing algorithm. You don't need any programming skills or similar abilities to navigate this indicator.
For the here presented backtest data, we omitted the biggest portion of the cryptocurrency bullrun in 2017 (starting only at 1st July 2017) so that the results become more realistic for long-term swing traders (investing at least 2-3 years into trading) if such large runs do not happen again. As cryptocurrencies like Ethereum are still to this date capable of doing comparatively smaller runs of about 2-3x in a few weeks/months (as witnessed in 2020), the order of magnitude of the shown results is still realistic for long-term trend trading efforts. Do not expect these results in a matter of days or weeks, and of course as with any trading strategy past performances are not indicative of future results.
Within this indicator you can choose the backtest time interval to test the perfomance of this algorithm for different time windows and different trading pairs. Here various backtesting parameters (e.g. trading fees) can be customized. Default settings for the shown backtest are a starting balance of $1000, a slippage of 2 ticks (= $0.02) and a trading fee of 0.26 % (which is the worst taker fee on the Kraken exchange) to have realistic settings. However as we do not conduct many trades with this strategy, fees should not impact our performance too much. As long-term swing traders, we devote one initial portion of our portfolio to swing trading and from then on always use 100% of this portion for the next trade to get the compounding starting. This is in difference to other trading styles which use various, often very small, percentage values for their short- or mid-term trades. Keep this in mind when evaluating the backtest data. Also note that due to the small number of trades the statistical significance is low. It is not possible to gather an abundance of long-term trend signals in the order of hundreds or thousands trades, as much more time would have to pass for this in the case of rather new assets like Ethereum.
Additionally to the TradingView Strategy Tester you can also plot your equity directly on the chart to get a sense for the performance. For this you can also scale the equity graph to e.g. match the starting point of your equity with some price point on the chart to get a direct comparison to 'Buy & Hold' strategies over time.
This indicator (and all other content I provide) is no financial advice. If you use this indicator you agree to my Terms and Conditions which can be found on my Twitter profile linked on my TradingView profile or in my signature.
Differences to other versions:
- Changed from a dual (V1, V1.1) to a single smoothing function system (V1.2, V1.3), which can react better to more sudden price movements that got prevalent during the current end-phase of the stock bullmarket due to correlations, while still handling 'normal' price action well
- Changed the oscillator part of the algorithm again with one that handles chop for the ETH/USD trading pair extremely well.
- Improved net profits by potentially +100% in comparison to V1 for ETH/USD on daily timeframe
- However for other assets (e.g. BTC and smaller coins like XTZ and ALGO) and timeframes V1 might perform better than V1.3 due to somewhat different characteristic price action. I leave you with all options to play so that you can find the best solution for a given trading pair.
- There's also a previous version called Swing Algo V1.2 considered the go-to algo at the moment, which works similar to V1.3, but operates a bit less tight, leading to more flexibility while suppressing chop not as much as V1.3.
For access please contact me via DM on TradingView or on Twitter (linked on my TradingView profile and my signature). People who purchased access to any 'Swing Algo 1.x' get access to all other 'Swing Algo V1.x' indicators automatically ('Swing Algo V1' counts as 'Swing Algo V1.0').
Swing Algo V1.2The next upgrade in the 'Swing Algo V1.x' series, and the go-to algorithm for trading ETH (until further notice). For differences to other versions, see below.
This indicator can be used for e.g. swing algorithmic trading. It will give Buy/Long and Sell/Short signals on the chart. This algorithm uses a combination of several (custom) functions and rules to find good entry points for trend trading. After many iterations and tests I came up with this particular setup, which is highly optimized for the ETH/USD trading pair on the daily (D) timeframe. Attention was also paid to stability, as all parameters are set onto plateaus, so that smaller changes in the characteristic price action should not affect the efficiancy too much. For other assets and/or timeframes it is however possible to change algorithmic parameters within the indicator settings to tune this swing algorithm. You don't need any programming skills or similar abilities to navigate this indicator.
For the here presented backtest data, we omitted the biggest portion of the cryptocurrency bullrun in 2017 (starting only at 1st July 2017) so that the results become more realistic for long-term swing traders (investing at least 2-3 years into trading) if such large runs do not happen again. As cryptocurrencies like Ethereum are still to this date capable of doing comparatively smaller runs of about 2-3x in a few weeks/months (as witnessed in 2020), the order of magnitude of the shown results is still realistic for long-term trend trading efforts. Do not expect these results in a matter of days or weeks, and of course as with any trading strategy past performances are not indicative of future results.
Within this indicator you can choose the backtest time interval to test the perfomance of this algorithm for different time windows and different trading pairs. Here various backtesting parameters (e.g. trading fees) can be customized. Default settings for the shown backtest are a starting balance of $1000, a slippage of 2 ticks (= $0.02) and a trading fee of 0.26 % (which is the worst taker fee on the Kraken exchange) to have realistic settings. However as we do not conduct many trades with this strategy, fees should not impact our performance too much. As long-term swing traders, we devote one initial portion of our portfolio to swing trading and from then on always use 100% of this portion for the next trade to get the compounding starting. This is in difference to other trading styles which use various, often very small, percentage values for their short- or mid-term trades. Keep this in mind when evaluating the backtest data. Also note that due to the small number of trades the statistical significance is low. It is not possible to gather an abundance of long-term trend signals in the order of hundreds or thousands trades, as much more time would have to pass for this in the case of rather new assets like Ethereum.
Additionally to the TradingView Strategy Tester you can also plot your equity directly on the chart to get a sense for the performance. For this you can also scale the equity graph to e.g. match the starting point of your equity with some price point on the chart to get a direct comparison to 'Buy & Hold' strategies over time.
This indicator (and all other content I provide) is no financial advice. If you use this indicator you agree to my Terms and Conditions which can be found on my Twitter profile linked on my TradingView profile or in my signature.
Differences to other versions:
- Changed from a dual (V1, V1.1) to a single smoothing function system (V1.2, V1.3), which can react better to more sudden price movements that got prevalent during the current end-phase of the stock bullmarket due to correlations, while still handling 'normal' price action well
- Changed the oscillator part of the algorithm with a better suited one (at least) for the ETH/USD trading pair, handling chop better.
- Improved net profits by potentially +100% in comparison to V1 for ETH/USD on daily timeframe
- However for other assets (e.g. BTC and smaller coins like XTZ and ALGO) and timeframes V1 might perform better than V1.2 due to somewhat different characteristic price action. I leave you with all options to play so that you can find the best solution for a given trading pair.
- There's also an upgrade called Swing Algo V1.3, which works similar to V1.2, but reduces losses due to chop even further. Because V1.2 is a bit more flexible, it is, however, considered the go-to algo for the time being.
For access please contact me via DM on TradingView or on Twitter (linked on my TradingView profile and my signature). People who purchased access to any 'Swing Algo 1.x' get access to all other 'Swing Algo V1.x' indicators automatically ('Swing Algo V1' counts as 'Swing Algo V1.0').

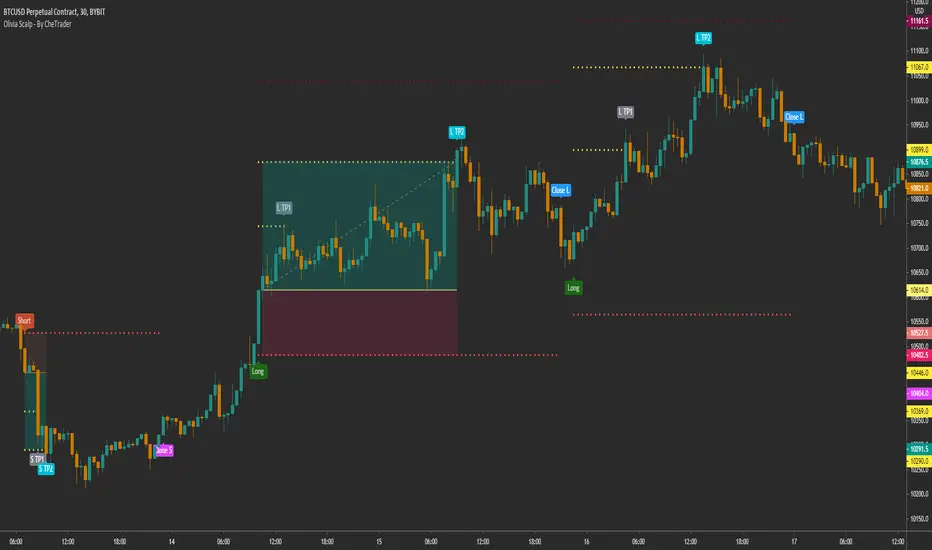
Olivia Scalp - By CheTrader
This is a complex strategy for Scalp that is fully configurable and can be automated
This script uses a combination of ma to detect the trend at a higher time frame, which can be defined by the user, as default set to 1D and 1M.
Triggers for long and short are given in a lower time frame, for example 30 minutes and are given by a combination of factors and oscillators. These include RSI, ADX, DMI
The script includes everything needed to follow the trade according to the habits of the trader.
This includes the option to use Take profit and Stop loss based on ATR that you can configure with the RR you like.
Similar to the risk-reward tool in tradingview.
You can also define a stop and take profit based on a percentage from the entry and also use a Trail stop, to finish the position when it is reached.
Each take profit and stop loss has a customized alarm so you can automate each action.
Also included is the option to use "advanced alerts"!
This is: You define how many seconds before you close the candle the alarm will be activated in TradingView. Very useful if you are going to automate, so that your alarm arrives just in time to your exchange.
Included:
Different trade entry options
Different forms of Take profit, included:
Take profit on squeeze candles
Take profit based on Risk-Benefit (RR)
Take profit a pre-determined %.
Different forms of Stop Loss, including
ATR-based stop loss
Trail stop loss (with option to use a trigger)
Stop loss a pre-determined %.
Contains a Risk Management section
May use a volatility filter
Statistics panel for backtest
Advanced alerts
As default is configured for BYBIT:BTCUSD 30 minutes
For access you can send a message or consult in my social networks.
Links in my tradingview signature (below).
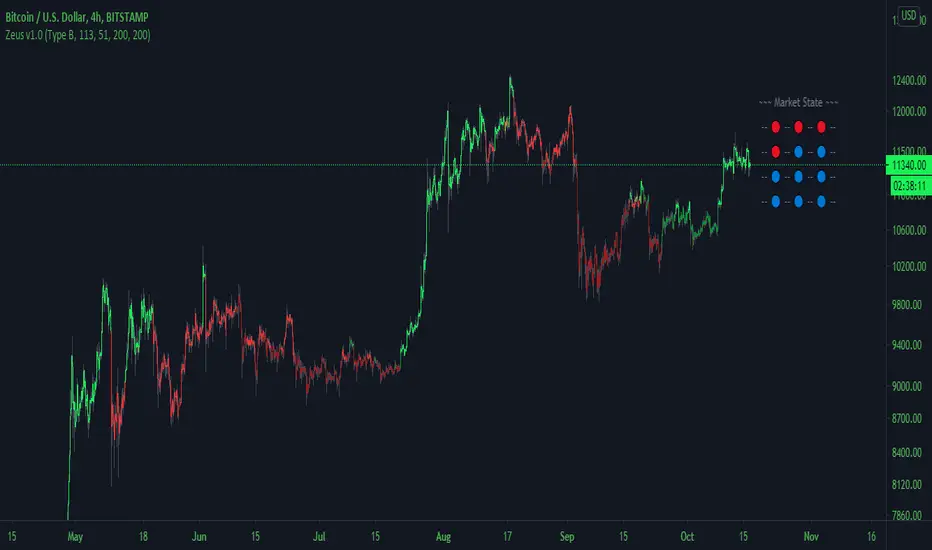
Zeus Trend DetectorAn exclusive trend detecting algorithm.
Contains the following addons, which can be activated or deactivated in the settings:
-- Zeus Cloud (Further Trend Analysis)
-- Market State Panel
-- Grey Indecision Zones
This is a premium script, that can be rented on a monthly basis.
PM if you are interested.
-Hawk
Optional Cloud Mode:
Compact Self-Adjusting Parabolic SARA custom version of the Self-Adjusting Parabolic SAR that can be used as a source for your trading frameworks and indicators.
It is presented on the preview as a -signal line that replicates Self-Adjusting Parabolic SAR state.
Here is an example of how it works with Buy/Sell/TP/SL/TSL Alerts Module :
If you have any questions don't hesitate to ask and contact me either via private messages on TradingView or via Telegram.

AZ Capital Lite
AZ Capital Lite is an additional feature of our AZ Capital PRO trading algorithm/indicator which is again based on different indicators such as RSI and EMA with custom values to provide assistance to our PRO trading algorithm helping in concluding analysis and finalising a trade.
RSI and EMA are two great indicators to access the movement of the asset and AZ Capital Lite makes those 2 different indicators into One simple indicator which helps the user to assess if an asset is moving upwards or downwards.
AZ Capital Lite also works along with our AZ Capital PRO algorithm/indicator helping to finalise the movement of an asset.
AZ Capital Lite is just using a customised and combined version of the regular EMA and RSI indicator available on TradingView.
For Past Performances of this Algorithm/Indicator, Contact me Privately!
If you have any doubts on how to use the Algorithm/Indicator, Contact me Privately!
Commenting is RESTRICTED to only Comments about the Algorithm/Indicator and NOT asking for HOW-TO's and ACCESS!
Always DYOR and Trade Safely!
Regards,
Azyad (Founder of AZ Capital)