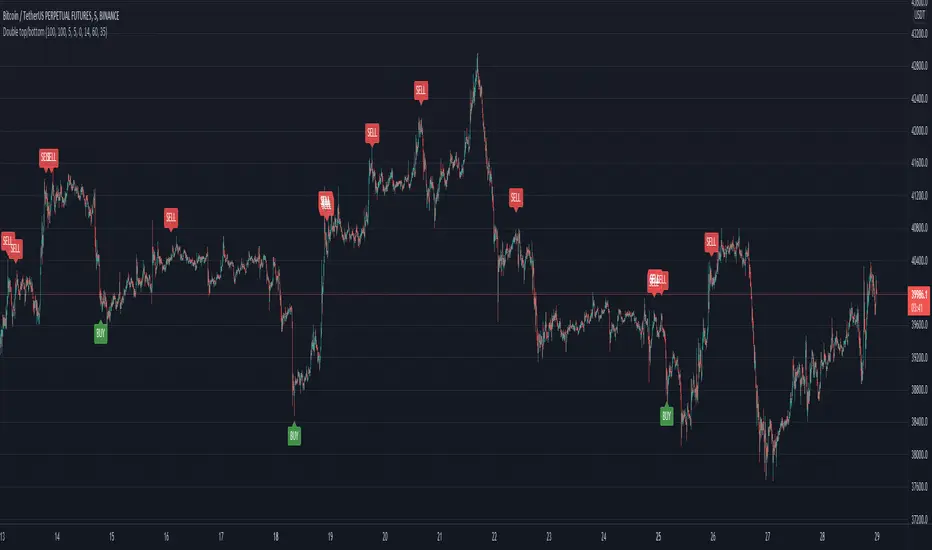
Double top/bottomHello!
This alerts is based on the double bottom pattern - for entering a long position / double top-short
A double bottom pattern is formed when two price bottoms are relatively at the same level and the top acts as resistance. This pattern appears at the end of a downtrend and signals a reversal.
A double top is a bearish reversal pattern that signals the end of an uptrend. It is formed by two price highs forming at the same level and a notch line that acts as local support.
As history and practice show, the double bottom pattern works better. Moreover, in a bull market.
// LOGIC ENTRY:
Period for short and long positions-to search for double bottom as well as double top . the more, the less false.
Change liong and short-channel width for pattern search separately for long and short.
General shift-the overall width of the channel, which changes equally at once for long and short
By default, quiet settings for 1 hour
You can choose the settings you like.
//FILTER SETTING
-RSI
If the checkbox is checked, the filter will be enabled.
The higher the upper bound, the less frequent short entries.
The lower the indicators of the lower border, the less frequent entries to the long
Algotrading
Algo Trading (Nifty & BankNifty)What is Algo Trading ( Nifty & Bank Nifty ) Indicator?
There are many 9 to 5 working professionals who have some spare money to invest each month but they can not do active trading because they are busy with their full time job.
So they wish to have an automated system which could take and close trades for them with a proven back-tested strategy, proper money management, ability to trade within particular timings, pre-defined maximum loss they can bear and so on.
This indicator facilities all such needs of working professionals.
How this indicator generates signals?
This indicator generates signals in 3 ways:
(a) Pricing action validated by Jump in Volume
(b) Moving Average Crossovers
(c) Zeta Force Signals as generated by our proprietary formula for Bank Nifty & Nifty
Once a threshold value is crossed, the Buy/Sell signal (LE & SE) appears on the chart and algo keeps track of the current state. Then this state is remembered for the loss or profit the trade is generating and position is closed either when loss crosses the set limit or when profitable trade starts receding.
What are the various features of this indicator?
(a) You can define your session timing i.e. the time period when you want your trades to be taken. For example: between 1000 hrs to 1330 hrs or so on.
(b) You can choose to close all positions by EOD . ( EOD is defined by the user. For example, if you set the session timing between 9:30 to 11:00 am, then indicator will not take any trades outside
this range).
(c) You can define the total loss you can bear during a particular day. For example, if total loss is 5% for the day, the algo stops taking further trades.
(d) You can set up either manual alerts for each event, for example Buy, Sell, Buy Close, Sell Close where you can customize the message you want to display or you can select the 'Any Alert()
function call' option which will generate pop up messages in TradeTron or Algoji friendly format. These signals can be routed to 3rd party platforms for execution. If you have TradeTron or
Algoji Account, you can enter your API key in algo settings, and after that the messages generated will contain your API Key by default.
What are the limitations of this indicator?
You can not make money with any indicator or algo if market is narrow range bound.
For you to make money, there must be a trend or mini-trend. Sometimes, price starts trending for a while and then reverses back. In such cases, multiple Stop Loss Hits might occur.
Can I use this for Option Trading also?
Deep in the money options behave like Futures only. So yes, you can use this algo for Options Trading by buying Deep in the money options.
Can I use this for trading in stocks or any other instrument?
No. The code has been hard-wired for Bank Nifty & Nifty (Indian Indices) only. A different, generic version of this algo is in the pipeline which can be used for Forex or Commodity and Stocks.

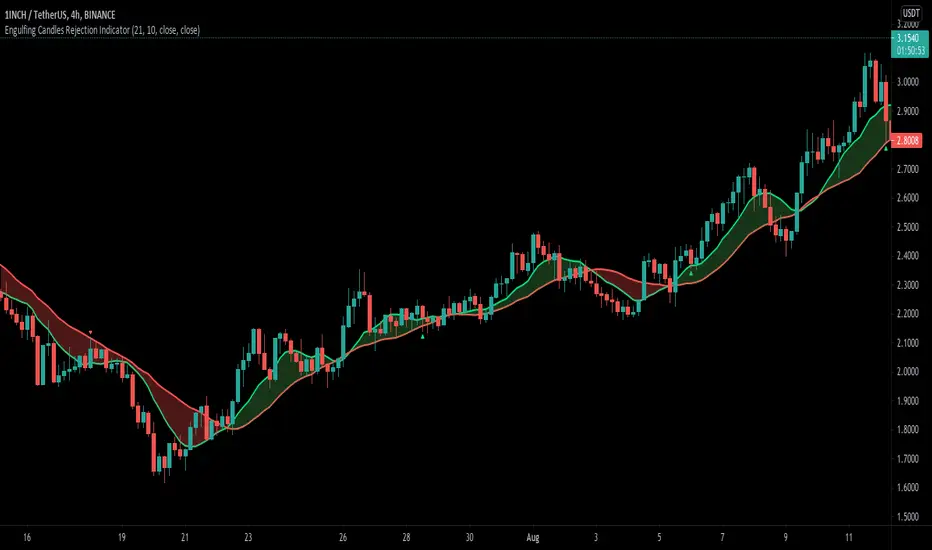
Engulfing Candle Rejection IndicatorThis indicator allows you to filter noisy chart, with engulfing candles which have been rejected from current trend lines. Trend lines by default are 21 MA (fast) and 10 MA (slow one). If fast moving average is greater than slower one, automatically indicator would represent that like uptrend, and if opposite then like a downtrend.
Consider to work only on higher time frames like 1H and higher, so you really can find only best entries.
Have fun, best wishes!
Angel Algo PremiumAngel Algo provides a set of tools, combined into one solution. Each tool complements each other and is made to uniquely support your trading decisions for your daily trading tasks. You can immerse yourself into our customizable tools to create your own strategies using them.
With Angel Algo you can:
* Find trend direction using three different algorithms designed for trend following, swing and intraday traders.
* Determine market sentiment, overall trends and volume with our full custom dashboard.
* Get real-time support and resistance levels plotted automatically
* Get trend confirmation using one of the two custom candle coloring algorithms
Trading signals
We have 3 different algorithms for entry signals you can choose from
Regular Buy And Sell Signals
Our regular Buy And Sell Signals are finding optimal times to enter for any security. This algorithm uses our original trend filter based on market volatility that adapts to different assets and market conditions.
We give traders the ability to adjust the sensitivity and aggression of these signals to market price changes, as well as the option to make them less sensitive to ranging markets so you can adjust to any market.
We added Auto Best Settings toggle to automatically optimize the settings for you if you'd like.
By adjusting the sensitivity and aggression parameters you can adopt the signal algorithm to different trading styles. For trend following which tries to capitalize on longer trends you should make the signals to be less frequent by adjusting this parameters. The settings that lead to more frequent signals suit to swing trading style.
Strong Signals Algorithm
The Strong Signals use an algorithm based on trend filtering coupled with confirmation signal based on higher time frame trend direction. It finds "Strong" buy or sells that are a tad different from the regular buy & sell signals you will see, a lot of the time they land on top of each other which can be used as an extra confirmation tool. Traders can also use this as a stand alone on higher timeframes.
Angel Intraday algorithm
We constantly try to push Pine script to its limits developing new features. Angel Intraday is our machine learning algorithm in beta that scans for intraday contrarian signals.
To find entry points it forecasts price range for a trading session using linear regression analysis and Kalman filtering.
If an asset is trading 24 hours a day it works with 12 hour sessions, for stocks it forecasts a price range for 7 hour trading sessions which represent the full trading day.
You can use this algorithm to get intraday trading signals for any asset. One of the advantages of this algorithm is that it gives identical signals for all intraday timeframes. The optimal time frames to view the signals and to enter positions are any.
What is the information in our Dashboard?
We offer real-time dashboard showing useful information to analyze market conditions:
- Angel Algo Trend Detection
- Directional Movement
- Angel Cloud for moving average detection
- Relative Volume
- Overall Market Sentiment
All of this information is aimed to help traders understand when the market regime is changing. The first three features help you to judge about trend strength. Relative volume shows current activity of market participants. Overall market sentiment reflects the actual bias for market direction.
Trend weakness, low market activity and neutral sentiment are the signs that can help you in early detecting of ranging market and avoid false trend signals or switch to contrarian mode.
The tools provided by Angel Algo are designed to help you perform rational actions based on the market data in a systematic way and to reduce emotional factor in your trading.
Using this script, please, keep in mind that that past performance does not necessarily represent future results and that there are trading.

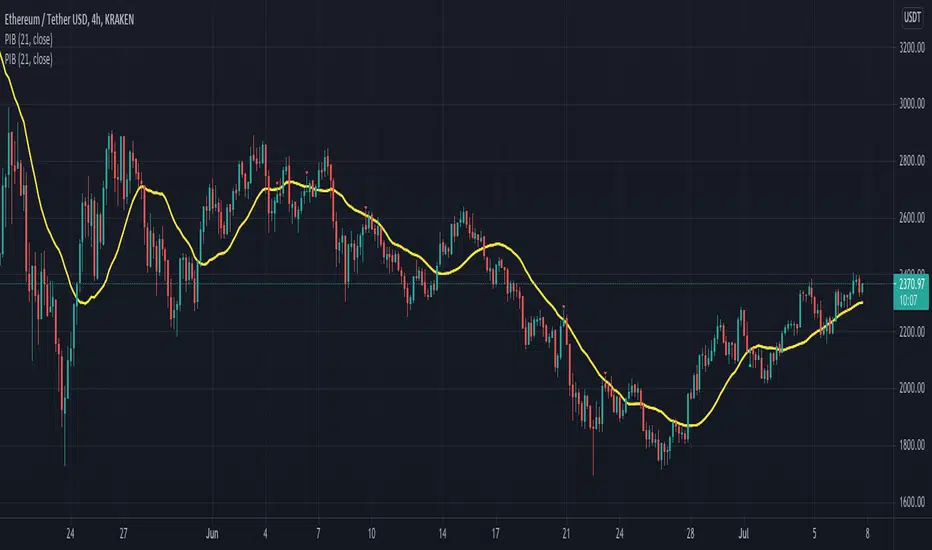
Pinbar-Rejection-IndicatorThis indicator allows you to filter noisy pin bar chart, with pin bars which have been rejected from dynamic support/resistance level also named as 21 Moving Average.
I would consider to work only on higher time frames like 1H and higher, so you really can find only best entries.
Have fun, write your feedback in the comments section:)
P.S This is the first version of the indicator, so be free to contribute, and soon I'm going to improve this indicator.
Grid Bot AutoThis script is an auto-adjusting grid bot simulator. This is an improved version of the original Grid Bot Simulator. The grid bot is best used for ranging/choppy markets. Prices are divided into grids, or trade zones, that will trigger signals each time a new zone is entered. During ranging markets, each transaction is followed by a “take profit.” As the market starts to trend, transactions are stacked (compare to DCA ), until the market consolidates. No signals are triggered above the Upper Limit or Below the Lower Limit. Unlike the previous version, the upper and lower limits are calculated automatically. Grid levels are determined by four factors: Smoothing, Laziness, Elasticity, and Grid Intervals.
Smoothing:
A moving average (or linear regression) is applied to each close price as a basis. Options for smoothing are Linear Regression, Simple Moving Average, Exponential Moving Average, Volume-Weighted Moving Average, Triple-Exponential Moving Average.
Laziness:
Laziness is the percentage change required to reach the next level. If laziness is 1.5, the price must move up or down by 1.5% before the grid will change. This concept is based on Alex Grover’s Efficient Trend Step. This allows the grids to be based on even price levels, as opposed to jagged moving averages.
Elasticity:
Elasticity is the degree of “stickiness” to the current price trend. If the smoothing line remains above (or below) the current grid center without reverting but still not enough to reach the next grid level, the grid line will start to curve toward the next grid level. Elasticity is added to (or subtracted from) the gridline by a factor of minimum system ticks for the current pair. Elasticity of zero will keep the gridlines horizontal. If elasticity is too high, the grid will distort.
Grid Intervals:
Grid intervals are the percentage of space between each grid.
Laziness = 4%, Elasticity = 0. Price must move at least 4% before reaching the next level. With zero elasticity, gridlines are straight.
Laziness = 5%, Elasticity = 100. For each bar at a new grid level, the grid will start “curve” toward the next price level (up if price is greater than the middle grid, down if less than middle grid). Elasticity is calculated by the user-inputted “Elasticity” multiplied by the minimum tick for the current pair (ELSTX = syminfo.mintick * iELSTX)
Try experimenting with different combinations of the Smoothing Length, Smoothing Type, Laziness, Elasticity, and Grid Intervals to find the optimum settings for each chart. Lower-priced pairs (e.g. XRP/ADA/DODGE) will require lower Elasticity. Also note that different exchanges may have different minimum tick values. For example, minimum tick for BITMEX:XBTUSD and BYBIT:BTCUSD is .5, but BINANCE:BTCUSDT and COINBASE:BTCUSD is .01.
s3.tradingview.com
DODGEUSDT, 5min. Laziness: 4%, Elasticity 2.5
Number of Grids: 2. Laziness: 3.75%. Elasticity: 150. Grid Interval 2%.
Settings Overview
Smoothing Length : Smoothing period
Smoothing Type : Linear Regression, Simple Moving Average, Exponential Moving Average, Volume-Weighted Moving Average, Triple-Exponential Moving Average
Laziness : Percentage required for price to move until it reaches the next level. If price does not reach the next level (up or down), the grid will remain the same as previous grid (because it’s lazy).
Elasticity : Amount of curvature toward the next grid, based on the current price trend. As elasticity increases, gridlines will curve up or down by a factor of the number of ticks since the last grid change.
Grid Interval : Percent between grid levels.
Number of Grids : Number of grids to show.
Cooldown : Number of bars to wait to prevent consecutive signals.
Grid Line Transparency : Lower transparencies brighten the gridlines; higher transparencies dim the gridlines. To hide the gridlines completely, enter 100.
Fill Transparency: Lower transparencies brighten the fill box; higher transparencies dim the fill box. To hide the fill box completely, enter 100.
Signal Size : Make signal triangles large or small.
Reset Buy/Sell Index When Grids Change : When a new grid is formed, resetting the index may prevent false signals (experimental)
Use Highs/Lows for Signals : If enabled, signals are triggered as soon as the price touches the next zone. If disabled, signals are triggered after bar closes. Enable this for “Once Per Bar alerts. Disable for “Once Per Bar Close” alerts.
Show Min Tick : If checked, syminfo.mintick is displayed in upper-righthand corner. Useful for estimating Laziness.
Reverse Fill Colors : Default fill for fill boxes is green after buy and red after sell. Check this box to reverse.
Note: The Grid Bot Simulator scripts are experimental and works in progress. Please feel free to comment or contact me if you have suggestions/complaints.

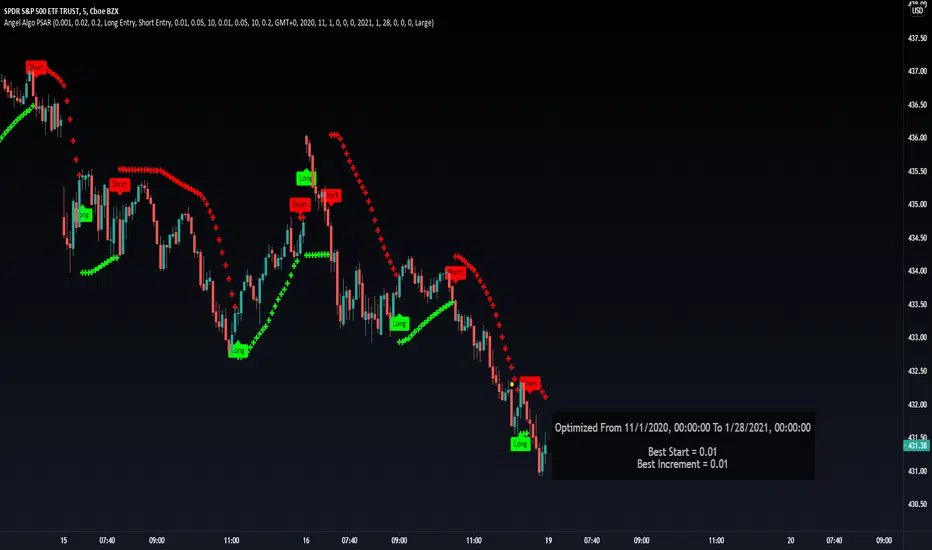
Angel Algo PSARHello, wanted to drop this self learning PSAR Algorithm for you guys
This input is equivalent to "Max Value" in the built-in SAR . It's fairly self-explanatory.
This is the acceleration factor's limit.
I kept it at 0.2 like the standard. You won't typically notice much of a difference when changing this value, unless you decrease it.
The inputs control your date and time settings for the "learning" phase.
The start and end times are also displayed within the info panel.
You can also select your timezone for this. By default, it uses the exchange's timezone. But you can set a custom time zone for this as well.
When time is within this range, the optimizer is actively running and identifying the best settings for start and increment. Once time is outside of this range, the values are finalized.
The last input group is for the info panel.
From here, you can toggle it, as well as select size and colors.
Naturally, this script is quite different from your "run of the mill" PSAR since it uses a form of algorithmic learning to automatically identify the best settings. Or in other words, the inputs are optimized to deliver the best returns over the testing range.
Leave a like or comment!
Had to update the this public script
Extreme Money [Crypto Trading FR]Extreme Money aims to smooth out market fluctuations and predict trend changes.
The algorithm shows the turning points in the market and uses multiple filters to present the best potential turning points. Although this is its core functionality, Extreme Money also incorporates a series of popular other indicators (see below) allowing full identification of trends on the chart.
The tool aims to calculate market strength and then show potential turning points in the market signalled with small circles. Once the trend confirmation has changed, the algorithm signals a circle, giving the trader the potentially desired entry with an audible or pop-up alert if needed. The more circles there are when setting up the entry, the greater the chances of a trend reversal.
This algorithm can be used on all time intervals, as well 5, 15 or 30 minutes but it is particularly recommended on the 1H, 2h and 4H intervals for maximum efficiency. The indicator works as well for swing-trading as for intra-day trading: whatever the time interval selected, it filters potential entries with great precision.
The algorithm can also be used with any cryptocurrency or currency pairs from traditional markets, the parameters of the algorithm can be customized and adapted without difficulty.
Extreme Money also includes 8 indicators assembled in a single script, which can be activated or deactivated manually:
1) Algo (main indicator)
2) EMA
3) Hull
4) Trend
5) Pivots
6) Trend line
7) VWAP Line
8) RSI Swing
Benefits :
- Notifies the trader of potential entries
- Color coded entries for buying and selling
- Creates cluster signals at potential turn points
- Aims to avoid market noise
- Used on all types of timefames
- Analyze the current market trend
- Assists in Predicting Market Turn Points
- Cryptocurrency, FX, stock indices and gold trades
- Maximize profits
- Analyzed market strength and weakness

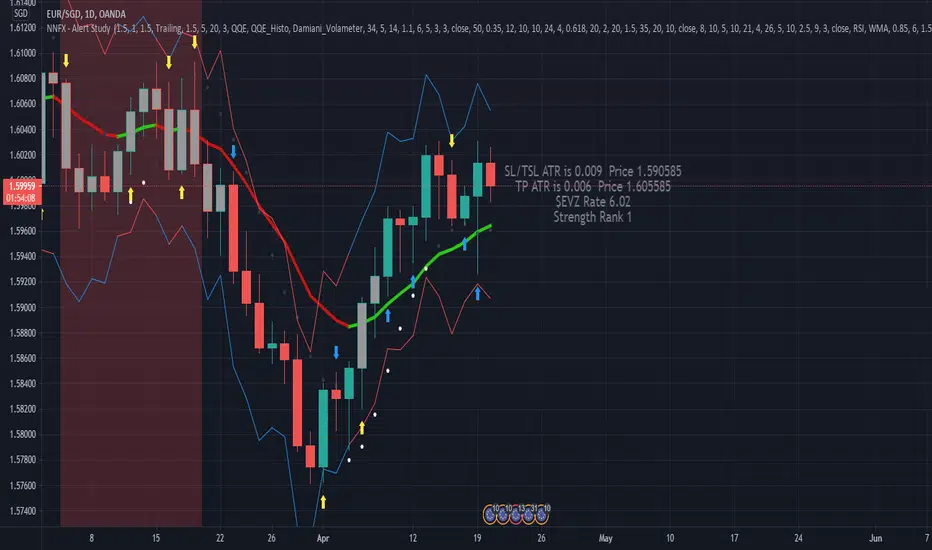
NNFX, Baseline, QQEs Fast C1, Slow C2, ATR, Volume and ExitDesigned Around the NNFX rules
Selectible Baseine
Selectible Exit Indicators
ATR bands, ATR labels for TP and TSL (1x and 1.5x ATR).
Indication (White Diamond) where candle is over 1x ATR in size.
Combined QQE Fast & Slow (C1 & C2) confirmations, Candles Grey before Trend Confirmed, change to Normal Colour when Trend established (QQE MOD used for calcualtions).
Continuations signaled by white dot above/below candle (0.9x ATR from Close Signal).
Exit Long and Exit Short signaled by Red and Blue Arrow under/above candle.
MM DonBased on the nnfx trading style this algorithms has many different calculations to provide the best signal and confirmations
1. The SuperSmooth Forecast Moving Average
2. TrendLine Moving Average
3. Smoothed Heiken Ashi Moving Average
4. Baseline that can change between 15 different moving averages
Buy/Sell Alarms for all the moving averages
Exit buy/sell Alarms
Entry
3 TP
ATR x1.5 Stop Loss auto generated per signal.
Also be able to set tp alarms for both buy/sell entries. so you place your trade and be alerted when your take profits have been hit.
works on all timeframes for scalpers, intraday, or even swing.
effective on binary as well.
Directions are simple
combine simple Market Structure & as long as everything matches (Buy Signal & everything is blue + baseline is white) (Sell Signal & everything is Red + Baseline is Red) you can enter the signal generated, exit the trade when told to exit and Manage your trade.
this was made to make trading easy and create confidence with in the trader.
Link below or PM us for access to this indicator Happy Trading

RR 2
Software signal with Trend of the market/Central Pivot Range combined with RR1 for better results.

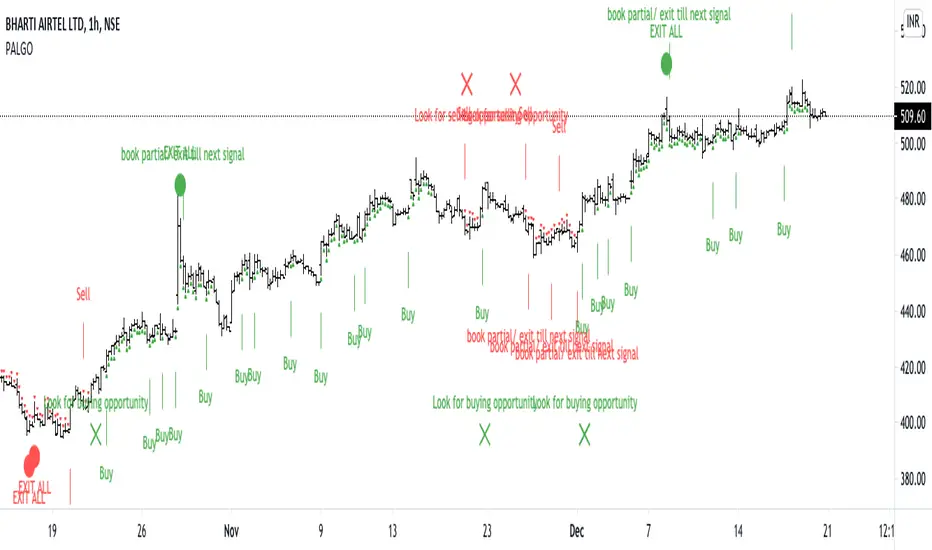
PALGOWHAT DOES THE SCRIPT DO & HOW IT IS BEING DONE :
This script is designed by using some momentum indicators and oscillators like RSI and stochastic to identify the momentum of the stock. Whenever there is a start of momentum the stochastic indicator combined to the RSI and other oscillator gives a cross signal & alert a user to look for either BUY or SELL opportunity in the stock.
When there is a gain in momentum , the script uses RSI & Bollinger bands to identify the breakout & provides a buy/sell signal for taking entry into the trade.
Few moving averages helps a user to hold the trade by providing a signal on the chart after each candle’s closing in the form of triangles.
The script provides a signal in the form of a circle to exit the position when the price gets overbought/oversold . Here the script uses the momentum indicators RSI & MACD & stochastic in combination.
HOW TO USE THE SCRIPT:
General parameters:
1. Best suitable for stocks to trade in equity/futures segment.
2. Do not apply on Index like nifty or banknifty/ commodities /forex/ and cryptos
3. Strictly use only on 1 hour time frame. (Best tested results are on 1 hour time frame)
4. Use only to take swing trades only.
How to interpret the signals :
1. Wait for a ‘X’ sign before mind make up. A red ‘X’ means look for selling opportunity , a green ‘X’ means look for buying opportunity. After getting the X sign the user will be shown a text signal whether to look for buying opportunity or selling opportunity
Taking a position:
2. Wait for an arrow before entering into any position. A red arrow on upside of a bar pointing downward means open short position. A green arrow below the bar pointing upward means open buy position. After getting the arrr sign the user will be shown a text signal whether to create a buy position or sell position.
NOTE: Only after the the signalling of X , look for arrow. Do not buy/sell if you see any arrow before the signal of X.
STOP LOSS should be the most recent swing high/low or most recent STRONG CANDLE’S high/low.
While maintaining the position :
3. The small triangles after the each bar completion tells you to hold the position. The red triangles appearing upside on the bar tells you to hold the short position, whereas the green triangles appearing below the bars tells you to hold the long position.
Exiting the position:
4. After you create a buy position , if you see a green arrow above any bar pointing downward, then you should either book partially/leave the position for sometime. You will get another signal to re-enter. With the signal user will be shown a text to indicating for partial book/exit till next signal.
5. Similarly, after you create a sell position , if you see a red arrow below any bar pointing upward, then you should either book partially/leave the position for sometime. You will get another signal to re-enter. With the signal user will be shown a text to indicating for partial book/exit till next signal
While being in position if you see any X signal which is opposite of your trade , then leave your position immediately.
6. When you see a big red circle dot then you must exit all your short positions. Contrary , when you see a big green circle dot , you must exit all your long positions. And then wait for a X-signal. With the signal user will be shown a text to indicating to exit all of the position.
No Trading Zone:
When you get frequent X-signals in green-red-green-red & that too very close, then its means that stock is going to form a range. One should wait for the range break & move away to another stock. (THIS IS WHERE YOU WILL REQUIRE A PRACTICE TO IDENTIFY THE RANGE)
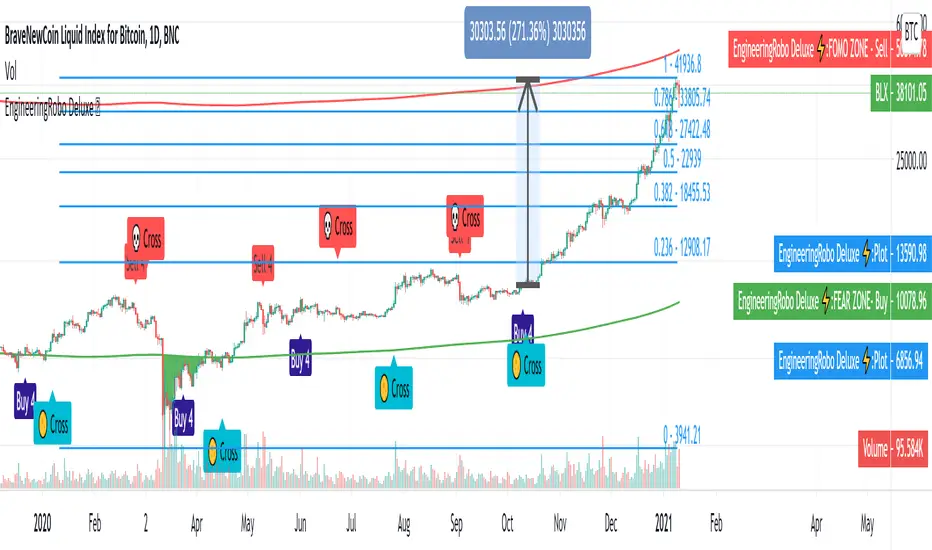
EngineeringRobo DeluxeToday we are releasing the EngineeringRobo Deluxe!
New advanced trading tools for traders and investors. The new Robo 4 is extremely powerful !
It works perfectly with other existing strategies as an add-on feature. EngineeringRobo Deluxe has seen major improvements in accuracy of levels, speed and intelligence to detect the best possible trade setups.
This script is equipped with
🔵 EngineeringRobo 4
It offers strategic trading entry and exit points, so you can preserve capital before markets tumble, and take full advantage as they start to rebound. At a glance, market timing indicators tell investors whether market conditions are right or whether it’s safer on the sideline.
Truly unique tool for technical analysis for the financial market as it includes calculation of specific metrics like SAR + MACD + Price Movement.
You no longer have to worry about spending hours in front of the computer looking for a trade.You can use the indicator on every assets available on your broker.
🔵 Change Candle Color
You can change the colors depending on buy 4 and sell 4 signals. It helps traders a lot to see the direction clearly.
🔵 BB Signals :
This strategy uses the MACD indicator together with the Bollinger Bands to sell when the price is above the upper Bollinger Band (and to buy when this value is below the lower band). This simple strategy only triggers when both the MACD and the Bollinger Band indicators are at the same time in a overbought or oversold condition.
Removed Upper & Lower bands & SMA20 from the charts.
To see bands, You can activate the Bollinger Bands on EngineeringRobo - not the Deluxe version.
If you are buying it with BB BUY, No need to wait for BB Sell to sell it. Vice versa.
They are not the opposite to each other. Get your profit at your target level and move on.
🔵 Ultimate MA crossover signals :
As a general guideline,the idea behind trading crossovers is that a short-term moving average above a long-term moving average is an indicator of upward momentum in a stock & crypto , and the opposite is true about a short-term average trading below a long-term average.
For this guideline to be of use, the moving average should have provided insights into trends and trend changes in the past.
Are the settings of SMA 50 & SMA 200 really the best for Golden Cross and Death Cross?
Have you ever tested ROI for MA cross strategies?
Do you think MA 20 and MA 50 are the best pair for traders?
Do you know that Exponential Moving Average ( EMA ) beats the Simple Moving Average ( SMA ) ?
In order to answer these questions we applied some brute mathematical force and tested 1830 different MA combination to find out the best pair through 50 years of data across stock / forex and 5 years of data across crypto markets . We have done the hard work and you get the benefits .
P.S. The oldest date is 1872 on SPCFD:SPX chart on tradingview . Almost 150 years of backtesting is possible from 1872 to 2020!
🔵 Cloud Signals :
This is a strategy made from ichimoku cloud , together with MACD . Changed Ichimoku cloud formula. Based on that we have a long or a short entry.
it is an effective strategy when paired with a trailing stop loss. Removed standard line ( Kijun Sen ), turning line ( Tenkan Sen ), lagging line ( Chikou Span ) and senkou lines, added buy & sell signals. Traders can use EngineeringRobo's cloud to see the clouds on the chart.
This method doesn't work in sideways markets, only in volatile trending markets.
🔵 EMA TrendLines & Custom Moving Average :
Moving averages help traders isolate the trend in a security or market, or the lack of one, and can also signal when a trend may be reversing. Two of the most common types are simple and exponential. We will look at the differences between these two moving averages, helping traders determine which one to use. Simple moving averages and the more complex exponential moving averages help visualize the trend by smoothing out price movements.
Each trader must decide which MA is better for his or her particular strategy. Many shorter-term traders use EMAs because they want to be alerted as soon as the price is moving the other way. Longer-term traders tend to rely on SMAs since these investors aren't rushing to act and prefer to be less actively engaged in their trades.
🟠50 And 200 Day Moving Average Rules
Trend reversal (downtrend to uptrend) - MA 50 crossover MA 200 from below.
Trend reversal (uptrend to downtrend) - MA 50 crossover MA 200 from above.
Weekly open –close above MA 20 ( bullish trend )
Weekly open –close below MA 50 ( Bearish trend )
Super Bullish : The candle is above MA 20 ( Daily )
Bullish : MA 50 Above MA 100 ( Daily )
Bearish : MA 50 below MA 100 ( Daily )
🔵 Fear & Greed Index
This strategy uses two unique EMA indicators in the formula.
1. Use the indicator to identify when investors are greedy.
2. Use the indicator to identify potential bottom levels
For best testing example:
Open BLX Chart, pick 1D time frame, open only FEAR & Greed Index
🟢Green Area : Ready to buy a lot of cryptocurrencies
🔴Red Area : Ready to sell a lot of cryptocurrencies
Price crosses above red line = Entering overbought zone
Price crosses below red line = Exiting overbought zone
Price crosses below green line = Entering oversold zone
Price crosses above green line = Exiting oversold zone
🔵 Automated Trend Channel Lines
It’s 2020 and you are still drawing lines?
The automated trend lines helps you find the best trend lines and you can stop re-drawing over and over. You don't need to flip back and forth between different timeframes. You can let your robo advisor do the work for you.
🔵 Dynamic Support and Resistance Levels
On the most fundamental level, support and resistance are simple concepts. The price finds a level that it’s unable to break through, with this level acting as a barrier of some sort. In the case of support, price finds a “floor,” while in the case of resistance, it finds a “ceiling.”
Basically, you could think of support as a zone of demand and resistance as a zone of supply.
While more traditionally, support and resistance are indicated as lines, the real-world cases are usually not as precise. Bear in mind; the markets aren’t driven by some physical law that prevents them from breaching a specific level. This is why it may be more beneficial to think of support and resistance as areas. You can think of these areas as ranges on a price chart that will likely drive increased activity from traders.
🔵 Automated Fibonacci Retracements
Automatic Fibonacci let you replace subjective manual analysis with objective automated analysis so you always get the best Fibonacci levels, this can really improve the quality of your trading decisions.
Fibonacci retracements are often used to identify the end of a correction or a counter-trend bounce. Corrections and counter-trend bounces often retrace a portion of the prior move. While short 23.6% retracements do occur, the 38.2-61.8% zone covers the most possibilities (with 50% in the middle). This zone may seem big, but it is just a reversal alert zone. One of the best ways to use the Fibonacci retracement tool is to spot potential support and resistance levels and see if they line up with Fibonacci retracement levels.
Even though Fibonacci levels are extremely popular among technical traders, one should not rely solely on Fibonacci retracement and extension levels in trading. Fibonacci tools return the best results when combined with other technical tools, such as trendlines , chart patterns, candlestick patterns, channels or technical indicators.
If you are following any EngineeringRobo Deluxe signals, you should always wait for the candle close before buying or selling.
The signal can come and go anytime during the live candle. ALL indicators do that, that is not considered repainting.
Repainting is when a signal appears, the candle is closed, and when you refresh the chart it disappeared. It is logical that until the candle is closed the signal is not decided yet, hence the alert setup as Once per bar Close.
Deluxe never repaints! Yes, you heard it right: you will never have to worry about signal changing after the candle is closed.
*** Added alarm system alerts for all signals.
________________________________________________________________________ Timeframes _____________________________________________________________________
Our recommendations to get the best results:
Swing Trading Crypto : Use 1D Time Frame Candles
Swing Trading Stocks : Use 1W Time Frame Candles
Swing Trading Commodities : Use 1W Time Frame Candles
Day Trading Crypto : Use 3H Time Frame Candles
Day Trading Stocks : Use 1D Time Frame Candles
Day Trading Commodities : Use 1D Time Frame Candles
Not recommended any other time frames.
What Is Risk-Reward Ratio RRR?
Your risk-reward ratio is how much you risk per trade, relative to how much you expect to make (reward).
When trading with Robo , you should always aim for a bigger reward compared to your risk per trade.
A good rule is only to risk 1% per trade for day traders and 5% per trade for swing trader . Robo follows strong risk management rules on the algorithm .
One of the biggest advantages of algo trading is removing human emotion from the financial markets,humans trading are susceptible to emotions that lead to irrational decisions. Robo doesn't have to think or feel good to make a trade. If conditions are met, it enters.When the trade goes the wrong way or hits a profit target, It exits. It doesn't get angry at the market or feel invincible after making a few good trades.
EngineeringRobo gives you all the tools and information you need for day-to-day trading and investing, while also keeping a great buy and sell signals! No excuse to lose in any financial market anymore! Try now!
How can you add the algorithm into your chart?
1. Login to TradingView.com
2. From the homepage, click on ‘Chart’ in the top navigation bar
3. Select “Indicators” on the top-center-middle panel
4. In the indicator library, type "EngineeringRobo Deluxe "
5. Use the website link below to obtain access to this indicator
The indicator will be added to your chart after It is approved.
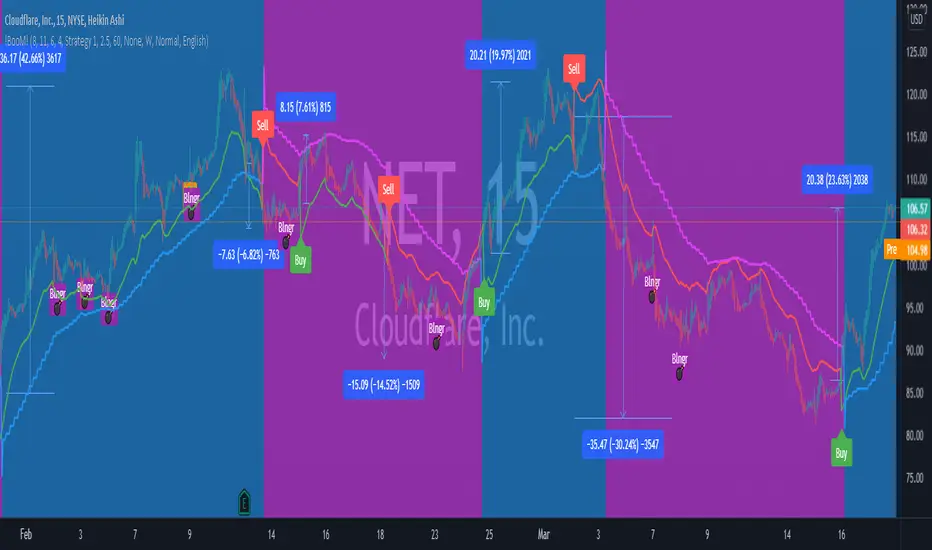
!BooM!Hello
The indicator measures the relationship between Average True Range (ATR) that shows how much an asset moves, on average, during a given time frame and Standard Deviation that measuring how widely asset prices are dispersed from the average price. If prices trade in a narrow trading range, the relationship between the ATR and SD will return a low value that indicates low volatility that will lead to potential price quick movement.
To increase the accuracy of the indicator and reduce false signals, it generates three circles, each indicate protentional price quick movement coming. For circle to print, following criteria must meet:
• Green Circle is based on low volatility and both ATR and SD are at minimum value for a short pre-defined time frame.
• Magenta Circle is based on low volatility and SD are at minimum value for a long pre-defined time frame.
• Yellow Circle is based on low volatility and SD are at minimum value for a short pre-defined time frame and Average Directional Movement Index reaching to pre-defined level.
The indicator focuses mainly on identifying potential price quick movement. However, it is equipped with two signal that is generated upon crossing the keltner channel upper or lower bands to help identifying the direction of the price movements but the user shall study the chart on big time frame to confirm the direction of the price movement.
If you would like to use it, please drop a message or find other contact under my signature.
After purchase, open the TradingView indicator library. Under the Invite-Only Scripts section, you will see it. Add it to your chart and save your chart layout.
[Study] GreenCrypto Signal You can find the backtesting result of this indicator in here:
This indicator majorly uses MA, Tilson and S&R. MA is used for predicting the trend, Instead of normal cross-over of the MA, we are calculating the trend of the MA itself (whether MA is moving upward or downward by comparing the previous and current value of MA), along with MA we also use Tilson to calculate the MA.
Once we have MA and Tilson we take average and merge both MA and Tilson MA to get a double confirmation on the trend of the market. for entry and exit we use S&R with the merged MA, if the trend change is at the support or resistance level we go for LONG/SHORT respectively. Here we are doing continuous LONG+SHORT position, this provides more opportunity to capture unexpected market trend.
Enter a Long Trade when the script shows "Long" and exit either when you get "Short" signal or when it meets your target.
Parameters:
"Use 1:EST, 2:SST, 3:HST ?" : Select EMA , SMA or HullMA (works best on HullMA)
Length: Length of the EMA / SMA /HullmA
Factor: Used for calculation of Tilson and the Support and resistance .
This indicator works best on 4H time frame but you can also use it on 1 day or higher timeframe charts
The default config present in this script is designed for ETH but it will also work with other coins)
Config for Specific Crypto coins (Please feel free to try out other configs also) :
ADA, BNB, EOS : "Use 1:EST, 2:SST, 3:HST ?" = 3
"Length" = 8
"Factor" = 0.9
ETC, XLM : "Use 1:EST, 2:SST, 3:HST ?" = 3
"Length" = 8
"Factor" = 0.85
Please DM me if you would like to tryout 7 Days free trail.
Thanks

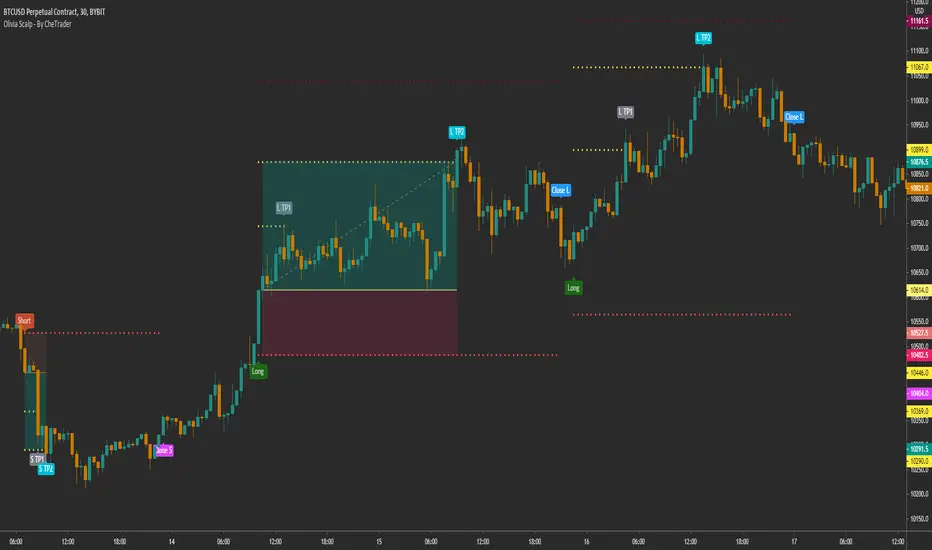
Olivia Scalp - By CheTrader
This is a complex strategy for Scalp that is fully configurable and can be automated
This script uses a combination of ma to detect the trend at a higher time frame, which can be defined by the user, as default set to 1D and 1M.
Triggers for long and short are given in a lower time frame, for example 30 minutes and are given by a combination of factors and oscillators. These include RSI, ADX, DMI
The script includes everything needed to follow the trade according to the habits of the trader.
This includes the option to use Take profit and Stop loss based on ATR that you can configure with the RR you like.
Similar to the risk-reward tool in tradingview.
You can also define a stop and take profit based on a percentage from the entry and also use a Trail stop, to finish the position when it is reached.
Each take profit and stop loss has a customized alarm so you can automate each action.
Also included is the option to use "advanced alerts"!
This is: You define how many seconds before you close the candle the alarm will be activated in TradingView. Very useful if you are going to automate, so that your alarm arrives just in time to your exchange.
Included:
Different trade entry options
Different forms of Take profit, included:
Take profit on squeeze candles
Take profit based on Risk-Benefit (RR)
Take profit a pre-determined %.
Different forms of Stop Loss, including
ATR-based stop loss
Trail stop loss (with option to use a trigger)
Stop loss a pre-determined %.
Contains a Risk Management section
May use a volatility filter
Statistics panel for backtest
Advanced alerts
As default is configured for BYBIT:BTCUSD 30 minutes
For access you can send a message or consult in my social networks.
Links in my tradingview signature (below).
TB Momentum/Volume Indicator, MTFThis Indicator Merges The Best Parts Of The Macd, Vortex, Volume, Ichimoku Cloud, Bollinger Bands, Atr, And Rsi Indicators.
The Idea Is To Signal Important Sectors Of The Chart Were All Or Some Of These Indicators Are Giving The Same Signals.
This Indicator Consist Of 3 Parts The Signaling Indicator Which Goes On As A Layout On Top On The Price Action (Candles), An Indicator Called (TB Macd /Momentum Squeeze) That Shows The Actual Macd With A 0 Line Merging With The Momentum Squeeze. The Third Part Is The (TB Rsi Indicator) Which Signals Overbought And Oversold Areas. These 3 Indicators Are Given For Free But Are Only For Premium Members For The Trading Bullies Premium Service.
To Get Access Please Send A Private Message
After You Have Been Given Access You Can Find The Indicators On The Invite Only Scripts
Instructions:
After Applying To Your Chart You Should See On The Left Part Of Your Screen Where Your Indicator Labels Are “TD-Mom/Vol” Click On The Settings To Start The Setup
-The Macd Settings
- The First 5 Checkmarks Go Untouched
- The Settings Can Be Left Standard Or They Can Be Changed To 8-17-9 For Faster Signals. 8-17-9 Are My Settings
-Vortex Settings
- The Vortex Periods Can Be Set To 12 For Faster Signals Or To 14. 12 Is My Go-To Setting
-The Ichimoku Filter
- When This Is Activated It Decreases Significantly The Signals And Should Only Be Turn On If You Only Wish To Receive Signals When The Macd, Vortex, And Ichimoku Conversion Line And Baseline Crosses Around The Same Areas. I Generally Leave It Off
-Volume Filter
- When The Volume Filter Is Activated The Alerts Will Only Come Up If The Volume Is Above The 20 Ma. This Can Be Changed As Well But In General 20 Ma Is The Best For All Markets. I Leave This At 20 Ma The Macd 0 Line Filter
-Macd 0 Line Filter
- This Filter When Activated Will Only Give Signals When The Macd Crosses Up Below The 0 Line For Longs And Above The 0 Line For Shorts. I Generally Leave This Off
-Rsi Filter
- This Filter Will Create A Grey Signal When The Signal Is Given On Overbought Or Oversold Areas. Settings Should Be Left At 12 Or 14 And Then 70-30. I Leave This On
-The Cloud Squeeze
- The Cloud Squeeze Is A Visual Indicator That Marks The Trend Green Cloud Is Trend Up And Red Cloud Is Trend Down. The Wider The Cloud The More Resistance Its Got Below Or Above. Settings For This Should Be 10-40 Resolution Depending On The Timeframe You Are Working On
-The Momentum Squeeze
- Momentum Squeeze Will Signal A Triangle Above Or Below The Candles To Signal The Strength Of the Trend. This Is Very Helpful On Lower Timeframes 1m - 5m To Signal When The Trend Is Losing Steam. You Can Set The Bollinger Band Ratio On And Use The Henkin Ashi Optimization When Using Those Kinds Of Candles.
- Style******
- The Style Tab Is Very Personal But I Like The Below Settings
- First Shape Label Up Below Bar, First Color 9598a1 - Second Color 00e676
- Second Shape Label Down Above Bar First Color 9598a1 And Second Color Ff5252
- Short And Long Leading Ema Are Already Set
- Momentum Positive & Up With Triangle Up Above Bar Color 4caf50
- Momentum Positive & Down With Triangle Down Above Bar Color 1b5e20
- Momentum Negative & Up With Triangle Up Below Bar Color Ffeb3b
- Momentum Negative & Down Triangle Down Below Bar Color Ff5252
- Ma Cloud Left As-Is.
Functionality:
Labels
These Labels Are Best Used Un Longer Timeframes 1hr+++
-Cross+Up Green - Momentum And Volume Are High, Possibilities For A Long/Call In The Market
-Cross+Up Grey - Momentum And Volume Are High. Possibilities For A Long/Call In The Market But Signal Is Presented In Overbought Area Of The Rsi
-Cross-Down Red - Momentum And Volume Are High Possibilities For Short/Put In The Market
-Cross-Down Grey - Momentum And Volume Are High Possibilities For Short/Put In The Market But Signal Is Presented On Oversold Area Of The Rsi
Cloud
Very Important To Not******* Take Any Trades From The Above Labels When The Cloud Is Thin, This Indicator Measures Trending Markets And When There Is No Trend Or A Range Market The Signals Are To Be Disregarded*******
-When Cloud Is Green The Trend Is Upwards And You Should Look To Long/Call The Market. Try Not To Take Any Puts/Shorts As You Will Be Going Against The Trend
-When Cloud Is Red The Trend Is Down And You Should Look To Short/Put The Market. Try Not To Take Any Call/Longs As You Will Be Going Against The Trend
Momentum Triangles On Top Of The Candles
-There Are Made To Be Used In Lower Timeframes 1m -5m -15m
-These Are Good Once You Are In A Position And You Want To Get A Closer Look At The Trend.
-Green Arrow Up Signals High Momentum Up Buyers In Control
-Blue Arrow On Top Downwards Signals Uptrend Is Losing Steam
-Orange Arrow Below Upwards Signals Down Momentum Is Losing Steam
-Red Arrow Below Signals Momentum Is Down Sellers In Control
HFT Momentum IndicatorDefault Settings are meant to be used in XBT/USD chart on 1 hour time frame. If you want to use for another asset on another time frame YOU MUST CHANGE THE SETTINGS
This is momentum-based strategy designed by HFT Research in order to take advantage of volatile, trending markets.
Use ADX
ADX stands for average directional index . It is an indicator that measures volatility in the market. Unfortunately, the worst market condition for this strategy is sideways market. ADX becomes a useful tool since it can detect trend. If the volatility is low and there is no real price movement, ADX will pick that up and will not let you get in trades during a sideways market. It will allow you to enter trades only when the market is trending.
Use MA CrossOver
This strategy’s main driver is the moving average cross over however, unlike many other indicators, this strategy has ALL the moving averages that are on trading view. Total of 13 different moving averages all calculated in a different fashion available in a drop-down menu. You are able to choose two different moving averages to cross for your entry as well as being able to adjust the length of each individual moving average.
Use MA Spread % Filter
As an extra protection, we introduced MA spread % filter. We all know that momentum strategy works when there is actually a trend that has momentum. When there is no trend and market side choppy, we get a lot of noisy signals. In order to battle that we have introduced MA spread % filter. Using this piece of setting, you will be able to chose how strong the cross over actually is. If price is moving sideways, the moving averages will cross each other barely. If the price has actually any steam and momentum, MA 1 will cross over MA 2 aggressively because it will be trending market.
First you chose what the minimum % difference there should be between your 2 moving averages. If you keep this too tight, it won’t be as useful and if you keep this too large then the script will not generate any signals. Trust us, there is a fine balance in between! Then you proceed to chose your moving averages that the bot should keep track of.
Check our website for more information.

Algo Trader RSI 3/80/20 StrategyThis script is based one a simple , yet very powerful strategy.
Script monitors the candle bar formation and RSI indicator (3/80/20).
15 minutes time frame to be used for better result.
Buy call is triggered when the following conditions are met:
1. Two Bullish Candles one after another.
2. Latest close is higher than previous candle high.
3. Latest RSI value is higher than 80.
SELL call is triggered when the following conditions are met:
1. Two Bearish Candles one after another.
2. Latest close is lower than previous candle low.
3. Latest RSI value is lower than 20.
** When the candles formed are too weak or too strong, such formations are avoided.
Stop Loss will be triggered as follow:
BUY - Stop Loss will be previous candle LOW.
SELL - Stop Loss will be previous candle HIGH.
This strategy is expected to give a winning ratio of 1:2 or 1:1.5.
However BUY or SELL call to be avoided, if the stock is already shifted too much to its direction.
This tool is created and tested for INDIAN Share market (NSE,BSE,MCX).

Daytrade Killer This script is the programmed version of my daytrading methodology. It is my firm belief that, a successful and legendary trader is someone who can trade with confidence, confirmation and comfort. They always find the setups they are familiar with , trade them over and over again, and they will get the result.
As someone still on the path to becoming one of them, today I will share just one of my favorite setups I consistently trade with - VER (volume expansion reversal). Fist two important elements for this setup - extraordinary volume and reversing price action. Most important thing is to " Buy low , sell high".
The logic is simple, if you observe more , you can easily find out the combinations to building this script. You just need to check the price action , volume and moving average.
P.S The recommended timeframe for use is 1-5 min(s) , lime background is for buying , aqua background is for selling
If you like my scripts and ideas , follow my little account. I promise I will always bring you surprise!!! 😘

Algo Trader Swing Trade ToolAlgo Trader Swing Trade Tool is a script that detects the trend and determines entry into the market based on price action / strength. To detect the trend, the volatility metric is used and is based on 2 standard deviations, one fast and one slow. The value of the fast standard deviations, will allow the indicator to be closer to the price, else the metric will be closer to the slow standard deviation which helps the indicator from changing trend and giving the expected results.
Additionally the tool is designed to monitor the candle bar formation and pattern along with trend identification and strength indicator values. Thus a BUY and SELL call is triggered.
Algo Trader Swing Trade Tool is designed and tested for Indian stock market (NSE,BSE and MCX).
Tool is designed to use for swing trade and Long term trade. For swing trade, 3~5 mins time frame charts are recommended and for Long Term trade, Day frame charts are recommended. If you want to use the tool for Intraday, you are recommended to use time frame less than or equal to 1 mins.
Use the instruction below to obtain access to this indicator

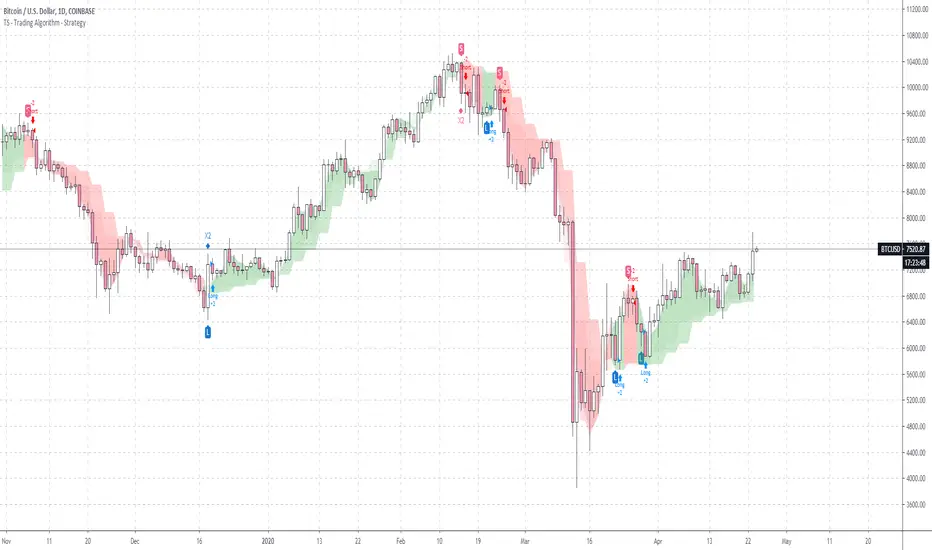
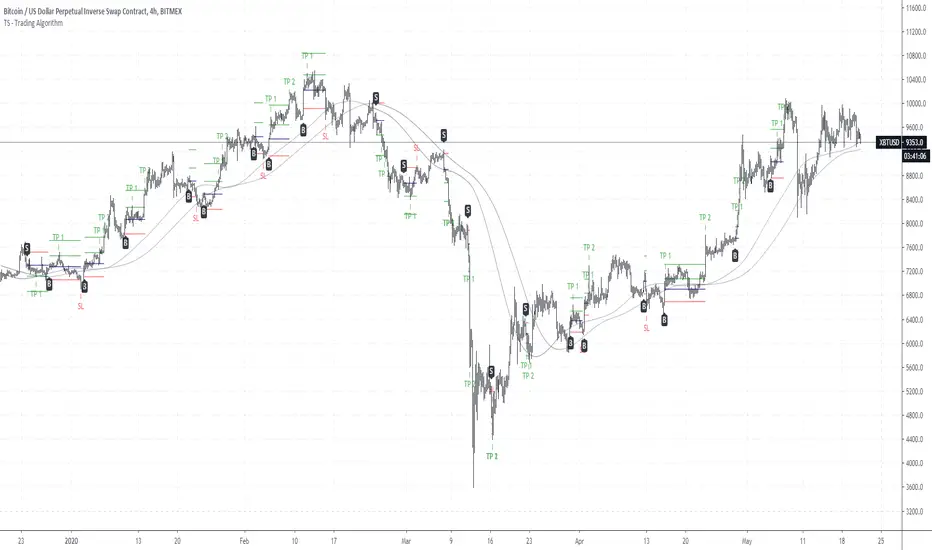
TS - Trading Algorithm - Crypto, Forex & StocksWhat does the TS - Algorithm do?
-- Plots trend following, high probability signals.
-- These signals do not repaint and can be used confidently to enter or exit a trade.
What markets can this indicator be used on?
-- Forex
-- Stocks
-- Commodities
-- Cryptocurrencies
What time-frames can this indicator be used on?
-- This indicator can be used on 1m, 3m , 5m, 10m, 15m, 30m, 1hr, 2hr, 3hr, 4hr, 6hr, 8hr, 12hr, Daily, Weekly, Bi-Weekly and Monthly time-frames.
-- This is a trend following algorithm, so low as there is good volume , volatility and price history of an asset, the model can perform.
Does this indicator repaint?
-- No
Premium Tradespot Script - Trial access and Information
-- Trial access offered
-- PM me directly to request trial access to the scripts or for more information.
TS - Trading Algorithm - StrategyStrategy to the bespoke TS - Trading Algorithm . Highly profitable cryptocurrency trading model.
Access to both the backtesting strategy & indicator is paid - PM me for details.
Indicator does not repaint and has no discretionary approach - you can follow blindly and take advantage of the performance.