Gann Square of Nine: Planetary Degrees█ Gann Square of Nine: Planetary Degrees maps planetary positions onto Gann's Square of Nine grid, tracking where pivot highs and lows accumulate by planetary degree. Use this indicator to identify recurring degree patterns on the So9, determine whether pivots cluster around cardinal, diagonal, or other significant angles, and project when the planet will return to those degrees.
Powered by the open-source BlueprintResearch Planetary Ephemeris library , which implements truncated VSOP87 (planets) and ELP2000 (Moon) series for high-accuracy celestial calculations entirely within Pine Script.
█ FEATURES
• Anchor Point System — Select any significant price pivot (high or low) as your reference point; all subsequent pivot tracking begins from this timestamp
• All 10 celestial bodies — Sun, Moon, Mercury, Venus, Mars, Jupiter, Saturn, Uranus, Neptune, and Pluto
• Geocentric or Heliocentric views — Toggle between Earth-centered (traditional) and Sun-centered perspectives
• Interactive Square of Nine table — Visual grid displaying the Gann spiral pattern with highlighted pivot degrees
• Automatic pivot detection — Configurable bar sensitivity to identify price pivots (symmetric left/right)
• Pivot degree labeling — Each detected pivot displays the planet's ecliptic longitude (0-360°) at that moment
• Target degree alerts — Define specific So9 degrees to watch; triggers alerts when the planet crosses them
• Preset So9 angles — Quick selection of degrees along major So9 lines (0°, 45°, 90°, 135°, 180°, 225°, 270°, 315°)
• Custom degree input — Enter any degrees as comma-separated or newline-separated values
• Future degree projections — Scans up to 500 bars ahead and shows when the planet will reach each target degree
• Retrograde indicator — Shows ℞ symbol with red text when planets are in apparent retrograde motion
• So9 overlay tools — Plot 90° and 45° angle relationships from any entered degree
█ HOW IT WORKS
The Square of Nine Concept:
Gann's Square of Nine is a spiral grid where numbers flow outward from the center (1) in a square spiral pattern. Key angle relationships (0°, 45°, 90°, etc.) align along specific diagonals and cardinal lines. When planetary degrees land on the same So9 position as significant price pivots, it suggests potential support/resistance levels.
This Indicator:
1. User selects an "anchor" timestamp at a significant price pivot
2. The indicator calculates the selected planet's ecliptic longitude (0-360°) at each bar
3. Price pivots detected after the anchor are labeled with their planetary degrees
4. These degrees accumulate on the So9 grid, revealing patterns
5. Target degrees can be set to receive alerts when crossed
6. Future projections show when the planet will reach those target degrees
█ HOW TO USE
1. Click on the anchor timestamp input and select a significant high or low pivot on your chart
2. Choose "High" or "Low" pivot type based on your anchor point
3. Select your planet from the dropdown
4. Choose Geocentric (traditional) or Heliocentric view
5. The So9 table appears showing accumulated pivot degrees highlighted
6. Set target degrees using presets or custom input to receive crossing alerts
7. Future projections appear as vertical lines with date/time labels
8. Use the So9 overlay tools to visualize angle relationships from specific degrees
█ VISUAL GUIDE
So9 Table Colors:
• Anchor degree: White (⚓ symbol)
• Current planet position: Planet's assigned color with symbol
• Pivot Highs: Green background
• Pivot Lows: Red background
• Equal (both high and low): Orange background
• Diagonal crosses: Blue background
• Cardinal crosses: Red background
• Target degrees: Yellow highlight
Chart Labels:
• Pivot High labels appear above the price with the degree
• Pivot Low labels appear below the price with the degree
• Future projection lines: Yellow (upcoming) or Gray (already crossed since anchor)
█ SETTINGS OVERVIEW
1. Anchor Point — Set the starting pivot timestamp and type (High/Low)
2. Planet Selection — Choose celestial body and coordinate system
3. Target Degree Alerts — Configure which degrees to watch and receive alerts
4. Pivot Detection — Set bar sensitivity for pivot high/low detection and degree rounding precision
5. Visual Style — Customize colors and label sizes
6. So9 Grid Overlay — Enter a degree to visualize its angular relationships
7. So9 Table — Position, sizing, and color options for the grid
8. So9 Diagonals — Toggle and color the diagonal/cardinal cross highlights
█ LIMITATIONS & ACCURACY
This indicator uses optimized VSOP87 and ELP2000 series tailored for Pine Script performance. It delivers excellent accuracy for trading and analytical purposes.
Expected Accuracy:
• Sun, Moon, Mercury, Venus, Mars: Within 1-10 arcseconds
• Jupiter, Saturn: Within 10-30 arcseconds
• Uranus, Neptune: Within 1-2 arcminutes
• Pluto: Simplified Meeus method (valid 1900-2100)
Degree Resolution:
The So9 grid uses integer degrees (1-361). Planetary positions are rounded to the nearest whole degree for grid placement. Precise decimal degrees are retained for crossing calculations and alerts.
Crossing Detection:
Future projection lines and background highlights both point to the confirmation bar—the first bar where the crossing can be verified. Alerts also trigger on this bar. This ensures all visual elements align consistently: when the chart reaches a future projection line, that bar closes with the crossing confirmed and highlighted.
█ CREDITS
• Square of Nine grid visualization adapted from ThiagoSchmitz's "Gann Square of 9" (Feb 2023)
• Ephemeris calculations via BlueprintResearch/lib_ephemeris open-source library
Astrotrading

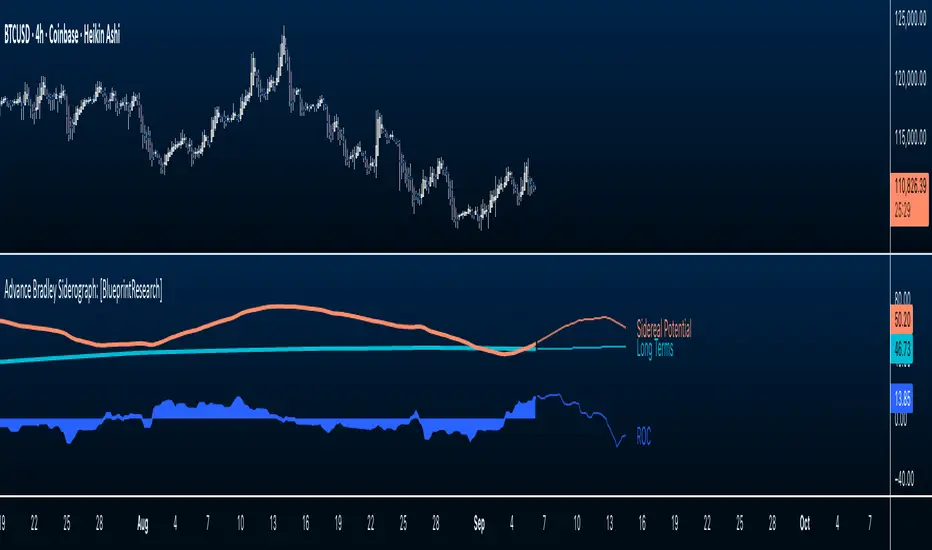
Advance Bradley Siderograph: [BlueprintResearch]🔭 Advanced Bradley Siderograph
What it is
A research indicator that computes Bradley’s terms with a private planetary ephemeris, then projects the curves forward on your chart. The ephemeris is my own library, built from scratch, with arc-second targets across modeled planets. The libraries supports both geocentric and heliocentric calculations; this model uses geocentric only. In addition to the core Bradley line, the script plots a derived rate-of-change (ROC) curve to surface acceleration, slowing, and zero crossings.
How it works
The indicator evaluates geocentric planetary relationships for each bar using my ephemeris, applies Bradley’s long-term, mid-term, and declination components, and combines them into a sidereal potential line. Aspect influence is controlled by an orb setting and component weights. Future projections are deterministic: the script computes planetary positions for bars ahead and carries the same component math into the forward window so you can see the curve beyond the last bar. The ROC curve is derived directly from the projected and historical Bradley line.
Key features
• Private planetary ephemeris with local computation and no network calls
• Future projections for all curves up to 500 bars ahead
• Rate-of-change line for acceleration, slowdowns, and inflection risk
• Component controls for long-term, mid-term, and declination with independent visibility and weights
• Display controls for colors, opacity, smoothing, and label size
Inputs
• Aspect orb (± degrees): 0 to 15
• Look-ahead bars: up to 500
• Component multipliers for long-term and ROC scaling
• Visibility toggles for sidereal potential, long-term, mid-term, declination, and ROC
• Text size: Auto, Tiny, Small, Normal, Large
Interpretation notes
This is a contextual barometer for planning and study. It does not generate trade signals. Combine the Bradley line and ROC with your own forecasting frameworks for timing and risk management.
Originality and provenance
This invite-only script runs on a planetary ephemeris library I built from the ground up. No portion of TradingView’s open-source Astrolib is used. There are no Astrolib functions, no imported third-party planetary libraries, and no external API calls. I can provide code-source evidence to TradingView moderators on request.
My open-source Bradley Siderograph on TradingView was released for education and backtesting and intentionally omitted forward projections. The number one user request has been to see the curve ahead. This advanced edition delivers that capability by projecting the Bradley line and components forward in time, up to 500 bars. To my knowledge, forward planetary projections of this kind are rare on the platform, and this edition was created specifically to provide that functionality while keeping the educational version separate and open.
Lineage
To my knowledge, I brought the first open-source Bradley Siderograph to TradingView since Donald A. Bradley’s 1947 work. This edition advances that effort with a private ephemeris, forward projections, and ROC.
Credits
Inspired by Donald A. Bradley’s planetary barometer.
Natal & Transit Planetary Aspect Table📐 Natal & Transit Planetary Aspect Table
This open-source TradingView indicator displays a customizable table of astrological aspects between natal (first trade or custom date) planetary positions and current/live transits. Built in Pine Script v6, it leverages the AstroLib library for accurate geocentric or heliocentric longitude calculations, supporting a range of financial assets and historical events. Ideal for astro-finance enthusiasts, it highlights major and minor aspects with orbs, applying/separating status, and color-coded visuals. Supports 10 planetary bodies in geocentric mode (Sun, Moon, Mercury, Venus, Mars, Jupiter, Saturn, Uranus, Neptune, Pluto) or 11 in heliocentric mode (adds Earth).
Why Use This Indicator?
Astrology offers a unique lens for market analysis by examining planetary alignments relative to an asset's "birth" date (e.g., first trade), potentially revealing cycles, trends, and timing insights that complement technical and fundamental strategies. This tool empowers traders to integrate astro-finance principles, visualizing cosmic influences that may correlate with price movements, reversals, or volatility—backed by historical presets and customizable options for personalized research.
Key Features:
- 23 preset natal dates for assets like BTC, ETH, NYSE, and more (e.g., BTC genesis block on 2009-01-03), with credits to Susan Abbott Gidel for most of the first trade dates from her book " Trading In Sync With Commodities: Introducing Astrology To Your Technical Toolbox ."
- Manual natal and transit timestamp inputs for flexibility.
- Supports geocentric (default) or heliocentric views (displayed as 𝒢 or ℋ in the table), with adjustable observer location (latitude, longitude, timezone).
- Configurable aspects: Conjunction (☌), Opposition (☍), Trine (△), Square (□), Sextile (⚹), and minors like Semi-Sextile (⚺), Quincunx (⚻), etc., with user-defined orbs and colors.
- Applying (a) or separating (s) status is determined by comparing the orb on the current bar to the previous one—if decreasing, applying; if increasing, separating. This simplified approach may differ from traditional astrological methods that consider planetary speeds, directions (direct/retrograde), and which body is faster/slower.
- Table displays planet symbols or names, degrees/signs with tooltips showing exact longitude (e.g., hovering over a planet symbol reveals its precise degree), and aspect symbols/tags (e.g., ⚹a for applying sextile).
- Tooltip on the dates cell to view the exact transit and natal dates for easy tracking.
- Live mode updates with chart timeframe; test mode allows the user to move the transit date historically or to the future via a custom timestamp.
- Customizable table position, text size, colors, and visibility.
How to Use:
1. Add the indicator to your TradingView chart.
2. Select a preset or manual natal date in settings.
3. Choose live transits or test mode with a custom timestamp.
4. Enable/disable aspects and adjust orbs/colors as needed.
5. Hover over cells for detailed tooltips (e.g., exact orb and applying/separating status).
Powered by @BarefootJoey AstroLib for ephemeris data. For best accuracy, verify positions against external sources.

Astro | Angular Distance | θAstro | Angular Distance | θ
Also known as Angular Separation , Apparent Distance , or Apparent Separation is the angle between the two sightlines, or between two point objects as viewed from an observer, in our case we can use it as Geocentric/Heliocentric prospective calculated from a combination of some trigonometry functions
We can use it to calculate the Angular Distance between two planets.
How to use it:
- 1st Ascension : The Right Ascension of the first object expressed in degrees.
- 1st Declination : The Declination of the first object expressed in degrees.
- 2nd Ascension : The Right Ascension of the second object expressed in degrees.
- 2nd Declination : The Declination of the second object expressed in degrees.
The result ll'be returned near the table "Angulare Distance" and all the values entered will be plotted on the table in top-right position of the screen.

Planetary Signs█ OVERVIEW
This script is designed to highlight planetary signs. All 12 signs on all planets going from Mercury to Pluto on both Geocentric and Heliocentric settings.
If you are an astrology trader or if you do trade cycles, this script might be great for you because it highlights all these cycles automatically.
You can select one sign or multiple signs at once, you are also able to change the color of the cycle. It should work on all time frame but with future dates it's only set to daily resolution at the moment. Current time is in sync perfectly to the minute when the sign change.
█ Future Plans and upgrades to this script may include :
1. Increase future resolution; it's set to 120 days into the future with daily resolution.
2. More styling and labeling options
And more! Feel free to contact me with any feature that you would like to see in this script
█ How to use :
1. Open the settings.
2. Select the planet.
3. Enable your favorite sign or signs.
Then Press OK & give the script a few seconds and you should be set. You can add this script to your chart more than once!
This script is coded as an addon to the Gann ToolBox package/scripts.

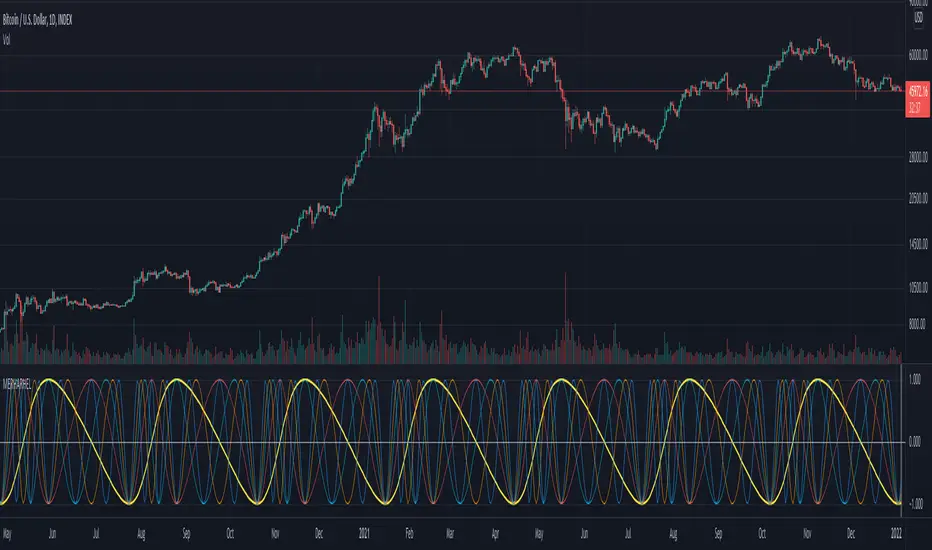
Financial Astrology Venus Helio HarmonicsVenus Helio Harmonics indicator represent the tropical zodiac energy forces that develop through the course of Venus in the heliocentric zodiac wheel. The waves indicates the strength of cardinal energy (initiator) and theirs harmonics. In Financial Astrology, Venus rules speculation, bets, entertainment (gamblers traders) and fashion.
Note: The Venus Helio Harmonics indicator is based on an ephemeris array that covers years 2010 to 2030, prior or after this years the data is not available, this daily ephemeris are based on UTC time so in order to align properly with the price bars times you should set UTC as your chart timezone.

Financial Astrology Mercury Helio HarmonicsMercury Helio Harmonics indicator represent the tropical zodiac energy forces that develop through the course of Mercury in the heliocentric zodiac wheel. The waves indicates the strength of cardinal energy (initiator) and it's harmonics. In Financial Astrology, Mercury represents the commerce, negotiations, transactions and trading, is very important cycle for trading.
Note: The Mercury Helio Harmonics indicator is based on an ephemeris array that covers years 2010 to 2030, prior or after this years the data is not available, this daily ephemeris are based on UTC time so in order to align properly with the price bars times you should set UTC as your chart timezone.
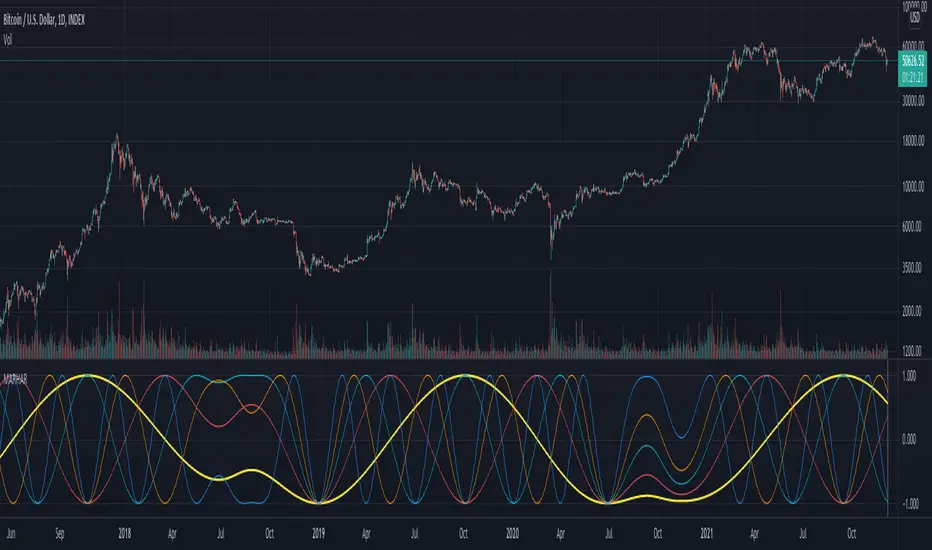
Financial Astrology Pluto HarmonicsPluto Harmonics indicator represent the tropical zodiac energy forces that develop through the course of Pluto in the tropical zodiac wheel. The waves indicates the strength of cardinal energy (initiator) and this forces seems to correlate well with the most relevant pivot points. In Financial Astrology, Pluto rules the transformations, intense actions (no limits), issues with control and power, excess, destruction.
Note: The Pluto Harmonics indicator is based on an ephemeris array that covers years 2010 to 2030, prior or after this years the data is not available, this daily ephemeris are based on UTC time so in order to align properly with the price bars times you should set UTC as your chart timezone.

Financial Astrology Neptune HarmonicsNeptune Harmonics indicator represent the tropical zodiac energy forces that develop through the course of Neptune in the tropical zodiac wheel. The waves indicates the strength of cardinal energy (initiator) and this forces seems to correlate well with the most relevant pivot points. In Financial Astrology, Neptune rules charity, confusion, imagination, waste, crime, intuition, occult, scandal, illusion, financial bubbles, scams, and dreams.
Note: The Neptune Harmonics indicator is based on an ephemeris array that covers years 2010 to 2030, prior or after this years the data is not available, this daily ephemeris are based on UTC time so in order to align properly with the price bars times you should set UTC as your chart timezone.

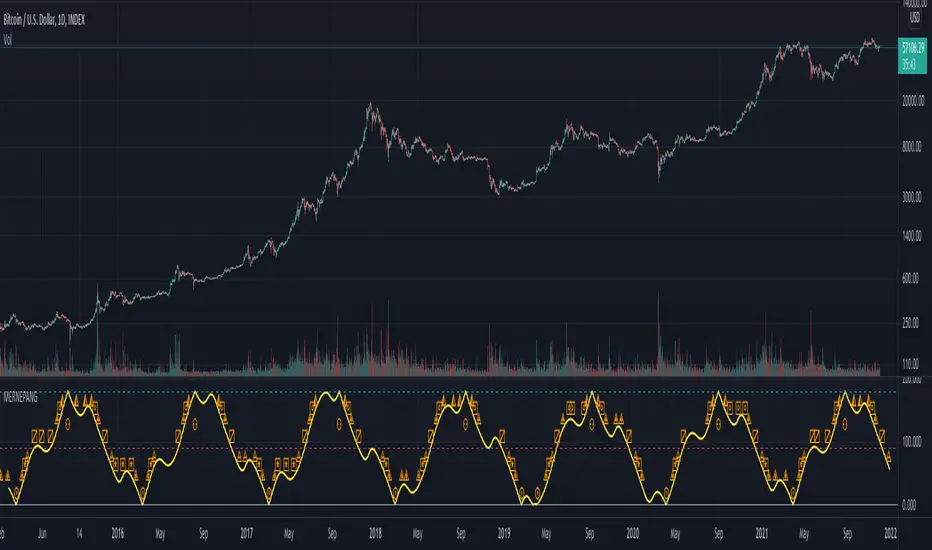
Financial Astrology Vesta HarmonicsVesta (asteroid) Harmonics indicator represent the tropical zodiac energy forces that develop through the course of Vesta in the tropical zodiac wheel. The waves indicates the strength of cardinal energy (initiator) and this forces seems to correlate well with the most relevant pivot points. In Financial Astrology, Vesta rules the creative energy, aspirations, goals and security business
Note: The Vesta Harmonics indicator is based on an ephemeris array that covers years 2010 to 2030, prior or after this years the data is not available, this daily ephemeris are based on UTC time so in order to align properly with the price bars times you should set UTC as your chart timezone.

Financial Astrology Ceres HarmonicsCeres Harmonics indicator represent the tropical zodiac energy forces that develop through the course of Ceres in the tropical zodiac wheel. The waves indicates the strength of cardinal energy (initiator) and this forces seems to correlate well with the most relevant pivot points. In Financial Astrology, Ceres rules growing, nutrition, food, farming and prosperity.
Note: The Ceres Harmonics indicator is based on an ephemeris array that covers years 2010 to 2030, prior or after this years the data is not available, this daily ephemeris are based on UTC time so in order to align properly with the price bars times you should set UTC as your chart timezone.

Financial Astrology Uranus HarmonicsUranus Harmonics indicator represent the tropical zodiac energy forces that develop through the course of Uranus in the tropical zodiac wheel. The waves indicates the strength of cardinal energy (initiator) and this forces seems to correlate well with the most relevant pivot points. In Financial Astrology, Uranus rules change, innovation, disruption, inventions, revolutions and technology.
Note: The Uranus Harmonics indicator is based on an ephemeris array that covers years 2010 to 2030, prior or after this years the data is not available, this daily ephemeris are based on UTC time so in order to align properly with the price bars times you should set UTC as your chart timezone.

Financial Astrology Saturn HarmonicsSaturn Harmonics indicator represent the tropical zodiac energy forces that develop through the course of Saturn in the tropical zodiac wheel. The waves indicates the strength of cardinal energy (initiator) and this forces seems to correlate well with the most relevant pivot points. In Financial Astrology, Saturn rules temperance, rectitude, constancy, greed, fear and pessimism.
Note: The Saturn Harmonics indicator is based on an ephemeris array that covers years 2010 to 2030, prior or after this years the data is not available, this daily ephemeris are based on UTC time so in order to align properly with the price bars times you should set UTC as your chart timezone.

Financial Astrology Jupiter HarmonicsJupiter Harmonics indicator represent the tropical zodiac energy forces that develop through the course of Jupiter in the tropical zodiac wheel. The waves indicates the strength of cardinal energy (initiator) and this forces seems to correlate well with the most relevant pivot points . In Financial Astrology, Jupiter rules expansion, optimism, enthusiasm, joviality and devotion.
Note: The Jupiter Harmonics indicator is based on an ephemeris array that covers years 2010 to 2030, prior or after this years the data is not available, this daily ephemeris are based on UTC time so in order to align properly with the price bars times you should set UTC as your chart timezone.

Financial Astrology Mars HarmonicsMars Harmonics indicator represent the tropical zodiac energy forces that develop through the course of Mars in the tropical zodiac wheel. The waves indicates the strength of cardinal energy (initiator) and this forces seems to correlate well with the most relevant pivot points. In Financial Astrology, Mars rules impulsive/risky action, entrepreneurship, aggression, explosion and passion. Observe carefully the waves cycles in your favourite instruments.
Note: The Mars Harmonics indicator is based on an ephemeris array that covers years 2010 to 2030, prior or after this years the data is not available, this daily ephemeris are based on UTC time so in order to align properly with the price bars times you should set UTC as your chart timezone.
Financial Astrology Moon HarmonicsMoon Harmonics indicator represent the tropical zodiac energy forces that develop through the course of Moon in the tropical zodiac wheel. The waves indicates the strength of cardinal energy (initiator) and this forces seems to correlate well with the most relevant pivot points. Consider that Moon rules the emotions, instinctive reactions, the flow of the energy from our inner to the outer world.
Note: The Moon Harmonics indicator is based on an ephemeris array that covers years 2010 to 2030, prior or after this years the data is not available, this daily ephemeris are based on UTC time so in order to align properly with the price bars times you should set UTC as your chart timezone.

Financial Astrology Mercury-Pluto Longitude AngleMercury-Pluto angle indicator represent the geocentric longitude angular distance between Mercury and Pluto with labels on the angles that indicate the astrological aspects used by financial astrologers to determine the energy trigger points. In financial astrology, Mercury rules trading, market transactions, commerce and negotiation. Pluto rules the transformations, intense actions (no limits), issues with control and power, excess, destruction.
For any Mercury aspects indicator we recommend to use 4H resolution to locate the exact aspect culmination, this is because Mercury moves at an average geocentric speed of 1.6 degrees per day.
Due to the limited UTF (Unicode Transformation Format) support of classical astrology aspects symbols, we needed to use a custom subset to represent the aspects:
⊚ = 0 degrees angle (conjuction)
⧌ = 30 degrees angle (semi-sextile)
⧆ = 45 degrees angle (semi-square)
⨺ = 60 degrees angle (sextile)
⧄ = 90 degrees angle (square)
⨹ = 120 degrees angle (trine)
⧇ = 135 degrees angle (sesqui-square)
◭ = 150 degrees angle (quincunx or inconjunct)
⚇ = 180 degrees angle (opposition)
Note: The Mercury-Pluto longitude angle indicator is based on an ephemeris array that covers years 2010 to 2030, prior or after this years the data is not available, this daily ephemeris are based on UTC time so in order to align properly with the price bars times you should set UTC as your chart timezone.

Financial Astrology Mercury-Neptune Longitude AngleMercury-Neptune angle indicator represent the geocentric longitude angular distance between Mercury and Neptune with labels on the angles that indicate the astrological aspects used by financial astrologers to determine the energy trigger points. In financial astrology, Mercury rules trading, market transactions, commerce and negotiation. Neptune rules charity, confusion, imagination, waste, crime, intuition, occult, scandal, illusion, financial bubbles, scams, and dreams.
For any Mercury aspects indicator we recommend to use 4H resolution to locate the exact aspect culmination, this is because Mercury moves at an average geocentric speed of 1.6 degrees per day.
Due to the limited UTF (Unicode Transformation Format) support of classical astrology aspects symbols, we needed to use a custom subset to represent the aspects:
⊚ = 0 degrees angle (conjuction)
⧌ = 30 degrees angle (semi-sextile)
⧆ = 45 degrees angle (semi-square)
⨺ = 60 degrees angle (sextile)
⧄ = 90 degrees angle (square)
⨹ = 120 degrees angle (trine)
⧇ = 135 degrees angle (sesqui-square)
◭ = 150 degrees angle (quincunx or inconjunct)
⚇ = 180 degrees angle (opposition)
Note: The Mercury-Neptune longitude angle indicator is based on an ephemeris array that covers years 2010 to 2030, prior or after this years the data is not available, this daily ephemeris are based on UTC time so in order to align properly with the price bars times you should set UTC as your chart timezone.
Financial Astrology Mercury-Uranus Longitude AngleMercury-Uranus angle indicator represent the geocentric longitude angular distance between Mercury and Uranus with labels on the angles that indicate the astrological aspects used by financial astrologers to determine the energy trigger points. In financial astrology, Mercury rules trading, market transactions, commerce and negotiation. Uranus rules change, innovation, disruption, inventions, revolutions and technology.
For any Mercury aspects indicator we recommend to use 4H resolution to locate the exact aspect culmination, this is because Mercury moves at an average geocentric speed of 1.6 degrees per day.
Due to the limited UTF (Unicode Transformation Format) support of classical astrology aspects symbols, we needed to use a custom subset to represent the aspects:
⊚ = 0 degrees angle (conjuction)
⧌ = 30 degrees angle (semi-sextile)
⧆ = 45 degrees angle (semi-square)
⨺ = 60 degrees angle (sextile)
⧄ = 90 degrees angle (square)
⨹ = 120 degrees angle (trine)
⧇ = 135 degrees angle (sesqui-square)
◭ = 150 degrees angle (quincunx or inconjunct)
⚇ = 180 degrees angle (opposition)
Note: The Mercury-Uranus longitude angle indicator is based on an ephemeris array that covers years 2010 to 2030, prior or after this years the data is not available, this daily ephemeris are based on UTC time so in order to align properly with the price bars times you should set UTC as your chart timezone.

Financial Astrology Mercury-Saturn Longitude AngleMercury-Saturn angle indicator represent the geocentric longitude angular distance between Mercury and Saturn with labels on the angles that indicate the astrological aspects used by financial astrologers to determine the energy trigger points. In financial astrology, Mercury rules trading, market transactions, commerce and negotiation. Saturn rules temperance, rectitude, constancy, greed, fear and pessimism.
For any Mercury aspects indicator we recommend to use 4H resolution to locate the exact aspect culmination, this is because Mercury moves at an average geocentric speed of 1.6 degrees per day.
Due to the limited UTF (Unicode Transformation Format) support of classical astrology aspects symbols, we needed to use a custom subset to represent the aspects:
⊚ = 0 degrees angle (conjuction)
⧌ = 30 degrees angle (semi-sextile)
⧆ = 45 degrees angle (semi-square)
⨺ = 60 degrees angle (sextile)
⧄ = 90 degrees angle (square)
⨹ = 120 degrees angle (trine)
⧇ = 135 degrees angle (sesqui-square)
◭ = 150 degrees angle (quincunx or inconjunct)
⚇ = 180 degrees angle (opposition)
Note: The Mercury-Saturn longitude angle indicator is based on an ephemeris array that covers years 2010 to 2030, prior or after this years the data is not available, this daily ephemeris are based on UTC time so in order to align properly with the price bars times you should set UTC as your chart timezone.

Financial Astrology Mercury-Jupiter Longitude AngleMercury-Jupiter angle indicator represent the geocentric longitude angular distance between Mercury and Jupiter with labels on the angles that indicate the astrological aspects used by financial astrologers to determine the energy trigger points. In financial astrology, Mercury rules trading, market transactions, commerce and negotiation. Jupiter rules expansion, optimism, enthusiasm, joviality and devotion.
For any Mercury aspects indicator we recommend to use 4H resolution to locate the exact aspect culmination, this is because Mercury moves at an average geocentric speed of 1.6 degrees per day.
Due to the limited UTF (Unicode Transformation Format) support of classical astrology aspects symbols, we needed to use a custom subset to represent the aspects:
⊚ = 0 degrees angle (conjuction)
⧌ = 30 degrees angle (semi-sextile)
⧆ = 45 degrees angle (semi-square)
⨺ = 60 degrees angle (sextile)
⧄ = 90 degrees angle (square)
⨹ = 120 degrees angle (trine)
⧇ = 135 degrees angle (sesqui-square)
◭ = 150 degrees angle (quincunx or inconjunct)
⚇ = 180 degrees angle (opposition)
Note: The Mercury-Jupiter longitude angle indicator is based on an ephemeris array that covers years 2010 to 2030, prior or after this years the data is not available, this daily ephemeris are based on UTC time so in order to align properly with the price bars times you should set UTC as your chart timezone.

Financial Astrology Mercury-Vesta Longitude AngleMercury-Vesta angle indicator represent the geocentric longitude angular distance between Mercury and Vesta with labels on the angles that indicate the astrological aspects used by financial astrologers to determine the energy trigger points. In financial astrology, Mercury rules trading, market transactions, commerce and negotiation. Vesta rules the creative energy, aspirations, goals and security business.
For any Mercury aspects indicator we recommend to use 4H resolution to locate the exact aspect culmination, this is because Mercury moves at an average geocentric speed of 1.6 degrees per day.
Due to the limited UTF (Unicode Transformation Format) support of classical astrology aspects symbols, we needed to use a custom subset to represent the aspects:
⊚ = 0 degrees angle (conjuction)
⧌ = 30 degrees angle (semi-sextile)
⧆ = 45 degrees angle (semi-square)
⨺ = 60 degrees angle (sextile)
⧄ = 90 degrees angle (square)
⨹ = 120 degrees angle (trine)
⧇ = 135 degrees angle (sesqui-square)
◭ = 150 degrees angle (quincunx or inconjunct)
⚇ = 180 degrees angle (opposition)
Note: The Mercury-Vesta longitude angle indicator is based on an ephemeris array that covers years 2010 to 2030, prior or after this years the data is not available, this daily ephemeris are based on UTC time so in order to align properly with the price bars times you should set UTC as your chart timezone.
Financial Astrology Mercury-Ceres Longitude AngleMercury-Ceres angle indicator represent the geocentric longitude angular distance between Mercury and Ceres with labels on the angles that indicate the astrological aspects used by financial astrologers to determine the energy trigger points. In financial astrology, Mercury rules trading, market transactions, commerce and negotiation. Ceres rules growing, nutrition, food, farming and prosperity.
For any Mercury aspects indicator we recommend to use 4H resolution to locate the exact aspect culmination, this is because Mercury moves at an average geocentric speed of 1.6 degrees per day.
Due to the limited UTF (Unicode Transformation Format) support of classical astrology aspects symbols, we needed to use a custom subset to represent the aspects:
⊚ = 0 degrees angle (conjuction)
⧌ = 30 degrees angle (semi-sextile)
⧆ = 45 degrees angle (semi-square)
⨺ = 60 degrees angle (sextile)
⧄ = 90 degrees angle (square)
⨹ = 120 degrees angle (trine)
⧇ = 135 degrees angle (sesqui-square)
◭ = 150 degrees angle (quincunx or inconjunct)
⚇ = 180 degrees angle (opposition)
Note: The Mercury-Ceres longitude angle indicator is based on an ephemeris array that covers years 2010 to 2030, prior or after this years the data is not available, this daily ephemeris are based on UTC time so in order to align properly with the price bars times you should set UTC as your chart timezone.
