Dashed Line Moving AveragesHere's a simple script which i concocted using ideas from various authors with the goal of creating a slightly better Moving Average dashed line script imo...I think i managed to do just that and a bit more.. =)
Features:
- Contains one of each VWMA SMA EMA. You can set the input length.
- Ability to set spacing between characters of the plotted moving average line
- Horizontal offset of the moving average lines (just in case)
- Can add any fancy characters that suits your taste e.g ( . , _ , -, !, *, rocket, lava, etc) to the moving average
- If you duplicate the script and modify the "Size" parameter of the plotchar() function's variables with the choices provided in the commented-out code; you can have some fun!
This script is for entertainment & educational purposes only.
Average

Aggregated Moving AveragesUsers can display moving averages from higher time frame charts and display them on their current chart. This script supports up to 4 moving averages aggregated from a selected time frame. Each plot can be toggled if the user does not wish to have all 4 plots displayed.
Inputs allow user to edit:
Moving average length
Average type
Color
Timeframe input allows user to select which timeframe the moving averages are calculated from.
If you wish to have multiple timeframes across different moving averages, it is recommended you add a separate copies of the indicator for each timeframe you wish to display. Toggle visibility of which plots which you don't need.
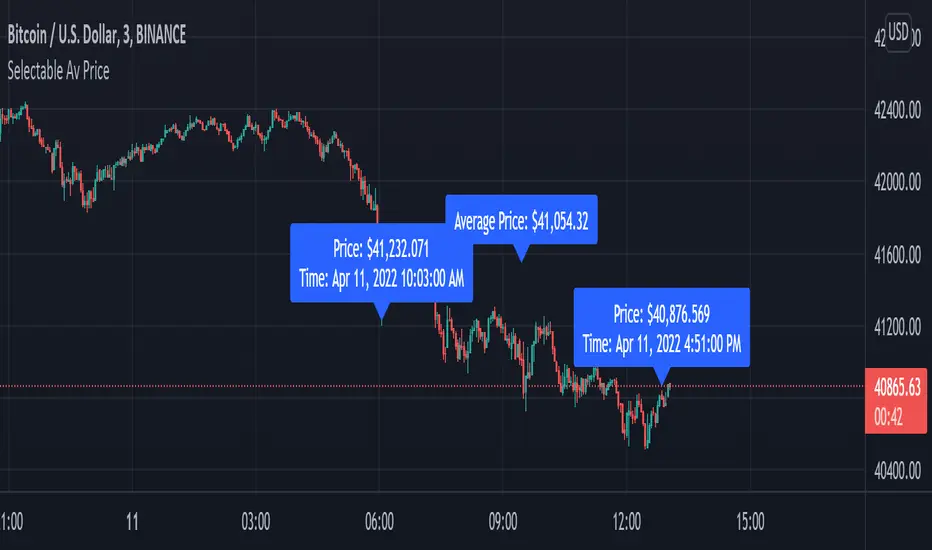
Average Price between Two PointsScript calculates & displays the average price of two selected points. Request from @Bosstradamus3 on Twitter.
This is a quick & dirty script that should be updated in the future.
If you use it and/or modify it, I'd love to hear about it.
Once the indicator is selected, click & drag the label base to reset starting & ending points.
To display label on top of bars, right click on it & select "Visual Order" → "Move to Front."
Bogdan Ciocoiu - GreuceanuDescription
This indicator is an entry-level script that simplifies volume interpretation for beginning traders.
It is a handy tool that removes all the noise and focuses traders on identifying potential smart money injections.
Uniqueness
This indicator is unique because it introduces the principle of a moving average in the context of volume and then compares it with tick-based volume.
Its uniqueness is reflected in the ability to colour code each volume bar based on the intensity of each relevant (volume) unit whilst comparing it with the volume moving average.
Another benefit of this indicator is the colour coding scheme that removes volume below a particular threshold (default set to 1) under the volume moving average.
In addition to the above features, the indicator differentiates the colour of each bar by price direction.
Open source re-use
To achieve this functionality several open source indicators have been used an integrated within the current one.
Bitcoin Risk Long Term indicatorOBJECTIVE:
The purpose of this indicator is to synthesize via an average several indicators from a wide choice with in order to simplify the reading of the bitcoin price and that on a long term vision.
Useful for those who want to see things simply, typically to make a smart DCA based on risk.
I originally used this script as a sandbox to understand and test the usefulness of several indicators, and to develop my PineScript skills, but finally the Risk Indicator output seems relevant so I decided to share it.
USAGE:
The selected indicators are the ones that I think give the best market bottoms, but the idea here is that anyone can try and use any set of indicators based on those preferences (post in comments if you find a relevant config)
Most of the indicator inputs are configurable. And some are not taken into account in the calculation of the Risk indicator because I consider them not relevant, this script is also a test more than a final version.
NOTES :
If you have any idea of adding an indicator, modification, criticism, bug found: share them, it is appreciated!
In the future I will create another more versatile Risk indicator that will not be focused on bitcoin in weekly. (this indicator is still usable on other assets and timeframe)
THANKS:
to Benjamin Cowen for inspiring me with his Bitcoin Risk metric
to Lazybear for his Wavetrend Indicator and all the scripts he shares
to Mabonyi for his Bitcoin Logarithmic Growth Curves & Zones script
to VuManChu for his VMC Cypher B Divergence
to the Trading view team for developing TV and PineScript
And to all the community for all the published codes that allowed me to progress and create this script
---- FR ----
OBJECTIF :
L'objectif de cet indicateur est de synthétiser via une moyenne plusieurs indicateurs parmi un large choix avec afin de simplifier la lecture du cours de bitcoin et cela sur une vision longue terme.
Utile pour ceux qui veulent voir les choses simplement, typiquement faire un DCA intelligent en fonction du risque.
À la base j'ai utilisé ce script comme un bac à sable pour comprendre puis tester l'utilité de plusieurs indicateurs, et développer mes compétences PineScript, mais finalement l'output Risk Indicateur me semble pertinent donc autant le partager.
UTILISATION :
Les indicateurs sélectionnés sont ceux qui permettent selon moi d'avoir les meilleurs point bas de marché, mais l'idée ici est que chacun puisse essayer et utiliser n'importe quel ensemble d'indicateur en fonction de ces préférences (poster en commentaire si vous trouvez une configuration pertinente)
La plupart des inputs indicateurs sont paramétrables. Et certains ne sont pas pris en compte dans le calcul du Risk indicateur car je les estime non pertinent, ce script est aussi un essai plus qu'une version finale.
NOTES :
Si vous avez la moindre idée d'ajout d'indicateur, modification, critique, bug trouvé : partagez-les, c'est apprécié !
à l'avenir je créerais un autre Risk indicator plus polyvalent qui ne sera pas focalisé sur bitcoin en weekly. (cet indicateur est tout de même utilisable sur d'autre actif et timeframe)
REMERCIEMENT :
à Benjamin Cowen pour m'avoir inspiré avec son Bitcoin Risk metric
à Lazybear pour son Wavetrend Indicator et globalement tout les scripts qu'il partage
à Mabonyi pour son script Bitcoin Logarithmic Growth Curves & Zones
à VuManChu pour son VMC Cypher B Divergence
à l'équipe Trading view pour avoir développé TV et PineScript
Et à toute la communauté pour tous les codes publiés qui m'ont permis de progresser et de créer ce script

High-pass filterHigh-pass filter | Pine Utilities series, ready to be used in "study-on-study" fashion |
Represents the difference between the filter and the original unfiltered data.
How to use:
1) Add a filter to your chart (in this particular case it was 4-pole Gaussian filter implemented by @everget, ty man);
2) Tap ... on your's filter status line and choose "Add study/strategy on ...", then choose High-pass filter. Alternatively, add high-pass filter directly to your chart, then High-pass filter's settings -> Basis -> choose the filter you've applied during the step 1;
3) Choose the source (op2 and hlcc4 are available as well);
4) See the difference (literally).
Peace TV

End Point Moving Average [EPMA]The End Point Moving Average was introduced in the October 95 issue of Technical Analysis of Stocks &
Commodities in the article "The End Point Moving Average", by Patrick E. Lafferty.
The Time Series Forecast takes this value and the slope of the regression line to forecast the next day and then plots this forecasted price as today's value.
For interpretation refer to Mr. Lafferty's article.
Please note
From line 10 starts my personal experemental modifications to this script, all above is original formula by Patrick E. Lafferty.

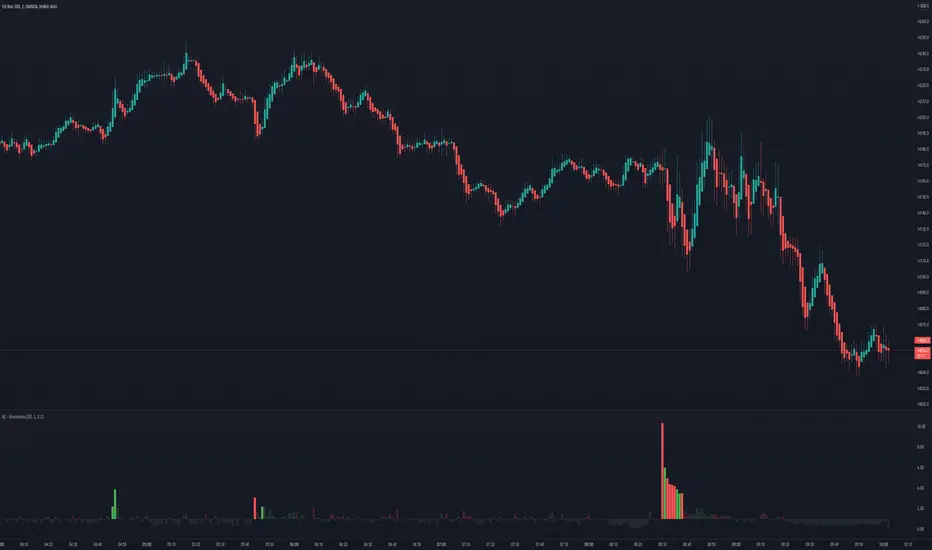
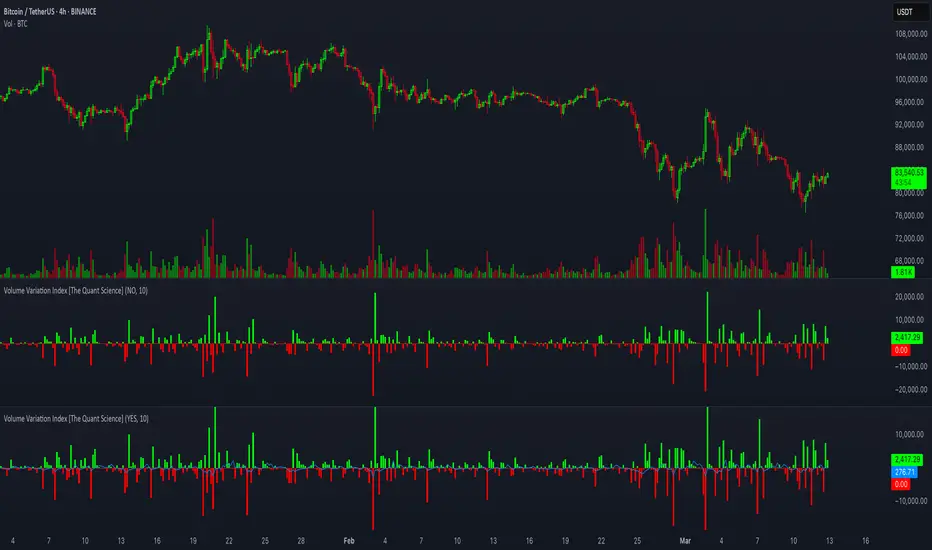
Volume Variation Index IndicatorThis tool is a quantitative tip for analysts who study volumes or create volume based trading strategies.
Like all our projects, we start with a statistical logic to which we add coding logic.
This indicator can save a huge amount of time in calculating the variation of volume between sessions .
How it work
The indicator calculates the difference between the volume of the last closing bar and the volume of the previous closing bar. It shows the difference between the trading volumes.
The session in which the trading volume is up are represented in green.
Red session represent trading volume down.
We have added a third function.
Through the User Interface the trader can activate or deactivate the variation average.
The indicator is able to calculate the average of the volume changes by representing it with a blue line.
To activate the average, simply set it to ON in the User Interface.
By default, the indicator calculates the average of the last 10 periods, but you are free to set this parameter in the User Interface.
Data access
To access the data, simply move the cursor. When you move the cursor over the green bars, the increase data will be displayed in green. By hovering the cursor over the red bars you will see the decrease data in red. By hovering the cursor over the average will show you the average data in blue.
The data is displayed in the top left corner of the indicator dashboard.
If you found this indicator helpful, please like our script.
Momentum RibbonThe Momentum Ribbon is a collection of Moving Averages which indicate the severity of pull-backs in a given market.
As the ribbon spreads apart, it indicates more and more significant support/resistance for a trending market. As it is compressed back together, it displays a blue colour to indicate a "cooling" of trend momentum.
Adjustable Moving Average periods and types! You can customize the parameters of your ribbon to your heart's content!

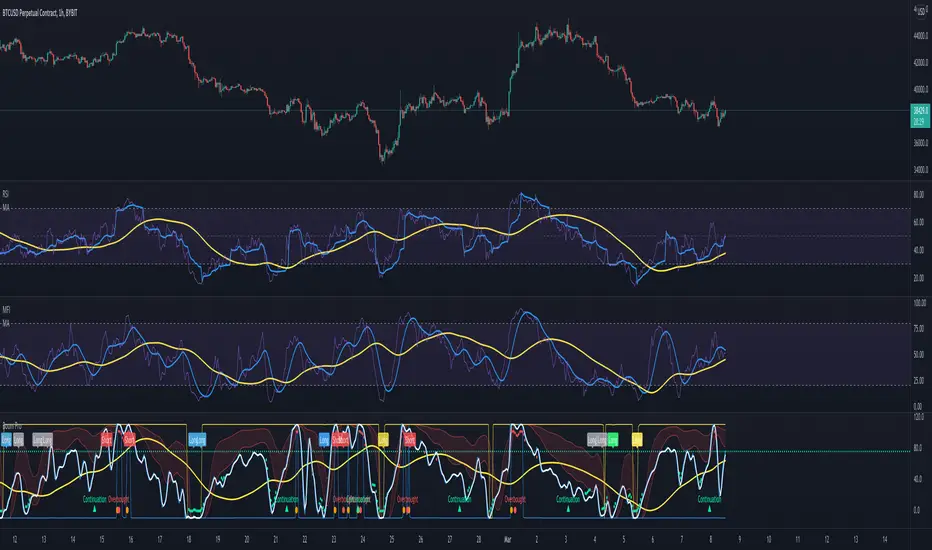
Moving Average Tool for IndicatorsThis indicator drops up to 2 moving average lines on top of any indicator. There are 11 different moving averages to choose from including 2 of my own, ZLSMA and WMA MOD. It also comes with a fixed scale option so you can lock it to an indicators scale. Simply click the enable button and enter the scale high and low of the indicator you want to track. In most cases it is 100-0. To use this moving average tool just load up any indicator like RSI or MFI etc then load up the Moving Average Tool for Indicators and drop it on top. In the settings choose the indicator you want to track in the source box. Now you can easily find entries and identify trends that were not so obvious.
This is a very handy tool that will extend the usability of all your indicators. It can even track other timeframes. Below is a screenshot working with Awesome Oscillator.
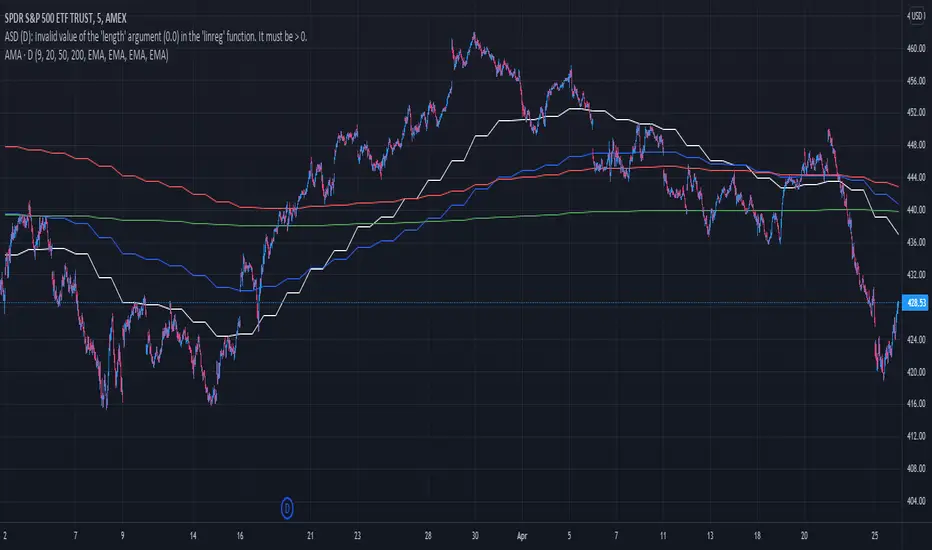
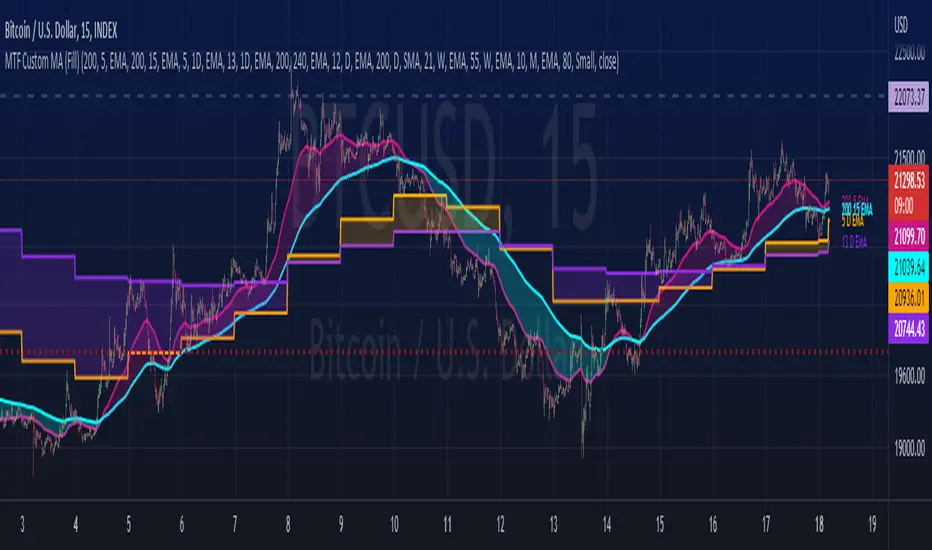
MTF Custom Moving AveragesThis user-friendly indicator allows up to 8 moving averages ( EMA or SMA ) from any timeframe, on any time frame. There are plenty of other MTF MA indicators, each with their own pros and cons. I wanted to make one without the cons:
- Independently set each MA to Exponential or Simple
- No preset lengths
- No preset timeframes
- Optional labels to help keep track of the period/length/type of each plot
- Clean, intuitive input layout
- More than enough MAs available to use one indicator for several use cases... just check/uncheck the ones that are relevant to each chart
Watch for death crosses on the 4hr while monitoring the "Bull Market Support band" (Weekly 21 EMA and 20 SMA ) and checking the Monthly 10 EMA for major support or resistance. Toggle between half of the available MAs for long term BTC trends and use the others for your alts. Use this one indicator to support multiple strategies.
Please leave a comment if you find it useful or have suggestions!
Inspired by the first MTF indicator I found: Weekly Moving Average by TommyTompsen.
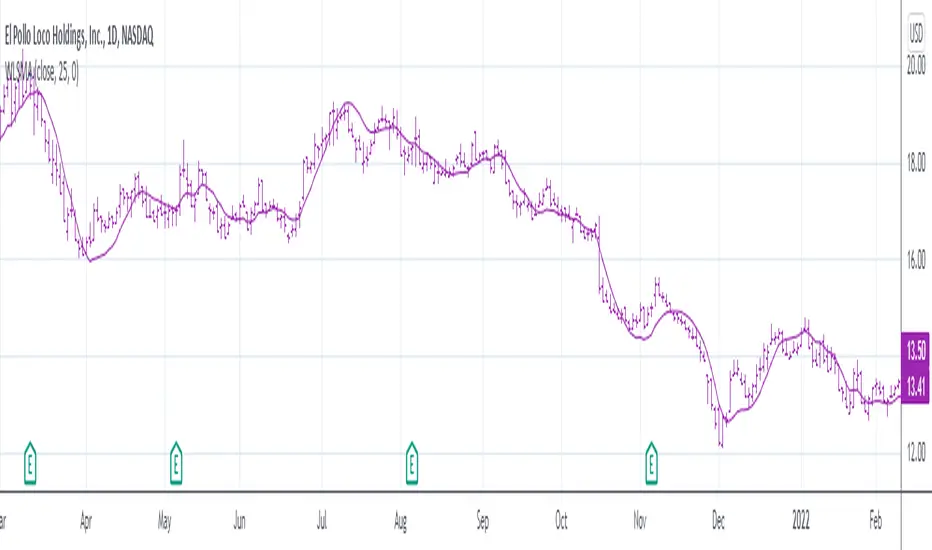
Weighted Least Squares Moving AverageLinearly Weighted Ordinary Least Squares Moving Regression
aka Weighted Least Squares Moving Average -> WLSMA
^^ called it this way just to for... damn, forgot the word
Totally pwns LSMA for some purposes here's why (just look up):
- 'realistically' the same smoothness;
- less lag;
- less overshoot;
- more or less same computationally intensive.
"Pretty cool, huh?", Bucky Roberts©, thenewboston
Now, would you please (just look down) and see the comparison of impulse & step responses:
Impulse responses
Step responses
Ain't it beautiful?
"Motivation behind the concept & rationale", by gorx1
Many been trippin' applying stats methods that require normally distributed data to time series, hence all these B*ll**** Bands and stuff don't really work as it should, while people blame themselves and buy snake oil seminars bout trading psychology, instead of using proper tools. Price... Neither population nor the samples are neither normally nor log-normally distributed. So we can't use all the stuff if we wanna get better results. I'm not talking bout passing each rolling window to a stat test in order to get the proper descriptor, that's the whole different story.
Instead we can leverage the fact that our data is time-series hence we can apply linear weighting, basically we extract another info component from the data and use it to get better results. Volume, range weighting don't make much sense (saying that based on both common sense and test results). Tick count per bar, that would be nice tho... this is the way to measure "intensity". But we don't have it on TV unfortunately.
Anyways, I'm both unhappy that no1 dropped it before me during all these years so I gotta do it myself, and happy that I can give smth cool to every1
Here is it, for you.
P.S.: the script contains standalone functions to calculate linearly weighted variance, linearly weighted standard deviation, linearly weighted covariance and linearly weighted correlation.
Good hunting
Ehlers Median Average Adaptive Filter [CC]The Median Average Adaptive Filter was created by John Ehlers and this is another in my current series of undiscovered gems. I'm sure you are all saying but Franklin, Ehlers doesn't have any undiscovered gems but in this case you would be wrong. This was actually an indicator so buried on the internet that I had to use the wayback machine to find the original source code. Ehlers notoriously hates adaptive moving averages which is funny because he has made a decent amount of them. This is a very unique indicator that uses a while loop to adjust the length and I thought it deserved some extra recognition from the TV community. I have included strong buy and sell signals in addition to normal ones so strong signals are darker in color and normal signals are lighter in color. Buy when the line turns green and sell when it turns red.
Let me know if there are any other scripts or indicators you would like to see me publish!

Average True Range (ATR) invisible price markers / linesThis script provides the ATR price when added to the top and bottom of the currently hovered candle.
The prices are shown top left next to the indicators' name.
This means you do not have to manually subtract or add ATR to price.
Line opacity allows you to show the lines where the ATR is, however, I recommend to keep this disabled.
Line type allows you to choose where ATR is calculated from (LowHigh or LowHighBody), the second ignoring the wicks, however LH is standard.
I also recommend to keep the other parameters as default.
I hope this indicator provides useful to you and your trading.

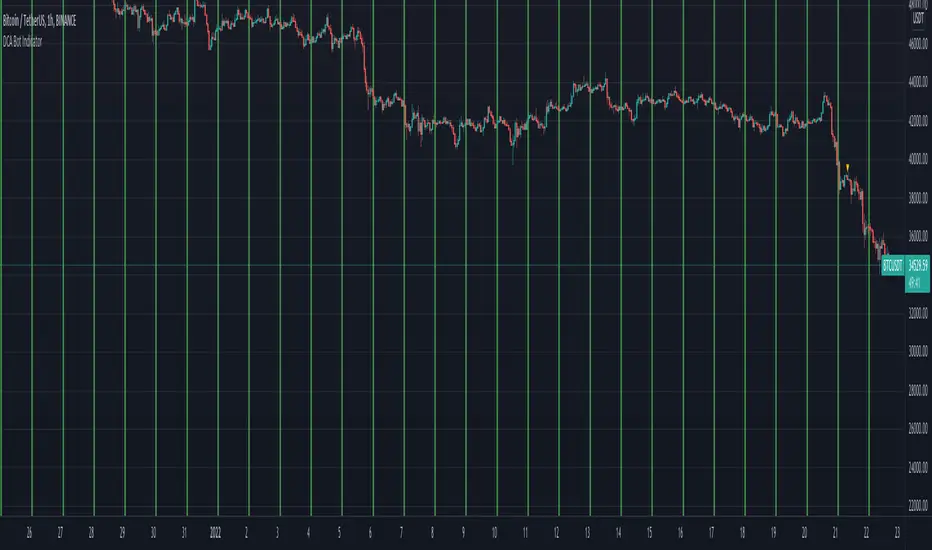
DCA Bot IndicatorName: DCA Bot Indicator
Category: Dollar Cost Average.
Operating mode: Alerts at a specific time, day of the week and day of the month.
Trades duration: N/A.
Timeframe: 1H
Suggested usage: long-term investing DCA strategies.
Entry: Only indicates the time and then the day of the week or the day of the month to buy.
Exit: As per long-term Investor’s strategy.
Usage: If you want to perform a Dollar Cost Averaging approach with:
- Daily purchases (at a specific time)
- Weekly purchases (at a specific time and day of the week)
- Monthly purchases (at a specific time and day of the month)
It is then possible to set the alert text with a preferred message or for use with trade automation systems. The green background identify the specific time chosen.
It is possible to identify through the Bias Analyzer the best time for the daily purchase.
Configuration:
- Buy Time: hour you would like to buy, please consider that the script is executed at the end of the defined time, so if you would like to buy at 2, have to put 1.
- Buy only Days of the Week: you can select the day you want.
- Buy only on Day of Month, you can specify a specific day.
Credits:
- dsteaves for inspiration
Moving average percent measureit's just an average moving multiplied by a percentage. this is good for measuring the acceleration of price movements

Мarket Breadth LabelsHistory and credits
The idea about this indicator, came from a friend teodorgun. www.tradingview.com
Special thanks to QuantNomad, whose courses got me started on programming on PineScript. www.tradingview.com
What it does
The indicator plots various values from market breadth indicators.
It shows the % stocks above certain moving averages for different indexes.
The first 3 cells, display the Advance Decline Ratios:
1. Total Advance Decline Ratio
2. NYSE Advance Decline Ratio
3. Nasdaq Advance Decline Ratio
- coloring for these is simple (value > threshold = color is green, value < threshold = color is red)
The rest of the columns display % stocks above the moving averages.
For example a value of 20 in column 4 ("Stocks above 5D MA), means that only 20% of the stocks are above their 5D moving average.
Line 1 shows current value of the indexes.
Line 2 shows value 5days ago (assuming that 5 trading days = 1 trading week).
- Line 1 Coloring: coloring here is divided between 2 tresholds ( value < lower treshold = color is red, value > lower treshold AND value < higher treshold = color is yellow, value > higher treshold = color is green)
- Line 2 Coloring: no coloring logic is applied here.
How to use it
There are several techniques for breadth indicators, many can be read online, but generally these indicators are considered contrarian. This means that high values indicate overbought conditions and low values indicate oversold conditions.

Average Candle RangeThis indicator calculates for you the average candle range for the current 24H trading session for the selected timeframe. The calculation starts from 00:00UTC until the current moment. The indicator is not time zone dependent, works well on every time zone.

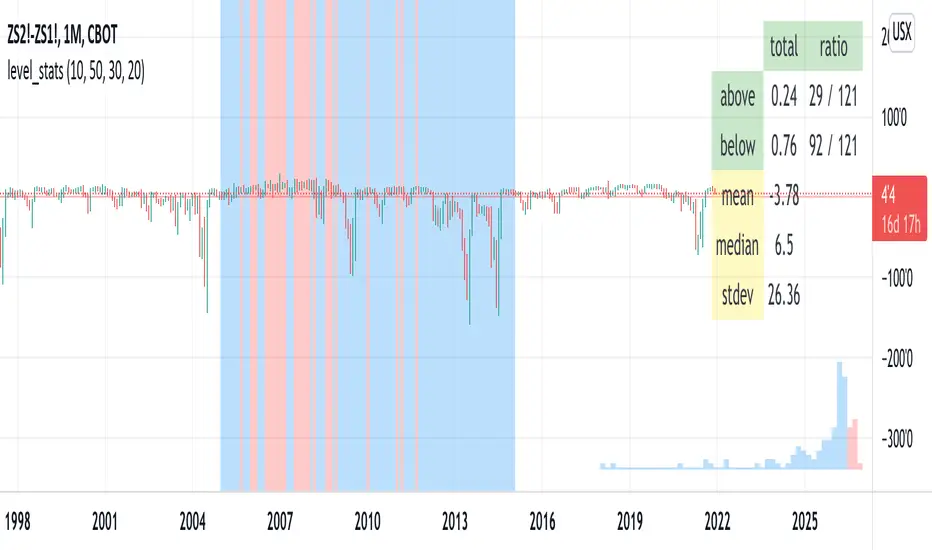
level_statsThis script tells you the percentage of time an instrument's closing value is above and below a level of your choosing. The background color visually indicates periods where the instrument closed at or above the level (red) and below it (blue). For "stationary-ish" processes, you can get a loose feel for the mean, high, and low values. The historical information conveyed through the background coloring can help you plan derivatives trades. Try with your favorite pairs, commodities, or volatility indices.
Usage: pick a level of interest using the input.
MAROC Fast/SlowNot sure if a similar indicator already exist, so I created my own. After creating this indicator, I realize it looks very similar to MACD. However, it strictly uses Hull moving average in its calculation for the lines.
MAROC is simply Moving Average Rate of Change. This is a trend-following indicator that calculates the rate of change on two Hull moving averages. By default it calculates the ROC on 60-period HMA (green and red) and 180-period HMA (blue and orange). The zero line represents the confirmation of change in trend. Above zero is up trend and below zero is down trend. Note the difference between the "trend reversal" and the "confirmation of a trend". I like to define trend reversal by the change in direction
The colored squares on the zero line has 4 colors that represents the overall trend. Here I include the slowdown of MAROC as the start of a trend.
- bright green = when both the slow and fast MA are trending up
- faded green = when slow MA trending up, but fast MA trending down
- faded red = when slow MA trending down, but fast MA trending up
- bright red = when both the slow MA and fast MA are trending down
Trend changes triangles are shown to signal the change in trend direction (trend reversal). Green and blue triangles are trend reversal to the upside. Red and orange triangles are trend reversal to the downside.
This indicator includes the option of displaying buy(long) and sell(short) signals that follows these rules. Use at your own discretion, as it may not apply well with your market or ticker.
- Long = Bright green square and either fast or slow MAROC changes trend direction to the upside
- Short = Bright red square and either fast or slow MAROC changes trend direction to the downside
Enjoy~! Please let me know if you find this useful and which market / ticker and timeframe you are using it on~ :)

Fibonacci Moving AverageThe Fibonacci Moving Average is a powerful indicator that takes into account many underlying moving averages to give out an approximate short-term/long-term view of the markets. Its strength lies with dynamic support and resistance levels. I have created this indicator in order to improve trend-following entry positions.

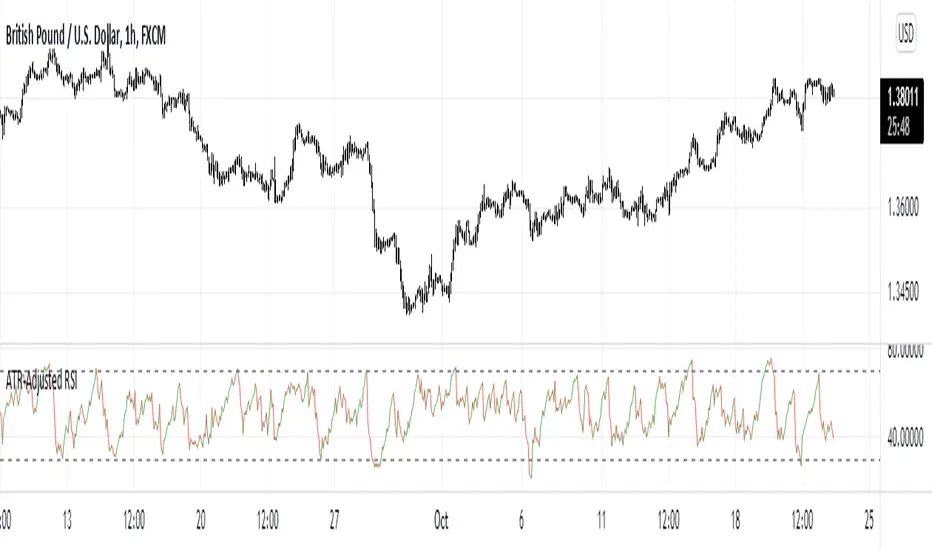
ATR-Adjusted RSIThis indicator adjusts the RSI values using the Average True Range. It is used the same way as a normal RSI.
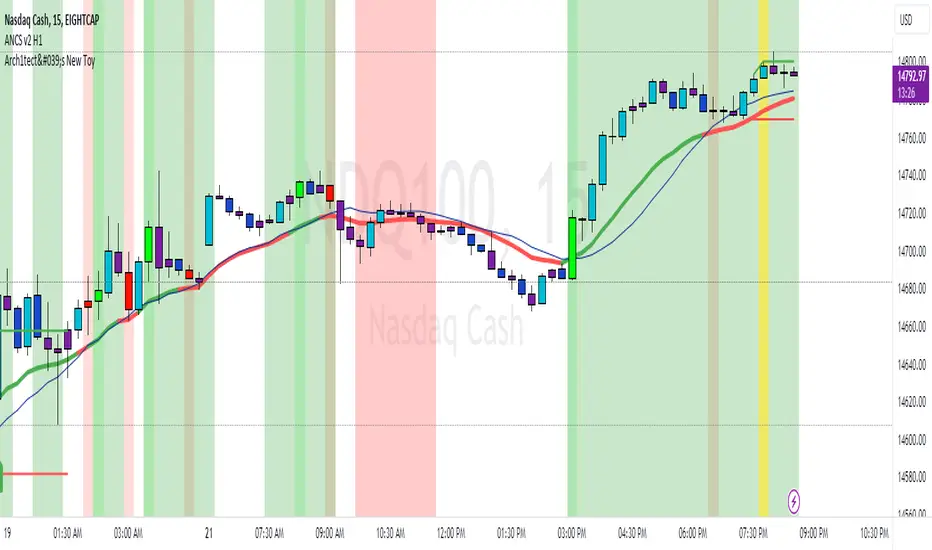
Arch1tect's New ToyDescription:
Arch1tect's New Toy tries to predict market trends by simply utilising 2 moving averages crossovers.
How it works:
Buy signals are triggered when the faster MA crosses over the slower MA from the downside to the upside.
Sell signals are triggered when the faster MA crosses under the slower MA from the upside to the downside.
How to use:
Take buys when buy signal is triggered AND close existing sell position
Take sells when sell signal is triggered AND close existing buy position
Note:
Settings are optimised for XAUUSD on the M1 chart.
Extra:
Alerts are included.
You can toggle between EMA , WMA and SMA to your liking.
Strategy Tester version: