ZENADX Flow DI+ DI-ZENADX Flow Di+ Di- — Modified ADX/DI Trend Structure
This indicator is a refined and brand-aligned enhancement of the classic ADX, +DI, and –DI system, inspired by the original open-source work of Gustavo Cardelle (Gu5).
The ZENADX Flow version focuses on clear trend interpretation, minimal visual noise, and stable performance for discretionary and algorithmic traders.
🔍 What This Indicator Does
ADX Line (White Base Tone)
Shows overall trend strength. Rising ADX = strengthening trend.
Color-Coded ADX Flow
Green shades → Bullish directional strength
Red shades → Bearish directional strength
White → Low ADX / ranging market
+DI and –DI Structure
Helps identify which side (buyers or sellers) currently controls momentum.
DI Cross (Yellow Signal Marker)
Highlights potential trend-shift zones where +DI and –DI intersect.
Trend Markers Above the Indicator
Bullish Trend
Bearish Trend
Strong Bullish
Strong Bearish
End Trend (trend exhaustion)
✨ Improvements in the ZENADX Flow Edition
New optimized defaults: DI Length = 8, Range Level = 25, Trend Level = 25
Cleaned color logic for clarity and emotional neutrality
Removed bar-coloring to keep price action clean
Alerts remain always available (no toggle required)
Fully rewritten into safe, stable Pine formatting to avoid syntax issues
📌 Recommended For
Trend-followers
Momentum traders
Algo developers using DI/ADX states
Reversal detection (via DI Cross)
🧭 ZENADX Flow Research
Developed and refined under the ZENADX Flow Research methodology, focusing on:
Simplicity
Psychological clarity
Consistency
Actionable trend structure
📝 License
This work extends the original script by Gustavo Cardelle (Gu5) and follows the same license:
Attribution–NonCommercial 4.0 International (CC BY-NC 4.0)
-------------------------------------------------------------------
ZENADX Flow Di+ Di- — ระบบวิเคราะห์เทรนด์ ADX/DI เวอร์ชันปรับปรุง
อินดิเคเตอร์ตัวนี้เป็นการพัฒนาและปรับปรุงจากโครงสร้างดั้งเดิมของ ADX / +DI / –DI โดยอ้างอิงจากงานต้นฉบับของ Gustavo Cardelle (Gu5)
เวอร์ชัน ZENADX Flow ถูกออกแบบให้ อ่านง่าย ชัดเจน และรองรับการใช้งานทั้งเทรดมืออาชีพและระบบอัตโนมัติ
🔍 สิ่งที่อินดิเคเตอร์นี้ช่วยให้เห็น
ADX สีขาวเป็นฐาน
แสดง “ความแข็งแรงของเทรนด์” (ไม่ใช่ทิศทาง)
โทนสีบอกพลังเทรนด์
เขียวเข้ม/อ่อน → เทรนด์ขาขึ้นกำลังแข็งแรง/อ่อน
แดงเข้ม/อ่อน → เทรนด์ขาลงกำลังแข็งแรง/อ่อน
ขาว → ช่วงตลาด Sideway / เทรนด์อ่อน
+DI / –DI
ช่วยบอกว่าซื้อหรือขายกำลังคุมตลาดอยู่
DI Cross (จุดสีเหลือง)
เป็นสัญญาณเปลี่ยนโมเมนตัมที่สำคัญ
สัญลักษณ์เหนืออินดิเคเตอร์
Bullish Trend
Bearish Trend
Strong Bullish
Strong Bearish
End Trend (จบเทรนด์)
✨ สิ่งที่ปรับปรุงในเวอร์ชัน ZENADX Flow
ค่าเริ่มต้นใหม่ที่เหมาะกับ Flow Trading: DI = 8, Range = 25, Trend = 25
ลบ bar-coloring เพื่อให้กราฟสะอาด
ระบบสีอ่านง่าย ไม่ปนกัน
Alerts ทำงานพร้อมใช้ทันที
จัด Code Format แบบ “Safe Format” เพื่อป้องกัน error ขณะแก้ไข
🧭 พัฒนาโดย ZENADX Flow Research
ยึดหลักสำคัญของ ZENADX คือ
ความเรียบง่าย
ความชัดเจนทางจิตวิทยา
ความสม่ำเสมอ
มุ่งเน้นเทรนด์ที่ “ไหล” ตามโครงสร้างตลาดจริง
📝 License
สคริปต์นี้พัฒนาต่อยอดจากอินดิเคเตอร์ต้นฉบับของ Gustavo Cardelle (Gu5)
และยังใช้สัญญาอนุญาตเดียวกัน:
Attribution–NonCommercial 4.0 International (CC BY-NC 4.0)
平均趨向指標(ADX)

Unified Physics: The Sniper [Force + Trend + Energy] By RMSTitle: Unified Physics: The Sniper Edition Short Description:An institutional-grade momentum system that applies the laws of physics ($F=ma$) to price action. It filters out 80% of market noise to target only high-probability, high-velocity impulsive moves.Full Description:The Physics of a Winning TradeMost indicators lag because they measure what has happened. Unified Physics measures what is powering the move right now. It is based on the principle that for a trend to sustain a massive run, it requires three physical components aligned simultaneously:Mass (Volume): Participation must be high.Acceleration (Velocity): Price must be speeding up, not just moving.Energy (Trend): The broader market must be in an active state.This "Sniper Edition" is the result of rigorous stress-testing on 4H data, designed to filter out the "churn" and only fire when the probability of a sustained run is highest.The "Equation" StrategyThis script does not show every crossover or dip. It employs a strict 4-Step Equation to validate a trade. A signal (Green/Red Triangle) only appears if ALL of the following conditions are met:1. The Trend Filter (The River)Checks the 200 SMA. We never trade against the long-term flow.Logic: Longs only above the 200 SMA. Shorts only below.2. The Energy Filter (The Fuel)Checks the ADX.Logic: If ADX is below 25, the market is "Dead." No signals are taken, preventing whipsaws in ranging markets.3. The Volatility Gate (The Expansion)Checks the ATR (Average True Range) relative to its baseline.Logic: We only enter when volatility is expanding (ATR > 100-period average). This ensures we are entering a breakout, not a dying move.4. The Force Threshold (The Sniper Scope)Calculates Force = Volume × Acceleration.Logic: The histogram must breach a dynamic statistical threshold (Standard Deviation). This ensures we only trade the Top 10% of strongest impulses—the ones likely to run for 20-50 pips.How to Trade ItEntry (Triangles):Green Triangle: Valid Sniper Long. Physics are aligned for an upward explosion.Red Triangle: Valid Sniper Short. Physics are aligned for a downward crash.The Lifecycle Exit (Yellow 'X'):This indicator includes a "Momentum Fade" detector.A small Yellow 'X' will appear when the Force Histogram shrinks for 2 consecutive bars.Strategy: This is your cue that the initial impulse is over. Consider taking profit or tightening your stop loss immediately.Best SettingsTimeframe: Optimized for 4H (Swing) trading.Pairs: Majors (EURUSD, USDJPY, GBPUSD).Sniper Threshold: Default is 2.0. Increase to 2.5+ for fewer, higher-accuracy trades. Decrease to 1.5 for more frequency.Disclaimer: This tool visualizes market momentum based on historical physics principles. Past performance is not indicative of future results. Always use proper risk management.
Responsive ADX (RADX)Introducing the new Responsive ADX (RADX), running with a (length = 9) and exactly how it differs from the standard built-in ADX you see on TradingView chart.
This indicator is still a true ADX at its core — it measures trend strength from 0 to 100 and uses the classic +DI and –DI lines to show direction — but it has been carefully "tuned" to react noticeably faster while staying smooth and usable. With the length set to 9, it is one of the most responsive versions you can run without turning into noise.
How it behaves differently from the normal (Wilder) ADX
Normal ADX is lagging, now this version gives you the same trend-strength reading 4–8 bars earlier than the built-in ADX. On a daily chart that can easily be 4–8 calendar days of earlier warning. On a 4-hour chart it’s 16–32 hours earlier. That head-start is the whole point.
The ADX line rises and falls much quicker.
When a new trend actually starts, you will often see this Fast ADX cross above 18–20 while the built-in ADX is still sleeping below 15. Conversely, when a trend dies, this version drops faster, so you’re not left holding a dead trade for an extra week.
The +DI and –DI lines are almost identical to the original, but lightly smoothed with a 5-period EMA (you can turn this off). This makes the DI crossovers cleaner and reduces whipsaws without adding meaningful lag.
The final ADX smoothing uses a lightweight Hull-style technique instead of Wilder’s very slow RMA. This is the main “secret sauce” that removes roughly half the lag while keeping the line smooth and readable.
Values are realistic and tradable.
With length 9 you will typically see:
– 0–18 = flat / chop
– 15–20 = emerging trend (background starts colouring)
– 20–50 = strong trend (most people take this as confirmation)
– above 50–60 only in very powerful moves (same as normal ADX)
The aqua / purple background only appears when both conditions are met: the correct DI is on top and Fast ADX is above your chosen “weak-to-trending” level (default 18).
This prevents the background from flashing on and off in sideways markets — exactly the same logic you liked in the original Trinity ADX, but now much earlier.
In very simple terms
Think of the normal built-in ADX as a diesel truck — reliable but slow to accelerate and slow to stop. Fast Responsive ADX with length 9 is the same truck with a turbocharger — same destination and same load capacity, but it gets up to speed twice as fast and brakes earlier when the road turns.
We would recommend people who switch to this version keep the (length 9–12) because the edge in timing is obvious on the chart.
That’s it — this is a new more responsive version, still-logical ADX!

QFT MTF Range DetectorQFT MTF Range Detector — QuantumFlowTrader
Description:
The QFT MTF Range Detector is a multi-timeframe (MTF) tool designed to identify consolidation zones or ranging conditions across multiple intraday timeframes — from 1 minute up to 4 hours. This indicator is optimized for high-frequency trading environments such as scalping and day trading.
How it works:
For each selected timeframe, the indicator evaluates five key technical conditions:
- Low ADX (less than 17) – suggesting weak trend strength.
- Range width within a specific normalized threshold.
- Normalized ATR (volatility filter) in a defined range.
- RSI near the neutral zone (40–60) with low volatility.
- Price proximity to the mid-range (consolidation center).
Each condition contributes a score. If at least 3 out of 5 conditions are met, that timeframe is considered to be in a range (consolidation).
Visual output:
A compact table is displayed on the chart showing all selected timeframes:
Black box = Timeframe is in a range (consolidation).
Purple box = Not in a range (likely trending or volatile).
Timeframes are labeled (e.g., "4H", "15M") for clarity.
Customization:
Choose display corner (top/bottom, left/right).
Enable or disable table borders.
Set custom colors for range and non-range signals.
Use case:
Traders can quickly assess which timeframes are in a range, helping them:
Avoid choppy markets,
Time entries and exits better,
Confirm multi-timeframe alignment.
Note: This is not a buy/sell signal indicator. It is a market condition filter to enhance decision-making.

ADX_RDADX_RD - Average Directional Index (Ryan DeBraal)
This script plots a refined version of the **ADX (Average Directional Index)**,
used to measure trend strength regardless of trend direction. It includes
custom smoothing, modified DM (Directional Movement) logic, dynamic coloring,
and a built-in 20-level threshold.
FEATURES
- Calculates +DI, –DI, and ADX using standard Wilder smoothing (RMA).
- Signal color turns **white** when ADX < 20 (low-trend or choppy conditions).
- Signal color turns **blue** when ADX >= 20 (trend strengthening).
- Horizontal dotted reference line at **20**, a widely used threshold:
ADX < 20 → weak or ranging market
ADX > 20 → strengthening trend
- Works on all timeframes, supports custom smoothing lengths.
PURPOSE
This indicator helps identify when a market is trending vs when it is flat.
It does not indicate direction by itself — only the strength of the move —
making it ideal for confirming breakout setups, trend-following entries,
and filtering out low-probability trades during chop.

ADX with 20 ThresholdI wanted an ADX with a threshold line so I created an indicator.
ADX (20 Threshold) Cheat-Sheet
Purpose: Filter trades by trend strength.
Indicator: ADX (derived from DMI) with optional +DI/−DI lines.
Key Rules:
ADX > 20: Trend is strong → trade OK
ADX < 20: Trend is weak/choppy → avoid trades
Optional +DI / −DI: Shows momentum direction
HTF Use: Stable trend confirmation
LTF Use: Optional filter with EMA slope for entries
Tips:
Combine with EMAs or MACD for directional bias.
ADX does not indicate direction, only strength.
Best used to avoid low-probability trades in sideways markets.

Rawa_Trade_System_Vol_AdxThe strategy must be configured for each instrument separately; the basic configuration uses a trailing stop, a 4H timeframe, and excludes margin trading.

ADX Forecast Colorful [DiFlip]ADX Forecast Colorful
Introducing one of the most advanced ADX indicators available — a fully customizable analytical tool that integrates forward-looking forecasting capabilities. ADX Forecast Colorful is a scientific evolution of the classic ADX, designed to anticipate future trend strength using linear regression. Instead of merely reacting to historical data, this indicator projects the future behavior of the ADX, giving traders a strategic edge in trend analysis.
⯁ Real-Time ADX Forecasting
For the first time, a public ADX indicator incorporates linear regression (least squares method) to forecast the future behavior of ADX. This breakthrough approach enables traders to anticipate trend strength changes based on historical momentum. By applying linear regression to the ADX, the indicator plots a projected trendline n periods ahead — helping users make more accurate and timely trading decisions.
⯁ Highly Customizable
The indicator adapts seamlessly to any trading style. It offers a total of 26 long entry conditions and 26 short entry conditions, making it one of the most configurable ADX tools on TradingView. Each condition is fully adjustable, enabling the creation of statistical, quantitative, and automated strategies. You maintain full control over the signals to align perfectly with your system.
⯁ Innovative and Science-Based
This is the first public ADX indicator to apply least-squares predictive modeling to ADX dynamics. Technically, it embeds machine learning logic into a traditional trend-strength indicator. Using linear regression as a predictive engine adds powerful statistical rigor to the ADX, turning it into an intelligent, forward-looking signal generator.
⯁ Scientific Foundation: Linear Regression
Linear regression is a fundamental method in statistics and machine learning used to model the relationship between a dependent variable y and one or more independent variables x. The basic formula for simple linear regression is:
y = β₀ + β₁x + ε
Where:
y = predicted value (e.g., future ADX)
x = explanatory variable (e.g., bar index or time)
β₀ = intercept
β₁ = slope (rate of change)
ε = random error term
The goal is to estimate β₀ and β₁ by minimizing the sum of squared errors. This is achieved using the least squares method, ensuring the best linear fit to historical data. Once the coefficients are calculated, the model extends the regression line forward, generating the ADX projection based on recent trends.
⯁ Least Squares Estimation
To minimize the error, the regression coefficients are calculated as:
β₁ = Σ((xᵢ - x̄)(yᵢ - ȳ)) / Σ((xᵢ - x̄)²)
β₀ = ȳ - β₁x̄
Where:
Σ = summation
x̄ and ȳ = means of x and y
i ranges from 1 to n (number of data points)
These formulas provide the best linear unbiased estimator under Gauss-Markov conditions — assuming constant variance and linearity.
⯁ Linear Regression in Machine Learning
Linear regression is a foundational algorithm in supervised learning. Its power in producing quantitative predictions makes it essential in AI systems, predictive analytics, time-series forecasting, and automated trading. Applying it to the ADX essentially places an intelligent forecasting engine inside a classic trend tool.
⯁ Visual Interpretation
Imagine an ADX time series like this:
Time →
ADX →
The regression line smooths these values and projects them n periods forward, creating a predictive trajectory. This forecasted ADX line can intersect with the actual ADX, offering smarter buy and sell signals.
⯁ Summary of Scientific Concepts
Linear Regression: Models variable relationships with a straight line.
Least Squares: Minimizes prediction errors for best fit.
Time-Series Forecasting: Predicts future values using historical data.
Supervised Learning: Trains models to predict outcomes from inputs.
Statistical Smoothing: Reduces noise and highlights underlying trends.
⯁ Why This Indicator Is Revolutionary
Scientifically grounded: Based on rigorous statistical theory.
Unprecedented: First public ADX using least-squares forecast modeling.
Smart: Uses machine learning logic.
Forward-Looking: Generates predictive, not just reactive, signals.
Customizable: Flexible for any strategy or timeframe.
⯁ Conclusion
By merging ADX and linear regression, this indicator enables traders to predict market momentum rather than merely follow it. ADX Forecast Colorful is not just another indicator — it’s a scientific leap forward in technical analysis. With 26 fully configurable entry conditions and smart forecasting, this open-source tool is built for creating cutting-edge quantitative strategies.
⯁ Example of simple linear regression with one independent variable
This example demonstrates how a basic linear regression works when there is only one independent variable influencing the dependent variable. This type of model is used to identify a direct relationship between two variables.
⯁ In linear regression, observations (red) are considered the result of random deviations (green) from an underlying relationship (blue) between a dependent variable (y) and an independent variable (x)
This concept illustrates that sampled data points rarely align perfectly with the true trend line. Instead, each observed point represents the combination of the true underlying relationship and a random error component.
⯁ Visualizing heteroscedasticity in a scatterplot with 100 random fitted values using Matlab
Heteroscedasticity occurs when the variance of the errors is not constant across the range of fitted values. This visualization highlights how the spread of data can change unpredictably, which is an important factor in evaluating the validity of regression models.
⯁ The datasets in Anscombe’s quartet were designed to have nearly the same linear regression line (as well as nearly identical means, standard deviations, and correlations) but look very different when plotted
This classic example shows that summary statistics alone can be misleading. Even with identical numerical metrics, the datasets display completely different patterns, emphasizing the importance of visual inspection when interpreting a model.
⯁ Result of fitting a set of data points with a quadratic function
This example illustrates how a second-degree polynomial model can better fit certain datasets that do not follow a linear trend. The resulting curve reflects the true shape of the data more accurately than a straight line.
⯁ What is the ADX?
The Average Directional Index (ADX) is a technical analysis indicator developed by J. Welles Wilder. It measures the strength of a trend in a market, regardless of whether the trend is up or down.
The ADX is an integral part of the Directional Movement System, which also includes the Plus Directional Indicator (+DI) and the Minus Directional Indicator (-DI). By combining these components, the ADX provides a comprehensive view of market trend strength.
⯁ How to use the ADX?
The ADX is calculated based on the moving average of the price range expansion over a specified period (usually 14 periods). It is plotted on a scale from 0 to 100 and has three main zones:
Strong Trend: When the ADX is above 25, indicating a strong trend.
Weak Trend: When the ADX is below 20, indicating a weak or non-existent trend.
Neutral Zone: Between 20 and 25, where the trend strength is unclear.
⯁ Entry Conditions
Each condition below is fully configurable and can be combined to build precise trading logic.
📈 BUY
🅰️ Signal Validity: The signal will remain valid for X bars .
🅰️ Signal Sequence: Configurable as AND or OR .
🅰️ +DI > -DI
🅰️ +DI < -DI
🅰️ +DI > ADX
🅰️ +DI < ADX
🅰️ -DI > ADX
🅰️ -DI < ADX
🅰️ ADX > Threshold
🅰️ ADX < Threshold
🅰️ +DI > Threshold
🅰️ +DI < Threshold
🅰️ -DI > Threshold
🅰️ -DI < Threshold
🅰️ +DI (Crossover) -DI
🅰️ +DI (Crossunder) -DI
🅰️ +DI (Crossover) ADX
🅰️ +DI (Crossunder) ADX
🅰️ +DI (Crossover) Threshold
🅰️ +DI (Crossunder) Threshold
🅰️ -DI (Crossover) ADX
🅰️ -DI (Crossunder) ADX
🅰️ -DI (Crossover) Threshold
🅰️ -DI (Crossunder) Threshold
🔮 +DI (Crossover) -DI Forecast
🔮 +DI (Crossunder) -DI Forecast
🔮 ADX (Crossover) +DI Forecast
🔮 ADX (Crossunder) +DI Forecast
📉 SELL
🅰️ Signal Validity: The signal will remain valid for X bars .
🅰️ Signal Sequence: Configurable as AND or OR .
🅰️ +DI > -DI
🅰️ +DI < -DI
🅰️ +DI > ADX
🅰️ +DI < ADX
🅰️ -DI > ADX
🅰️ -DI < ADX
🅰️ ADX > Threshold
🅰️ ADX < Threshold
🅰️ +DI > Threshold
🅰️ +DI < Threshold
🅰️ -DI > Threshold
🅰️ -DI < Threshold
🅰️ +DI (Crossover) -DI
🅰️ +DI (Crossunder) -DI
🅰️ +DI (Crossover) ADX
🅰️ +DI (Crossunder) ADX
🅰️ +DI (Crossover) Threshold
🅰️ +DI (Crossunder) Threshold
🅰️ -DI (Crossover) ADX
🅰️ -DI (Crossunder) ADX
🅰️ -DI (Crossover) Threshold
🅰️ -DI (Crossunder) Threshold
🔮 +DI (Crossover) -DI Forecast
🔮 +DI (Crossunder) -DI Forecast
🔮 ADX (Crossover) +DI Forecast
🔮 ADX (Crossunder) +DI Forecast
🤖 Automation
All BUY and SELL conditions are compatible with TradingView alerts, making them ideal for fully or semi-automated systems.
⯁ Unique Features
Linear Regression: (Forecast)
Signal Validity: The signal will remain valid for X bars
Signal Sequence: Configurable as AND/OR
Condition Table: BUY/SELL
Condition Labels: BUY/SELL
Plot Labels in the Graph Above: BUY/SELL
Automate and Monitor Signals/Alerts: BUY/SELL
Background Colors: "bgcolor"
Background Colors: "fill"
Linear Regression (Forecast)
Signal Validity: The signal will remain valid for X bars
Signal Sequence: Configurable as AND/OR
Table of Conditions: BUY/SELL
Conditions Label: BUY/SELL
Plot Labels in the graph above: BUY/SELL
Automate & Monitor Signals/Alerts: BUY/SELL
Background Colors: "bgcolor"
Background Colors: "fill"

ZENADX Momentum FlowZENADX Momentum Flow คืออินดิเคเตอร์ที่ออกแบบมาเพื่อช่วยเทรดเดอร์จับ “ทิศทาง + จังหวะ” ของตลาดด้วยความเรียบง่ายแบบเซน แต่ทรงพลังด้วยแกนวิเคราะห์จาก ADX, DI และ Stochastic Momentum
อินดิเคเตอร์นี้ผสมผสาน โครงสร้างเทรนด์ (Trend Structure) ด้วย ADX/DI และ โมเมนตัม (Momentum Timing) ด้วย Stochastic เพื่อค้นหาจุดเข้าออกที่ “นิ่ง คม และมีสติ” ตามหลัก Zen Flow Trading
สิ่งที่ ZENADX Momentum Flow ทำให้คุณ:
1.จับเทรนด์หลักด้วย ADX ที่ผ่านเกณฑ์ความแข็งแรง
2.ฟิลเตอร์จังหวะด้วย Stochastic เพื่อหลีกเลี่ยงสัญญาณหลอก
3.แสดงสัญญาณ BUY/SELL เฉพาะเมื่อน้ำหนักเทรนด์ + โมเมนตัมสอดคล้องกัน
เหมาะทั้งสาย Trend Following และ Swing Entry ที่ต้องการ Flow ที่เป็นระบบ
เหมาะกับใคร?
สายเทรนด์, เทรดเดอร์แบบ Flow, คนที่ชอบระบบที่เรียบง่ายแต่ให้ “ความมั่นใจ” เวลาเข้าออก
หลักการ Zen:
ไม่ใช่แค่การตามเทรนด์… แต่คือการ ไหลไปตามตลาด อย่างมีสติและไม่ฝืนตลาด
-------------------------------------------------------------------------
ZENADX Momentum Flow is a trend–momentum hybrid indicator designed for traders who want clarity, simplicity, and precision. Inspired by Zen principles, this tool helps you align with the market’s natural flow—without noise or over-complication.
This indicator blends trend strength from ADX/DI with momentum confirmation from Stochastic, producing clean BUY/SELL signals only when both market structure and momentum agree.
What ZENADX Momentum Flow provides:
Detects strong trend directions using ADX threshold logic
Filters noise with Stochastic momentum alignment
Generates precise BUY/SELL signals based on DI crossovers + momentum confirmation
Ideal for Trend Following and Swing Entry traders who want a smooth, systematic flow
Perfect for:
Traders who seek a calm, disciplined, and structured way to follow the market’s movement—without forcing trades.
Zen Philosophy:
You don’t fight the trend…
You flow with it.

Average Directional Index with middle line 25I interpret the ADX as indicating weakness in the current price when the value is below 25, and strength when it is above 25.
This line at 25 is drawn in the ADX chart. Its color and value can be customized in the Trading View box.

Adaptive Trend Mapper-ATM (Arjo)Adaptive Trend Mapper (ATM) is a multi-factor trend, momentum, and compression-analysis tool designed to help traders visually map the strength and direction of market pressure.
Instead of simply combining existing indicators, ATM creates a new composite framework that blends momentum imbalance, directional strength, volatility contraction, and adaptive smoothing into a single, unified model.
Originality and usefulness
Adaptive Trend Mapper (ATM) does not replicate any one indicator.
It generates two custom indices— Bull Pressure Index and Bear Pressure Index —derived from a mathematical combination of RSI, inverse-RSI, and ADX. These indices behave differently from traditional oscillators:
They represent directional pressure on a 0–100 scale , not momentum.
They are designed to converge/diverge, forming a basis for the built-in Squeeze Detection Engine.
They can be optionally step-compressed , making the movement easier to read on fast or small charts.
The script also integrates a custom SuperSmoother trend model (not TradingView’s built-in function), which acts as an adaptive trend curve on the chart.
All calculations are combined intentionally—not as a mashup—to create a framework that allows traders to understand trend strength, compression phases, and micro-trend shifts in one place.
How the Indicator Works
1. Bull & Bear Pressure Indices:
These indices measure directional imbalance:
Bull Index = ADX strength weighted against inverse-RSI
Bear Index = ADX strength weighted against normal RSI
This produces two opposing pressure curves that rise or fall depending on whether buyers or sellers dominate.
You can optionally smooth these using:
SMA / EMA / WMA / RMA via the “Smoothing Settings” panel.
2. Squeeze & Compression Detection:
A squeeze is detected when:
ADX stays below a user-defined threshold
Bull–Bear Index difference shrinks
Average difference is falling (convergence)
This is a volatility-contraction model inspired by squeeze logic but applied to directional pressure, not Bollinger Bands/Keltner Channels .
3. Adaptive Trend Curve (SuperSmoother Engine)
The indicator applies a two-pole SuperSmoother filter to the price, then smooths it again using EMA.
The slope color flips between bullish and bearish and is displayed using:
A thin SuperSmoother curve
A thicker band for visual context
4. EMA-50 Trend Context:
An optional EMA-50 helps identify broad directional bias .
5. Step-Based Scaling
You can quantize the Bull/Bear indices using custom step intervals.
This makes the indicator easier to read on noisy intraday charts.
How to Use the Indicator
1. Trend Analysis
A rising Bull Index shows strengthening upward pressure
A rising Bear Index shows strengthening downward pressure
Wide divergence between the indices signals a strong trend
2. Compression / Squeeze Analysis
Yellow background = volatility compression + pressure convergence
Breakouts from this zone often precede directional expansion
3. Trendline Reading
SuperSmoother line color flip = micro trend shift
EMA-50 slope gives macro-trend direction
Perfect for combining trend and momentum maps on the same chart
4. Visual Interpretation
Cyan/teal → strong bullish pressure
Purple/red/orange → various levels of bearish control
Neutral/teal background → weak ADX
Yellow background → squeeze zone
Open-Source Notes
This script uses:
TradingView built-in RSI, ADX/DMI, and smoothing functions
A SuperSmoother implementation based on known DSP filter coefficients
All remaining logic, signal methods, composite indices, and compression model are original developments by ARJO .
The script is published open-source to comply with TradingView’s reuse policy.
Disclaimer
This tool is for educational and analytical purposes only.
It does not generate buy or sell signals.
Always use proper risk management.
Happy Trading (ARJO)

KLS Ultimate V.1"KLS Ultimate V.1" is a meticulously designed trading indicator. It is built specifically for "Scalpers" (traders who want quick in-and-out profits).
**🚀 How it Works: The 3-Level Logic**
This indicator doesn't just rely on one tool. It gathers several indicators to have a "meeting" and confirm everything before giving you a Buy or Sell signal.
**🎯 Level 1: Core Trend (The Gatekeepers)**
This is the first checkpoint. If the price doesn't pass this stage, no signal gets generated.
- EMA: Is the price standing above the trend line? (Uptrend needs to be above, Downtrend below).
- MACD: Checks momentum and looks at the Histogram to see if real buying/selling volume is coming in.
- ADX: Measures trend strength (it won’t trade in boring, sideways markets).
**🔥 Level 2: Momentum (Finding the Best Entry)**
The second checkpoint to find the perfect spot to jump in.
- RSI: Checks if the price is Oversold (too cheap) or Overbought (too expensive).
- Stochastic: Finds short-term reversal crossovers.
**⭐ Level 3: Signal Boosters (For Strict Mode)**
A special bonus stage for those who want high accuracy (enable this in settings).
- RSI Divergence: Spots conflicts between price and RSI (e.g., Price drops but RSI rises = ready to pump).
- Price Action: Checks for strong candlestick patterns that show a clear winner between buyers and sellers.
------------------------------------------------------------
**🎮 User Guide**
Once you add this code to TradingView, here is what you will see and how to use it:
**A. Entry Signals**
🟢 Green BUY Label: Pops up below the candle.
* Means: Uptrend + Momentum + All filters passed.
🔴 Red SELL Label: Pops up above the candle.
* Means: Downtrend + Selling pressure + All filters passed.
**B. TP/SL Lines (Profit & Loss)**
The system calculates these automatically—no need to measure manually!
- Blue Line: Entry point.
- Light Green (TP1, TP2): Short-term profit targets.
- Dark Green (TP3): Long-term profit target.
- Red Line (SL): Stop Loss point.
**C. Special Mode: Strict Filter**
- Normal (False): Uses only Level 1 + Level 2. You get more signals.
- Strict (True): Needs Level 1 + 2 + 3 to trigger. Fewer signals, but much higher accuracy.
------------------------------------------------------------
**🛠️ Settings & Customization**
Click the gear icon to tweak the settings as you like:
1. Show BUY/SELL Signals: Uncheck if you don't want to see the labels.
2. Use Strict Filter: Check this for high precision (but you'll wait longer for signals).
3. Point Size: **Very Important!** This defines the TP/SL distance.
- For Gold (XAUUSD): Use **0.01**.
- For Forex pairs: Try **0.0001**.
- *Tip: Adjust this number until the TP/SL lines look reasonable on your chart.*
4. TP/SL Points: Set your desired profit/loss distance (e.g., TP1 = 50 points).
------------------------------------------------------------
💡 **Pro Tips**
- Trading Time: This code is smart—it checks sessions (based on GMT+7/Thai Time). It only gives signals during active markets (Sydney, Tokyo, London, NY). It stays quiet during dead hours.
- Recommended Timeframe: Since it's for Scalping, it works best on **M5, M15, or M30**.
- Money Management: Even with SL lines, always calculate your Lot Size properly. Don't overtrade!
------------------------------------------------------------
"KLS Ultimate V.1" เป็นเครื่องมือช่วยเทรด (Indicator) ที่ออกแบบมาอย่างปราณีตและซับซ้อนพอสมควร โดยเน้นไปที่ "สาย Scalping" (เทรดสั้นทำกำไรเร็ว) โดยเฉพาะ
🚀 เจาะลึกการทำงาน: ระบบกรอง 3 ชั้น (The 3-Level Logic)
อินดิเคเตอร์ตัวนี้ไม่ได้ใช้แค่เครื่องมือเดียวตัดสินใจ แต่มันเอาอินดิเคเตอร์หลายตัวมา "คอนเฟิร์ม" กันก่อนจะบอกให้คุณ Buy หรือ Sell ครับ
🎯 Level 1: ตัวคุมเทรนด์หลัก (Core Indicators)
นี่คือด่านแรก ถ้าไม่ผ่านด่านนี้ จะไม่มีสัญญาณเกิดขึ้น
- EMA (เส้นค่าเฉลี่ย): เช็คว่าราคายืนเหนือเส้นเทรนด์ไหม? (ขาขึ้นต้องยืนเหนือ, ขาลงต้องอยู่ใต้)
- MACD (โมเมนตัม): ดูแรงส่งของกราฟ และดู Histogram ว่ามีแรงซื้อ/ขาย เข้ามาจริงไหม
- ADX: วัดความแข็งแรงของเทรนด์ (ถ้าตลาดไซด์เวย์น่าเบื่อๆ ADX ต่ำๆ มันจะไม่เทรด)
🔥 Level 2: จุดกลับตัว (Momentum Indicators) ด่านที่สอง หาจังหวะเข้าที่ได้เปรียบ
- RSI: ดูว่าราคาถูกเกินไป (Oversold) หรือแพงเกินไป (Overbought) หรือยัง
- Stochastic: หาจุดตัดเพื่อยืนยันจุดกลับตัวระยะสั้น
⭐ Level 3: ตัวบูสต์สัญญาณ (Boost Indicators - สำหรับโหมด Strict)
ด่านพิเศษ สำหรับคนที่ต้องการความชัวร์ระดับสูง (เปิดใช้ได้ในตั้งค่า)
- RSI Divergence: หาสัญญาณขัดแย้งระหว่างราคากับ RSI (เช่น ราคาลงแต่ RSI ยกขึ้น = เตรียมพุ่ง)
- Price Action: ดูรูปแบบแท่งเทียนว่ามีแรงซื้อ/ขาย ชนะขาดลอยหรือไม่
------------------------------------------------------------
🎮 คู่มือการใช้งาน (User Guide)
เมื่อคุณแปะโค้ดนี้ลงใน TradingView แล้ว สิ่งที่คุณจะเห็นและการใช้งานมีดังนี้ครับ:
A. สัญญาณเข้าออเดอร์ (Entry Signals)
🟢 ป้าย BUY (สีเขียว): จะโผล่ใต้แท่งเทียน
แปลว่า: เทรนด์เป็นขาขึ้น + โมเมนตัมมา + ผ่านเงื่อนไขกรองต่างๆ แล้ว
🔴 ป้าย SELL (สีแดง): จะโผล่เหนือแท่งเทียน
แปลว่า: เทรนด์เป็นขาลง + แรงขายมา + ผ่านเงื่อนไขกรองต่างๆ แล้ว
B. เส้นเป้าหมายกำไร/ขาดทุน (TP/SL Lines)
ระบบคำนวณให้อัตโนมัติ ไม่ต้องนั่งวัดเอง!
- เส้นสีน้ำเงิน: จุดเข้า (Entry)
- เส้นสีเขียวอ่อน (TP1, TP2): เป้าทำกำไรระยะใกล้
เส้นสีเขียวเข้ม (TP3): เป้าทำกำไรระยะไกล
เส้นสีแดง (SL): จุดยอมแพ้ (Stop Loss)
C. โหมดพิเศษ: Strict Filter (โหมดเข้มงวด)
- ค่าปกติ (False): ใช้แค่ Level 1 + Level 2 ก็เกิดสัญญาณแล้ว (สัญญาณเยอะหน่อย)
- ถ้าเปิดใช้ (True): ต้องผ่าน Level 1 + 2 + 3 ถึงจะเกิดสัญญาณ (สัญญาณน้อย แต่แม่นยำสูงมาก)
------------------------------------------------------------
🛠️ วิธีตั้งค่าและปรับแต่ง (Settings)
ในหน้าตั้งค่า (รูปเฟือง) คุณสามารถปรับจูนได้ตามใจชอบ:
1. Show BUY/SELL Signals: ติ๊กออกถ้าไม่อยากเห็นป้ายสัญญาณ
2. Use Strict Filter: ติ๊กถูกถ้าอยากได้สัญญาณแม่นๆ (แต่รอนานหน่อย)
3. Point Size: สำคัญมาก! ใช้กำหนดระยะ TP/SL
- ถ้าเทรดทอง (XAUUSD) ตั้งค่าพื้นฐาน 0.01 เท่านั้น
- ถ้าเทรดคู่เงิน (Forex) อาจจะปรับเป็น 0.0001
- แนะนำให้ลองปรับจนเส้น TP/SL บนกราฟดูสมเหตุสมผล
4. TP/SL Points: กำหนดระยะจุดกำไรขาดทุนที่ต้องการ (เช่น TP1 = 50 จุด)
------------------------------------------------------------
💡 คำแนะนำเพิ่มเติม (Tips)
- เวลาเทรด: โค้ดนี้ฉลาดมาก มันมีการเช็คเวลา (Session) ให้ด้วย โดยอิงเวลา GMT+7 (เวลาไทย) โดยจะเทรดเฉพาะช่วงที่มีตลาดหลักเปิด (Sydney, Tokyo, London, NY) ช่วงตลาดวายดึกๆ หรือเช้ามืดเงียบๆ มันจะไม่บอกสัญญาณ
- Timeframe ที่แนะนำ: เนื่องจากเขียนมาเพื่อ Scalping แนะนำให้ใช้กับ M5, M15 หรือ M30 จะเห็นผลดีที่สุดครับ
- การบริหารเงิน (MM): แม้ระบบจะมี SL ให้ แต่คุณควรคำนวณ Lot Size ให้เหมาะสม ไม่ควร Overtrade ครับ

Average Directional Index infoAverage Directional Index (ADX) is a technical indicator created by J. Welles Wilder that measures trend strength (not direction!). Values range from 0 to 100.
This indicator is a supplementary tool for assessing whether trend strategies are worthwhile, monitoring changes in trend strength and avoiding weak, choppy movements
Value Interpretation:
0-25: Weak trend or sideways market
25-50: Moderate to strong trend
50-75: Very strong trend
75-100: Extremely strong trend (rare)
Important: ADX does not indicate trend direction (up/down), only its strength!
This script indicator includes additional features:
1. ADX Plot (purple line)
Basic ADX value showing current trend strength.
2. ADX Trend Analysis (arrows)
The script compares current ADX with its 10-period moving average with ±5% tolerance:
↑ (green): ADX rising → trend strengthening
↓ (red): ADX falling → trend weakening
⮆ (gray): ADX stable → trend strength unchanged
3. Information Table
Displays current ADX value with trend arrow in the top-right corner.
Parameters to Configure
Smoothing (default: 14) - Indicator smoothing period
Lower values (e.g., 7): more sensitive, more signals
Higher values (e.g., 21): more stable, less noise
Indicator Length (default: 14) - Period for calculating directional movement (+DI/-DI)
Wilder's standard value is 14
Trend Length (default: 10) - Period for moving average to analyze ADX dynamics
Determines how quickly changes in trend strength are detected
Practical Application
✅ Strategy 1: Trend Strength Filter
1. ADX > 25 → look for positions aligned with the trend
2. ADX < 25 → avoid trend strategies, consider oscillators
✅ Strategy 2: Entries on Strengthening Trend
1. ADX crosses above 25 + arrow ↑ → trend gaining momentum
2. Combine with other indicators (e.g., EMA) for direction confirmation
✅ Strategy 3: Exhaustion Warning
1. ADX > 50 + arrow ↓ → strong trend may be exhausting
2. Consider profit protection or trailing stop

Clean CPR v2.0Clean CPR v2.0 – Multi-Timeframe CPR & Bias Dashboard
Author: @jsm
// modified from "CPR (Central Pivot Range)" script by ajithcpas and Simple CPR by finallynitin
1. Overview
Clean CPR v2.0 is an intraday + swing CPR toolkit designed to keep the chart visually clean while still giving a full “context dashboard” on the right side.
The script combines:
Classic / Fibonacci / Camarilla CPR with multi-timeframe options
Previous-session CPR & zones
Developing CPR + Dev R1 / Dev S1
Initial Balance & custom session ranges
A sentiment dashboard (Monthly / Weekly / Daily CPR)
CPR width & CPR-type classification with emojis
A >21-EMA “status pill”
Optional Moving Averages and a Day-Open Anchored VWAP
2. Main CPR Engine
What it plots (depending on your inputs):
Central Pivot Range (CPR): BC, TC, PP
Pivot SR levels (R1–R5 / S1–S5)
Choice of Traditional, Fibonacci, Classic, Camarilla formulas
Ability to hide CPR-based SR (for a very clean look)
Multi-timeframe CPR source (Daily, Weekly, Monthly, Quarterly, Half-yearly, Yearly, or Auto)
Extras:
Historical SR pivots (optional)
Adjustable number of CPRs to look back
Label side (Left / Right) and line width controls
3. Previous Session Structure
Optional plotting of the previous session’s structure:
Previous High / Previous Low
Previous CPR (PH / PL zones)
Shaded zones between: PH ↔ R1, PL ↔ S1
Clean labels with prices on the right, aligned to the current day
This gives a quick view of “yesterday’s battle zone” relative to today’s price.
4. Developing CPR & Dev R1 / Dev S1
For intraday traders, the script includes a Developing CPR module:
Dev CPR band for the current session
Optional Dev R1 and Dev S1 levels
Implementation details:
Only the latest Dev CPR / Dev R1 / Dev S1 labels are kept on screen – old labels are cleaned up so you don’t get a vertical stack as time moves.
Option to extend developing CPR lines further into the session.
5. Initial Balance (IB) & Custom Ranges
The script can show:
Initial Balance high/low (first X minutes)
IB extension lines and range
Additional user-defined custom session windows
This is useful for breakout / range traders around the opening range.
6. >21 EMA Status Box
On the right side you can enable a compact >21EMA info box:
Uses Daily 21 EMA (requested via security() so it’s consistent across intraday timeframes).
A dot + label show the relationship between close and 21 EMA:
7. Dashboard – Monthly / Weekly / Daily CPR Context
A compact dashboard table appears on the right (position & size configurable).
7.1 Location vs CPR (M / W / D)
For each timeframe:
It classifies the close as Above / Inside / Below its CPR band.
7.2 Sentiment Header – “Trust the Bulls / Bears / Patience”
The dashboard header follows Daily CPR location:
If Daily is above its CPR → header: “Trust the Bulls” (green background)
If Daily is below its CPR → header: “Trust the Bears” (red background)
If Daily is inside its CPR → header: “Have Patience” (neutral grey)
8. CPR Width & CPR Type (with Emojis)
8.1 CPR Width – Daily
Daily CPR width (% of price) is classified as:
🎯 Super Narrow
📏 Narrow
➖ Medium
📐 Wide
Useful for identifying potential trend / expansion days vs balanced sessions.
8.2 CPR Type – 3-day Structure
Based on the last three daily CPRs, the script categorises CPR structure as:
Ascending – 3-day rising CPR
Descending – 3-day falling CPR
Inside – today’s CPR within yesterday’s
Outside – today’s CPR outside yesterday’s
Asc Rev – bullish reversal pattern
Desc Rev – bearish reversal pattern
Overlapping – messy / overlapping CPRs
9. Moving Averages (MA 1–5)
Optional Moving Average panel Up to 5 MAs, each configurable:
Type: SMA, EMA, SMMA (RMA), WMA, VWMA
10. Day-Open Anchored VWAP
Optional Day-Open VWAP module. Resets VWAP at each new trading day’s open.
This is helpful for intraday mean-reversion and VWAP-based trade locations.
11. Recommended Use & Notes
Best used on indices and liquid futures where CPR, previous session zones and VWAP have strong interaction.
Works on any timeframe; for the full effect, try intraday charts (3-15 min) with:
Dashboard enabled
Daily CPR as the base
Dev CPR + Day-Open VWAP for intraday structure
21EMA box and one or two MAs for trend confirmation.
Disclaimer:
This script is for educational and informational purposes only. It does not constitute financial advice or a recommendation to buy or sell any security. Always test on paper / demo and combine with your own analysis and risk management.

Improved ADX – Responsive & Visual (manual ADX)just an ADX but more visual....
This indicator is a custom implementation of the Average Directional Index (ADX), designed to provide a responsive and visual representation of trend strength along with the DI+ and DI– lines. It uses manual calculations for the ADX and directional movement components for greater control over smoothing and responsiveness.
Key Features:
ADX Calculation:
Computes directional movement (upMove / downMove) manually.
Calculates True Range and smoothed directional movements using Wilder’s moving average (RMA).
Computes the ADX using the smoothed DX and applies additional smoothing (adx_fast) for responsiveness.
Directional Indicators (DI+ / DI–):
DI+ and DI– lines are calculated independently.
Lines are plotted on the same scale as the indicator.
Colors:
DI+ is green when above DI–, otherwise semi-transparent green.
DI– is red when above DI+, otherwise semi-transparent red.
ADX Coloring and Trend Fill:
ADX line color changes dynamically:
Green when above the trend strength threshold.
Yellow when near the threshold (0.75 × threshold).
Red when below the threshold.
Optional fill highlights strong trends between ADX and the threshold line:
Green fill for ADX above the threshold.
Red fill for ADX below the threshold.
Cross Markers:
Triangle markers are plotted on the indicator scale when ADX crosses the threshold:
Upward green triangle for ADX crossing above the threshold (strengthening trend).
Downward red triangle for ADX crossing below the threshold (weakening trend).
Live Values Label:
Displays the current ADX, DI+, and DI– values at the top of the indicator pane.
Automatically updates on the last bar.
Inputs:
len: ADX length (default 14)
smooth: Smoothing factor for adx_fast (default 5)
show_fill: Highlight strong trend area (true/false)
highlight_level: Trend strength threshold (default 25)
show_di: Show DI+ / DI– (true/false)
show_adx: Show ADX line (true/false)
Usage:
Use the ADX to gauge trend strength.
DI+ above DI– indicates bullish pressure; DI– above DI+ indicates bearish pressure.
ADX color and fill provide visual cues for trend strength and potential entry signals.
Cross markers alert when trend strength is increasing or decreasing relative to the threshold.

EMA Cross + RSI + ADX - Autotrade Strategy V2Overview
A versatile trend-following strategy combining EMA 9/21 crossovers with RSI momentum filtering and optional ADX trend strength confirmation. Designed for both cryptocurrency and traditional futures/options markets with built-in stop loss management and automated position reversals.
Key Features
Multi-Market Compatibility: Works on both crypto futures (Bitcoin, Ethereum) and traditional markets (NIFTY, Bank NIFTY, S&P 500 futures, equity options)
Triple Confirmation System: EMA crossover + RSI filter + ADX strength (optional)
Automated Risk Management: 2% stop loss with wick-touch detection
Position Auto-Reversal: Opposite signals automatically close and reverse positions
Webhook Ready: Six distinct alert messages for automation (Entry Buy/Sell, Close Long/Short, SL Hit Long/Short)
Performance Metrics
NIFTY Futures (15min): 50%+ win rate with ADX filter OFF
Crypto Markets: Requires extensive backtesting before live deployment
Optimal Timeframes: 15-minute to 1-hour charts (patience required for higher timeframes)
Strategy Logic
Entry Signals:
LONG: EMA 9 crosses above EMA 21 + RSI > 55 + ADX > 20 (if enabled)
SHORT: EMA 9 crosses below EMA 21 + RSI < 45 + ADX > 20 (if enabled)
Exit Signals:
Opposite EMA crossover (auto-closes current position)
Stop loss hit at 2% from entry price (tracks candle wicks)
Technical Indicators:
Fast EMA: 9-period (short-term trend)
Slow EMA: 21-period (primary trend)
RSI: 14-period with 55/45 thresholds (momentum confirmation)
ADX: 14-period with 20 threshold (trend strength filter - optional)
Market-Specific Settings
Traditional Markets (NIFTY, Bank NIFTY, S&P Futures, Options)
Recommended Settings:
ADX Filter: Turn OFF (less choppy, cleaner trends)
Timeframe: 15-minute chart
Win Rate: 50%+ on NIFTY Futures
Why No ADX: Traditional markets have more institutional participation and smoother price action, making ADX unnecessary
Cryptocurrency Markets (BTC, ETH, Altcoins)
Recommended Settings:
ADX Filter: Turn ON (ADX > 20)
Timeframe: 15-minute to 1-hour
Extensive backtesting required before live trading
Why ADX: Crypto markets are highly volatile and prone to false breakouts; ADX filters low-quality chop
Best Practices
✅ Backtest thoroughly on your specific instrument and timeframe
✅ Use larger timeframes (1H, 4H) for higher quality signals and better risk/reward
✅ Adjust RSI thresholds based on market volatility (try 52/48 for more signals, 60/40 for fewer but stronger)
✅ Monitor ADX effectiveness - disable for traditional markets, enable for crypto
✅ Proper position sizing - adjust default_qty_value based on your capital and instrument price
✅ Paper trade first - test for 2-4 weeks before risking real capital
Risk Management
Fixed 2% stop loss per trade (adjustable)
Stop loss tracks candle wicks for accurate execution
Positions auto-reverse on opposite signals (no manual intervention needed)
0.075% commission built into backtest (adjust for your broker)
Customization Options
All parameters are adjustable via inputs:
EMA periods (default: 9/21)
RSI length and thresholds (default: 14-period, 55/45 levels)
ADX length and threshold (default: 14-period, 20 threshold)
Stop loss percentage (default: 2%)
Webhook Automation
This strategy includes six distinct alert messages for automated trading:
"Entry Buy" - Long position opened
"Entry Sell" - Short position opened
"Close Long" - Long position closed on opposite crossover
"Close Short" - Short position closed on opposite crossover
"SL Hit Long" - Long stop loss triggered
"SL Hit Short" - Short stop loss triggered
Compatible with Delta Exchange, Binance Futures, 3Commas, Alertatron, and other webhook platforms.
Important Notes
⚠️ Crypto markets require extensive backtesting - volatility patterns differ significantly from traditional markets
⚠️ Higher timeframes = better results - 15min works but 1H/4H provide cleaner signals
⚠️ ADX toggle is critical - OFF for traditional markets, ON for crypto
⚠️ Not financial advice - always conduct your own research and use proper risk management
⚠️ Past performance ≠ future results - backtest results may not reflect live trading conditions
Disclaimer
This strategy is for educational and informational purposes only. Trading futures and options involves substantial risk of loss. Always backtest thoroughly, start with paper trading, and never risk more than you can afford to lose. The author assumes no responsibility for any trading losses incurred using this strategy.

Flow Control Oscillator (FCO)Flow Control Oscillator (FCO)
The Flow Control Oscillator (FCO) is a momentum-based indicator that combines volume analysis and money flow to determine who is in control of the market—buyers or sellers—and how strong that control is. Unlike pure price-based oscillators, FCO integrates both price action and volume distribution to provide a more complete picture of market dynamics.
How It Works
Core Components:
Money Flow Index (MFI) -
Scaled to -1 to +1 range
Measures the flow of money into and out of an asset
Identifies buying and selling pressure based on price and volume
Chaikin Money Flow (CMF) -
Already in -1 to +1 range
Measures the accumulation/distribution of volume
Shows whether volume is accumulating (buying) or distributing (selling)
Combined Flow Control Line (FCO Line) -
Equal-weighted composite of MFI and CMF
Smoothed with SMA (default: 3 periods)
Values above 0 = Buyers in control
Values below 0 = Sellers in control
Signal Line -
WMA of the FCO line (default: 6 periods)
Used for timing entries and confirming momentum shifts
Momentum Histogram-
Shows the rate of change in buyer/seller control
Weighted by ADX (Average Directional Index) when enabled
Larger bars = stronger momentum
ADX weighting filters out choppy, unreliable signals
Key Zones
Neutral Zone (-0.3 to +0.3): Balanced market, low conviction
Healthy Trend Zone (±0.3 to ±0.7): Clear control without exhaustion
Warning Zone (±0.7 to ±1.0): Extended, approaching exhaustion
Extreme Zone (beyond ±1.0): Overbought/oversold, reversal likely
What To Look For
Reversal Setups:
FCO in extreme zone (beyond ±1.0)
FCO crosses Signal line in opposite direction
Momentum histogram shrinking (weakening pressure)
Interpretation: Buyers or sellers are exhausted and losing control
Trend Strength Setups:
FCO crosses zero line (control shift)
Momentum histogram growing in the same direction
ADX confirms strong trend (no orange background)
Signal line moving in same direction as FCO
Interpretation: New control being established with building momentum
Divergences:
Price makes new high/low but FCO doesn't confirm
Indicates weakening momentum despite price movement
Early warning of potential reversal
Choppy Market Warning:
Orange background (ADX < 20)
Small momentum bars regardless of FCO position
Interpretation: Weak trend, avoid trading or use tight stops
Best Practices:
Use with context: Combine with support/resistance levels (like VWAP) for confluence
Multi-timeframe confirmation: Check higher timeframe FCO for overall bias
Wait for confirmation: Let signals develop rather than predicting turns
Respect extreme zones: Best reversal opportunities occur when FCO is beyond ±1.0
Filter with ADX: Pay attention to background coloring—avoid choppy conditions
The indicator includes comprehensive alert conditions for:
Reversal setups (extreme + cross + weakening momentum)
Trend strength signals (zero cross + growing momentum + strong ADX)
FCO/Signal crossovers
Extreme overbought/oversold conditions
Control shifts (buyers/sellers taking control)

Futures Fighter MO: Multi-Confluence Day Trading System ADX/SMI👋 Strategy Overview: The Multi-Confluence Mashup
The Futures Fighter MO is a comprehensive, multi-layered day trading strategy designed for experienced traders focusing on high-liquidity futures contracts (e.g., NQ, ES, R2K).
This strategy is a sophisticated mashup that uses the 1-minute chart for surgical entries while enforcing strict environmental filtering through higher-timeframe data. We aim to capture high-conviction moves only when multiple, uncorrelated signals align.
🧠 How the Logic Works (Concepts & Confluence)
Our logic is built on four pillars, which must align for a trade to be executed:
Primary Trend Filter
Indicators :
ADX/DMI (15-Minute Lookback)
Role :
Price action is filtered to ensure the ADX (17/14) is above 25, confirming a strong, prevailing market trend (Bullish or Bearish). Trades are strictly rejected during "Flat" (sideways) market regimes.
Entry Signal Types
The system uses multiple entry types:
- 🟢 Trend Long/Short: A breakout/rejection near the 200-Period EMA is confirmed by the primary ADX trend.
- 🔴 Engulfing Rejection: A strong signal when a Bullish/Bearish Engulfing or Doji prints near the long-term 500-Period EMA (emaGOD) while the Stochastic Momentum Index (SMI on 30M) is in an extreme overbought/oversold state (below $-40$ or above $40$).
Volatility & Volume Confirmation
Indicators: Average True Range (ATR) and 20-Period SMA of Volume
Role: Every entry requires a volume spike (Current Volume $> 1.5 \times$ SMA Volume) to confirm that the move is supported by significant liquidity. Volatility is tracked via ATR to define bar range and stop boundaries.
Structural Guardrails
Indicators: Daily Pivot Points (PP, S1-S3, R1-R3)
Role: Trades are disabled if the current bar's price range intersects with a Daily Pivot Point. This is a critical filter to avoid high-chop consolidation zones near key structural levels.
📊 Strategy Results & Required Disclosures
I strive to publish backtesting results that are transparent and realistic for the retail futures trader.
- Initial Capital: $50,000 - A realistic base for Mini/Micro futures contracts.
- Order Size: 1 Contract (Pyramiding up to 3) - Conservative risk relative to the account size.
- Commission: $0.11 USD per order - Represents realistic costs for low-cost brokers.
- Slippage: 2 Ticks - Accounts for expected market friction.
⚠️ Risk Management & Deviations
Stop-Loss: The strategy uses a dynamic stop-loss system where positions are closed upon a reversal (e.g., breaking the 50-Period EMA or failure to hold a Pivot Point), rather than a fixed tick-based stop. This is suited for experienced traders using a low relative risk (single Micro-contract entry) on a larger account. Users must confirm that the first entry's maximum potential loss remains below $10\%$ of their capital for compliance.
Trade Sample Size: Due to data limitations of the TradingView Essential plan (showing $\approx 50$ trades over 2 weeks), the sample size is under the ideal $100+$ target. Justification: This system is designed to generate signals across a portfolio of correlated futures markets (NQ, ES, R2K, Gold, Crude), meaning the real sample size for a user tracking the portfolio is significantly higher.
Drawdown Control: This strategy is designed for manual management. It requires the user to turn the script/alerts OFF after a significant drawdown and only reactivate it once a recovery trend is established externally.
The strategy uses a combination of dynamic trailing stops, structural support/resistance zones, and a fixed profit target to manage open positions.
🛑 Strategy Exit Logic
1. General Stop-Loss (Dynamic Trailing Stop)
These conditions act as the primary dynamic stop, closing the position if the market reverses past a key Moving Average (MA):
- Long Positions Closed When: The current bar's close crosses under the 50-Period EMA (emaLong).
- Short Positions Closed When: The current bar's close crosses above the 50-Period EMA (emaLong).
2. Profit Target (Fixed Percentage)
The script includes a general exit based on a user-defined profit percentage:
Take Profit Trigger: The position is closed when the currentProfitPercent meets or exceeds the input Profit Target (%) (default is 1.0% of the entry price).
3. Structural Exits (Daily Pivot Points)
These exits are high-priority, "close all" orders that trigger when the price fails to hold or reclaims a recent Daily Pivot Point, suggesting a failure of the current move.
- VR Close All - Long ($\sym{size} > 0$) - Price crosses under a Daily Resistance Level (R1, R2, or R3) minus 1 ATR within the last 10 bars. This indicates the current momentum failed to hold Resistance as support.
- VS Close All - Short ($\sym{size} < 0$) - Price crosses above a Daily Support Level (S1, S2, or S3) plus 1 ATR within the last 10 bars. This indicates the current momentum failed to hold Support as resistance.
4. Trend Failure Exit (Trend-Following Signals Only)
This exit protects against holding a position when the primary high-timeframe trend used for the entry has failed:
- Long Positions Closed When: The primary trend is no longer "bullish" for more than 2 consecutive bars (i.e., it turned "bearish" or "flat").
- Short Positions Closed When: The primary trend is no longer "bearish" for more than 2 consecutive bars (i.e., it turned "bullish" or "flat").
5. End of Day (EOD) Session Control
The final hard exits based on time:
- End of Session (EoS): At 11:30 AM, new trades are disabled (TradingDay := false). Open positions are kept.
- End of Day (EoD): At 1:30 PM, all remaining open positions are closed (strategy.close_all).
🤝 Development & Disclaimer
This script and description were created with assistance from Gemini and GitHub Copilot. My focus is on helping fellow real estate investors and day traders develop mechanically sound systems.
Disclaimer: This is for educational purposes only and does not constitute financial advice. Always abide by the Realtor Code and manage your own risk.

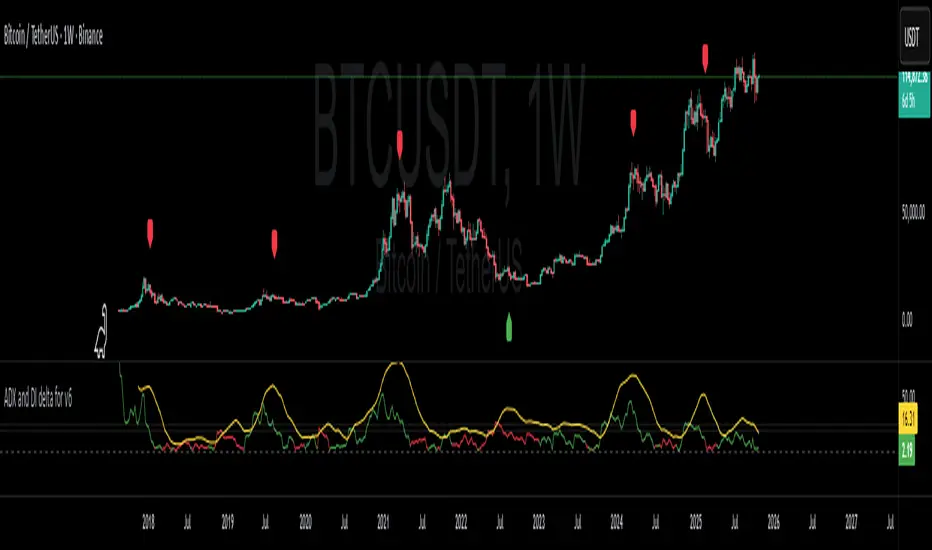
ADX and DI deltaJust a small adjustment to a well known indicator, the ADX with +DI and -DI.
I've always been annoyed of how cluttered this indicator is, specially do to the increasing gap between +DI and -DI, so I changed it up a bit.
ADX line has not been adjusted
+DI and -DI have now merged into deltaDI
deltaDI changes color depending on which value is higher (+DI > -DI = green line, else red line)
Plots a dashed 0 line (not editable)
Plots a two dotted lines at value 20 and 25 (editable)
Plots a label above/below price on the chart if the trend is exhausted and might end. (can be disabled)
Now you only have the ADX line together with a delta line.
The delta line is the gap between +DI and -DI and will change color depending on which one is highest and controlling the trend.
+DI = green line
-DI = red line
I've also added both a 20 and 25 horizontal dotted line.
Normally ADX should be 25 or higher to start a trend, but I do know a lot of people like to be greedy and jump in early in the trend build-up.
A dashed 0 line has been added, just because I felt like it. If either the ADX or delta ever cross below it without you editing the script yourself, just delete the script as it clearly doesn't do its job.
A red label_down will be plotted above the price when the ADX starts curling down and +DI > -DI. This indicates at best a breather for a bullish up trend or a possible reversal.
A red label_down will be plotted above the price if the ADX is above 25 and starts curling down while +DI > -DI. This indicates at best a breather for a bullish up trend or a possible reversal.
A green label_up will be plotted below the price if the ADX is above 25 and starts curling down while -DI > +DI. This indicates at best a breather for a bearish down trend or a possible reversal.
Enjoy my take on the indicator.
MTF Advanced DMI [NexusSignals]The MTF Advanced DMI is a multi-timeframe (MTF) enhancement of the classic Directional Movement Index (DMI) and Average Directional Index (ADX) indicator. It provides traders with insights into trend strength, direction, and momentum across multiple timeframes simultaneously. This version of DMI extends the single-timeframe analysis by incorporating two higher timeframes, allowing for better alignment of trends (e.g., confirming a short-term signal with longer-term context). It includes visual plots, a customizable data table showing MTF data, and expanded alert conditions for trend changes, consolidations, and reversals. Ideal for multi-timeframe strategies, trend confirmation, or avoiding false signals in volatile markets.
Key features include:
Multi-Timeframe Analysis: Displays DMI/ADX data for the current chart timeframe, plus two user-defined higher timeframes (e.g., 4H and 1D).
A trend strength metric that quantifies bullish/bearish dominance on each timeframe.
A dynamic table summarizing real-time MTF values, with color-coded signals, arrows, and buy/sell pressure percentages.
Visual fills and arrows for intuitive trend reading.
Built-in alerts for key events, including MTF-specific conditions (note: higher TF alerts may repaint due to live candle calculations via request.security).
How It Works
The indicator calculates DMI/ADX on three timeframes: the current chart TF, a mid-higher TF (default: 4H), and a highest TF (default: 1D).
For each:
+DI (Plus Directional Indicator): Upward movement strength.
-DI (Minus Directional Indicator): Downward movement strength.
ADX: Overall trend strength.
Trend Strength: ((+DI - -DI) / (+DI + -DI)) * ADX – positive for bullish, negative for bearish.
Buy/Sell %: Percentage of buyer/seller control in the candle based on HLC.
Plots focus on the current TF:
Strength Histogram: Color-coded (green bullish, red bearish).
ADX Line: White, with direction arrows.
+DI/-DI Lines: Green/red, with fills above 15 for strong trends.
Horizontal lines at 15 (consolidation) and 25 (strong trend).
The table (optional) shows data for the current timeframe candle, previous current timeframe candle, and the two higher TFs (if different from current), enabling quick cross-TF comparisons.
Inputs
General Settings:
DMI Length (default: 14): Period for +DI/-DI.
ADX Smoothing (default: 14): ADX period.
ADX Consolidation Threshold (default: 15): Low ADX suggests sideways.
ADX Stronger Trend Threshold (default: 25): High ADX indicates strong trends.
Higher Timeframe (default: 240/4H): Mid-level TF for MTF analysis.
Highest Timeframe (default: 1D): Top-level TF for broader context.
Threshold for Strong Bullish/Bearish DMI Strength (defaults: 10 / -10): For strength alerts.
Table Settings:
Show Table? (default: true): Toggle table visibility
Table Text Color, Header Color, Text Size (default: small)
Position (default: middle_right): Customize for your chart
Interpretation
Bullish Alignment: +DI > -DI across TFs, rising +DI (↑), Strength > 0 (green), Buy% > Sell%. Stronger if ADX > 25 on higher TFs.
Bearish Alignment: -DI > +DI, rising -DI (↑), Strength < 0 (red), Sell% > Buy%. Confirm with rising ADX on MTF.
Consolidation: +DI/-DI < 20 and ADX ≤ 15 (blue fill). Check if higher TFs show the same for range-bound confirmation.
Crossovers: +DI above -DI for bullish; reverse for bearish. MTF agreement reduces false signals.
Fills: Highlight dominant trends above 15 (green bullish, maroon bearish).
MTF Insight: Use the table to spot divergences (e.g., bullish current TF but bearish on daily) for potential reversals.
Combine with support/resistance or other momentum oscillators like macd, rsi, stochastic for robust strategies. Test on various assets and TFs to find the best settings that suit your trading style.
Alerts
Includes 20 alert conditions, with MTF extensions (higher TF alerts may repaint – use with caution for live trading):
Strength crossing 0 or bullish/bearish thresholds (on current and higher TFs).
+DI/-DI crossovers (bullish/bearish) on current TF.
ADX above strong threshold.
+DI/-DI above 25 or below 15.
Consolidation detection.
MTF-specific: Strength changes on higher TFs (e.g., "Strength Above Bullish Threshold on TF1").
Configure in TradingView by selecting from the alert dropdown.
Usage Tips
Select higher TFs that suit your strategy (e.g., 1H chart with 4H and Daily for day trading).
Use the table for at-a-glance MTF alignment without switching charts.
Customize appearance to avoid clutter on busy setups.
Backtest thoroughly, especially noting potential repainting on higher TFs.

Advanced DMI [NexusSignals]Overview
The Advanced DMI is a enhanced version of the classic Directional Movement Index (DMI) and Average Directional Index (ADX) indicator, designed to provide traders with deeper insights into trend strength, direction, and momentum. It combines visual plots, a customizable data table, and multiple alert conditions to help identify bullish/bearish trends, consolidations, and potential reversals. This indicator is ideal for trend-following strategies, scalping, or swing trading across various timeframes and assets.
Key enhancements include:
A trend strength metric that quantifies bullish/bearish dominance.
A dynamic table displaying real-time and historical DMI/ADX values, with color-coded signals and buy/sell pressure percentages.
Visual fills and arrows for quick trend interpretation.
Built-in alerts for key crossovers, threshold breaches, and consolidation phases.
The indicator calculates and display:
+DI (Plus Directional Indicator): Measures upward price movement strength.
-DI (Minus Directional Indicator): Measures downward price movement strength.
ADX: Gauges overall trend strength (higher values indicate stronger trends).
Trend Strength: A normalized score computed as ((+DI - -DI) / (+DI + -DI)) * ADX, ranging from negative (bearish) to positive (bullish). This helps quantify trend bias.
Buy/Sell %: Candle body analysis showing the percentage of buyer (close above low) vs. seller (high above close) control in the current bar.
Plots include:
Strength Histogram : Color-coded columns (green for bullish, red for bearish) to visualize trend intensity.
ADX Line : White line showing trend strength, with arrows indicating rising/falling.
+DI and -DI Lines: Green (+DI) and red (-DI) lines with conditional fills above the 15 threshold for strong trends.
Horizontal threshold lines at 15 (consolidation threshold) and 25 (strong trend threshold).
The table (optional) summarizes data for the current candle, previous candle, and two candles ago, including arrows for directional changes and color highlights for quick scans.
Inputs
General Settings:
DMI Length (default: 14): Period for +DI/-DI calculation.
ADX Smoothing (default: 14): Smoothing period for ADX.
ADX Consolidation Threshold (default: 15): Below this, suggests sideways market.
ADX Stronger Trend Threshold (default: 25): Above this, indicates a robust trend.
Threshold for Strong Bullish/Bearish DMI Strength (defaults: 10 / -10): Levels for strength alerts.
Table Settings:
Show Table? (default: true): Toggle the data table on/off.
Table Text Color, Header Color, Text Size, Position: Customize appearance and placement (e.g., middle_right).
How It Works
Interpretation
Bullish Signals: +DI > -DI, rising +DI (↑ arrow), Strength > 0 (green histogram), Buy% > Sell%. Look for ADX > 25 for confirmed uptrends.
Bearish Signals: -DI > +DI, rising -DI (↑ arrow), Strength < 0 (red histogram), Sell% > Buy%. ADX rising above thresholds strengthens the downtrend.
Consolidation: Both +DI and -DI < 20, ADX ≤ 15 (blue fill possible). Use this to avoid choppy markets.
Crossovers: +DI crossing above -DI suggests bullish reversal; opposite for bearish.
Fills: Areas above 15 highlight dominant trends (green for bullish, maroon for bearish).
Combine with price action or other indicators like RSI for better accuracy. Works on any timeframe, but test on historical data for your strategy.
Alerts
The indicator includes 12 built-in alert conditions for automation:
Strength crossing above/below 0 or bullish/bearish thresholds.
+DI/-DI crossovers (bullish/bearish).
ADX crossing above strong threshold.
+DI/-DI crossing above 25 or below 15.
Consolidation detection (low ADX with flat DI lines).
Set up alerts in TradingView by selecting the condition from the dropdown.
Usage Tips
Enable the table for quick multi-candle analysis without scrolling the chart.
Customize colors and positions to fit your workspace.
Backtest on your favorite assets (e.g., stocks, forex, crypto) to optimize thresholds.
For faster loading on large datasets, the script is optimized to update the table only on the last bar.
This indicator is provided by NexusSignals for educational and trading purposes. Always use risk management and verify signals. Feedback welcome!

Turtle Strategy - Triple EMA Trend with ADX and ATRDescription
The Triple EMA Trend strategy is a directional momentum system built on the alignment of three exponential moving averages and a strong ADX confirmation filter. It is designed to capture established trends while maintaining disciplined risk management through ATR-based stops and targets.
Core Logic
The system activates only under high-trend conditions, defined by the Average Directional Index (ADX) exceeding a configurable threshold (default: 43).
A bullish setup occurs when the short-term EMA is above the mid-term EMA, which in turn is above the long-term EMA, and price trades above the fastest EMA.
A bearish setup is the mirror condition.
Execution Rules
Entry:
• Long when ADX confirms trend strength and EMA alignment is bullish.
• Short when ADX confirms trend strength and EMA alignment is bearish.
Exit:
• Stop Loss: 1.8 × ATR below (for longs) or above (for shorts) the entry price.
• Take Profit: 3.3 × ATR in the direction of the trade.
Both parameters are configurable.
Additional Features
• Start/end date inputs for controlled backtesting.
• Selective activation of long or short trades.
• Built-in commission and position sizing (percent of equity).
• Full visual representation of EMAs, ADX, stop-loss, and target levels.
This strategy emphasizes clean trend participation, strict entry qualification, and consistent reward-to-risk structure. Ideal for swing or medium-term testing across trending assets.

Multiple Symbol Trend Screener [Pineify]Multiple Symbol Trend Screener Pineify – Ultimate Multi-Indicator Scanner for TradingView
Empower your trading with deep market insights across multiple symbols using this feature-rich Pine Script screener. The Multiple Symbol Trend Screener Pineify enables traders to monitor and compare trends, reversals, and consolidations in real-time across the biggest equity symbols on TradingView, through a synergistic blend of popular technical indicators.
Key Features
Monitor up to 15 symbols and their trends simultaneously
Integrates 7 professional-grade indicators: MA Distance, Aroon, Parabolic SAR (PSAR), ADX, Supertrend, Keltner Channel, and BBTrend
Color-coded table display for instant visual assessment
Customizable lookback periods, indicator types, and calculation methods
SEO optimized for multi-symbol trend detection, screener, and advanced TradingView indicator
How It Works
This indicator leverages TradingView’s Pine Script v6 and request.security() to process multiple symbols across selected timeframes. Data populates a dynamic table, updating each cell based on the calculated value of every underlying indicator. MA Distance highlights deviation from moving averages; Aroon flags emerging trend strength; PSAR marks potential trend reversals; ADX assesses trend momentum; Supertrend detects bullish/bearish phases; Keltner Channel and BBTrend offer volatility and power insights.
Set up your preferred symbols and timeframes
Each indicator runs its calculation per symbol using its parameter group
All results are displayed in a table for a comprehensive dashboard view
Trading Ideas and Insights
Traders can use this screener for cross-market comparison, directional bias, entry/exit filtering, and comprehensive trend evaluation. The screener is excellent for swing trading, day trading, and portfolio tracking. It enables confirmation across multiple frameworks — for example, spotting momentum with ADX before confirming direction with Supertrend and PSAR.
Identify correlated movements or divergences across selected assets
Spot synchronized trend changes for basket trading ideas
Filter symbols by volatility, strength, or trend status for precise trade selection
How Multiple Indicators Work Together
The screener’s edge lies in its intelligent correlation of popular indicators. MA Distance measures the proximity to chosen moving averages, ideal for spotting overbought/oversold conditions. Aroon reveals the strength of new price trends, PSAR indicates reversal signals, and ADX quantifies the momentum of these trends. Supertrend provides a directional phase, while Keltner Channel & BBTrend analyze volatility shifts and band compressions. This amalgamation allows for a robust, multi-dimensional market snapshot, capturing details missed by single-indicator tools.
By displaying all key metrics side-by-side, the screener enables holistic decision-making, revealing confluence zones and contradiction areas across multiple tickers and timeframes.
Unique Aspects
Original implementation combining seven independent trend and momentum indicators for each symbol
Rich customization for symbols, timeframes, and all indicator parameters
Intuitive color-coding for quick reading of bullish/bearish/neutral signals
Comprehensive dashboard for instant actionable insights
How to Use
Load the indicator onto your TradingView chart
Go to the script’s settings and input your preferred symbols and relevant timeframes
Set your desired parameters for each indicator group: Moving Average type, Aroon length, PSAR values, ADX smoothing, etc.
Observe the results in the top-right table, then use it to filter candidates and validate trade setups
The screener is suitable for all timeframes and asset classes available on TradingView. Make sure your chart’s timeframe matches the one used in the scanner for optimal accuracy.
Customization
Choose up to 15 symbols to monitor in a single dashboard
Customize lookback periods, indicator types, colors, and display settings
Configure alerting options and thresholds for advanced trade automation
Conclusion
The Multiple Symbol Trend Screener Pineify sets a new standard for multi-asset screening on TradingView. By elegantly merging seven proven technical indicators, the screener delivers powerful trend detection, reversal analysis, and volatility monitoring — all in one dashboard. Take your trading to new heights with in-depth, customizable market surveillance.
