ATR Bands with QQE [LM]Hello traders,
I would like to present you ATR Bands with QQE. This indicator is different than my other indicators I used QQE oscillator as an entry indicator, and atr bands I have used as an exit indicator.
You can see 2 set of bands with different multiplicator, first is used as first target profit, stop loss and second as a second target
There are two modes that takes, first is static mode that gives you lines with 1st, 2nd target profit and in red color stop loss.
Second mode has static first target and trailing stop loss
Settings:
Genreal settings - basic setting of source for atr bands, line settings,
First atr bands setting
Second atr bands setting
QQE settings
Cheers,
Lukas
真實波幅均值(ATR)

Stochastic + Keltner Channels for ScalpingSimple arrow indicator, indicating the direction go the next slight movement. This indicator will work on any time frame or market.
How does this indicator work?
It will use Stochastic and Keltner Channels to detect potential reversals depending on the frequency you choose in the indicator's settings. The higher the frequency, the fewer candles will be used in the calculation.
When to use this indicator?
It will work better in higher time frames for low volatility indicators. You can mix with other indicators like RSI or ADX. This way, you will be able to check if the time selected frame has enough volatility to move the price enough to cover the spreads and fees of your broker.
When to exit the trade after the signal from this indicator?
A good target would be for 1x ATR value and stop-loss 2x the ATR value. Doing trailing stop will reduce your risk and secure some profits, but make sure to use values for possible fakeouts
Can this indicator be used alone as the main source of entry signal for the trades?
You can use it alone, but I recommend mixing with other trend-based indicators, like Moving Averages, so you get the best results. Since it's for scalping purposes, small moments, and reversals, it doesn't have the trend filter, but it can work trading in favor of a significant trend as well
this is a better version of my other script Scalping Arrows

Lot Size by doclribeiroThis script calculate which values should LOT, SL and TP be to trade the pair selected on TM
By default SL and TP are calculated using ATR: timeframe 1H for SL and timeframe 15min for TP.The user can also specify the SL and also the TP, or the amount of pipets to calculate SL or TP.
Kind Regrads
Miguel Campos

Heikin Ashi Trailing Stoploss ActivationThe Basics
This indicator should be used on regular candle sticks. It is possible to trigger an alert, when the block flips from red to green bar. Or vice versa.
Red block represents a red Heikin Ashi candle.
Green block for green Heikin Ashi candle.
It can be used as a trailing stoploss for (DCA/ TV) bots, when riding trends.
What Makes It Different
The user can preset the price (of the asset e.g. BTC), where it will start looking for Heikin Ashi flips. Every Heikin Ashi flip before this preset price will be ignored. Preset prices could be chosen tactically at resistance levels.
Different time frames of Heikin Ashi flips can be used together. E.g. 10 min, 3 hour or 2 Day time frames. If this is possible within your Tradingview subscription.
Example
The user has a long position (bought at the green arrow.) The user wants to start trailing at price 88 USDT (blue line).
The indicator will only trigger when the following conditions are met:
Cross of red block on the indicator (representing red Heikin Ashi candle)
Price has crossed 88 USDT
If the candlestick turns from a green to a red block, before crossing 88 USDT. It will NOT trigger the alert. Visible as the orange down arrows. In the indicator below it is displayed as a red block.The alert will go off at the red down arrow on 10th Nov (if chosen for Once per bar close). The price condition of 88 USDT was already met at 7th Nov.
Final Words
Disclaimer: Please use it with care and at own risk. The owner of this indicator is not liable for any financial losses.
Past performance is no guarantee of future returns.

Trailing Stop AlertsThis script is designed as an ATR-based trailing stop tool to assist in managing open positions.
Once you're involved in a profitable trade, if you add this script to your chart you'll be prompted to select a bar to begin trailing from.
You can then adjust the candle lookback distance for swing high/lows (7 by default), the ATR multiplier (1.0 by default), and the direction to trail (Long/Short).
You can also adjust the ATR period in the settings menu if you want to (14 period by default).
Once the script is added to your chart, it will begin drawing your trailing stop and you can then set up alerts.
Alert Options:
Any alert() function call : Will trigger an alert for both conditions (trailing stop updated, trailing stop hit)
Alert Conditions : Trailing Stop Update will trigger whenever the stop is updated, Trailing Stop Hit will trigger whenever the stop is hit.
Note: the alerts will only fire once per bar close and the trailing stop will not update on realtime bars.

ATR Bands with vortex indicator [LM]Hello traders,
I would like to present you ATR Bands with vortex indicator. This indicator is different than my others I used not that known vortex indicator as a entry indicator, and atr bands I have used as a exit indicator.
You can see 2 set of bands with different multiplicator, first is used as first target profit, stop loss and second as a second target
There are to modes that takes, first is static mode that gives you lines with 1st, 2nd target profit and in red color stop loss
In the static mode you can also turn off extending line he price reach the level:
Second mode is tracking atr first band with candle offset of your choosing:
The trailing functionality is not working 100% but I as thinking to share it anyway and see maybe some feedback and meantime I will fix the trailing behavior.
Settings:
Genreal settings - basic setting of source for atr bands, line settings,
First atr bands setting
Second atr bands setting
Vortex setting
Cheers and Happy Xmas,
Lukas

WMA ATR CHECK V2.0 [2022] 3 Levels WMA ATR Version V2.0 Check 3 Levels indicator information:
------------------------------------
***We added an option that can increase the number and decrease the number of WMA ATR CHECK processing.
Then add another line to support heavy volatility by using WMA ATR x15 x2 x4 to support heavy volatility market.
------------------------------------
With my knowledge of MOVING AVERAGE, I created a new average of ATR by dividing the average by the number of days or the number of candles I have.
It can indicate the possibility of support and resistance in the market or even a market reversal point.
It is very useful for people looking for support or resistance or selling points to buy.
The green line indicates the average ATR rate, processed with MOVING AVERAGE, can understand the market where it can go down.
The red line indicates the average ATR rate, processed by MOVING AVERAGE, can understand the market where it can go up.
By taking ATR *6 * 4 / MOVING AVERAGE *4 along the lines that everyone can see.
ด้วยความรู้ที่ผมมีเกี่ยวกับ MOVING AVERAGE ผมได้สร้างค่าเฉลี่ยใหม่ของ ATR โดยเอาไปมาหารค่าเฉลี่ยด้วยจำนวนวันหรือจำนวนแท่งเทียนที่มี
มันสามารถบอกถึงความเป็นไปได้ของแนวรับแนวต้านในตลาดหรือแม้แต่จุดกลับตัวของตลาด
มันมีประโยชน์มากสำหรับคนที่มองหาแนวรับหรือมองหาแนวต้านหรือจุดขายจุดซื้อ
เส้นสีเขียว บอกถึงอัตราค่าเฉลี่ยของ ATR ประมวลผลด้วย MOVING AVERAGE สามารถเข้าใจตลาดได้ว่าจะสามารถลงมาได้ถึงไหน
เส้นสีแดงบอกถึงอัตราค่าเฉลี่ยของ ATR ประมวลผลด้วย MOVING AVERAGE สามารถเข้าใจตลาดได้ว่าจะสามารถขึ้นไปได้ถึงไหน
โดยเอา ATR *6 * 4 / MOVING AVERAGE *4 ออกมาตามเส้นที่ทุกคนเห็น
Release Notes: We can use ATR to read price frames. and plan in trading
We've adjusted the color to make it look a bit lighter. for easy viewing of graphs

Supertraders ATR-RangeThis script calculates the ATR 5 periods daily of previous day and various percentages (5%, 7,5% and 10%) of it that we use to evaluate a possibility to try a break-in of a level. This percentages are expressed in points, ticks and a value in dollars for every contract.
Questo script calcola l'ATR daily 5 periodi del giorno precedente. Calcola anche varie percentuali di esso, in particolare 5%, 7,5% e 10%, utily per verificare lo sforamento in caso di break-in di un livello. Questi valori sono espressi in punti, ticks e valore in dollaro per contratto.

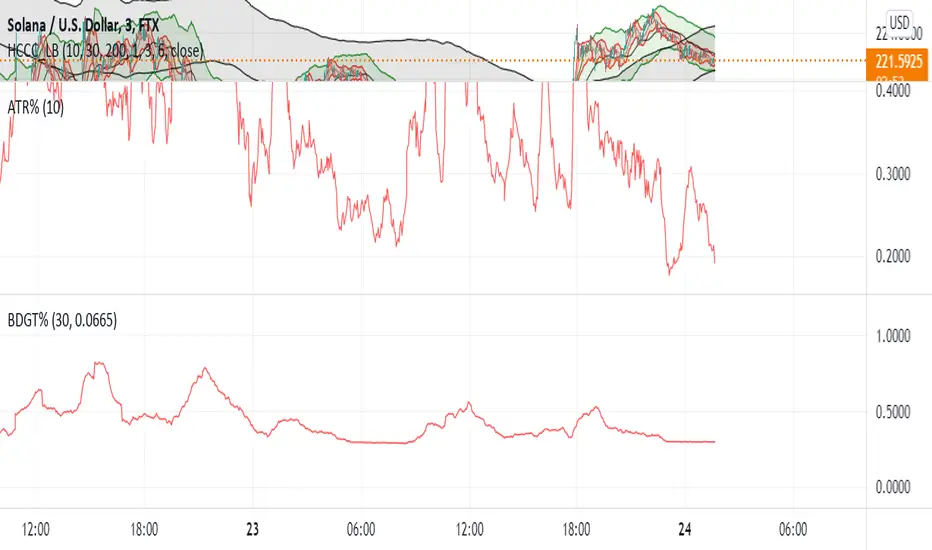
ATR %plot ATR as percentage relative to close price and also shows normal ATR value in datawindow without printing it

Smart Swing Strategy for StockSpecial indicator for stock but you can try another instrument.
Trend determination and buy/sell signals are using the Alligator system from Bill Williams .
To get maximum profit, the system uses the trailing stop technique using Average True Range (ATR) with 4 moving average options (RMA, SMA , EMA , WMA ).
Please leave comments if any opinions.
Disclaimer
The content is in any event provided with the intention of being for general circulation and availability only. As such it is not intended to and does not form part of any offer or recommendation directed at you specifically, or have any regard to your investment objectives, financial situation, or needs of yourself or any other specific person. Before committing to a trade or investment, please seek advice from financial or other professional advisers regarding the suitability of the trade for you. If you do not wish to seek such financial advice, please consider carefully whether the product is suitable for you as you alone remain responsible for your trading gains and losses.

Impulse levelsThe indicator detects impulses based on an increase in ATR and volume, and also plots levels based on these impulses.

ATR vs Daily DeltaThis indicator follows the idea of the average true range indicator, but splits red candles from green candles. It also displays daily deltas as a histogram chart. Finally, it allows you to "normalize" the indicator, which displays period percentage moves (shown in decimal form) instead of period deltas, and calculates the ATR from those percentages instead of period deltas.

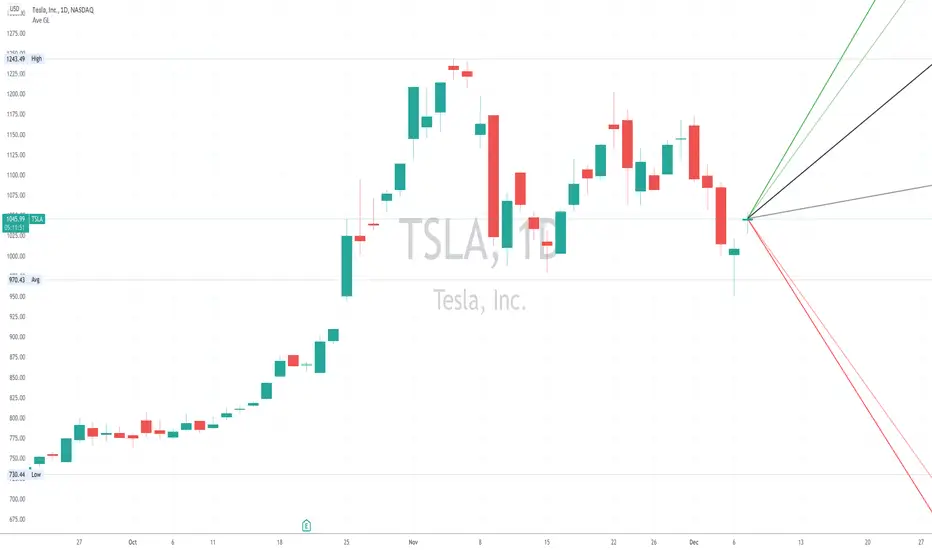
Average Gain/LossThe Average Gain/Loss indicator adds rays to show what the average trade range might be for a given ticker based on historical data.
Green lines are the average gain, red lines are the average loss and black are the overall average.
Darker lines are the average of close to close and lighter lines are the candle averages.
Default average is set to 50 bars but is adjustable in settings.
Have modification ideas for this indicator? Just let me know and I will gladly consider them!
RT - GANNGann relied heavily on geometrical and numerical relationships
and created several tools to help with his work. Among these
tools are the Square of Nine, Square of 144, and the Hexagon.
The Square of Nine, or Square as we will refer to here, can be
constructed in at least two ways. The static Square has the
number 1 at the center and the dynamic Square has the historic
low of the time series in the center.
EVERY 1 HOUR GANN CHANGE THE LAVELS ,ITS BASED ON CLOSE PRICE

Supertrend - Ladder ATRThis is a supertrend with slight twisted concept which can be very benefecial in strong trending markets to reduce stop loss distance and exit slightly quicker.
⬜ Concept
▶ When the instrument is trending up, regular ATR shows high values if there are big green candles. This affect the stoploss distance in regular supertrend which leads to wide stops or delayed lagging. When you are in long trade, what matters for stoploss is how much a negative candle can move within bar. Hence, using ATR derived only based on red candles is more beneficial for trailing stops on long signals. Same applies to short trades where using ATR derived from only green candles is more efficient than overall ATR.
▶ ATR will be minimal when the volatility is less and ATR will increase with volatility. That means, once you are in trade, the trailing of stoploss also will vary based on ATR (or volatility). With regular ATR and supertrend, chances of stop loss distance widening is high with increased volatility even though stoploss levels will not move down. This again poses the risk of higher drawdown during trade closure and also keeps in the trade during ranging market. To avoid this, the second trick we are using here is only to reduce the atr stoploss difference when in trade. That is, when in long trade and negative candles ATR is increasing, we will not consider that. We will consider the new ATR only if it is lesser than previous bar ATR.
Effect of these changes on the trending market is quite visual. Lets take example of USDTRY
Settings are quite simple and does not vary much from regular supertrend settings.

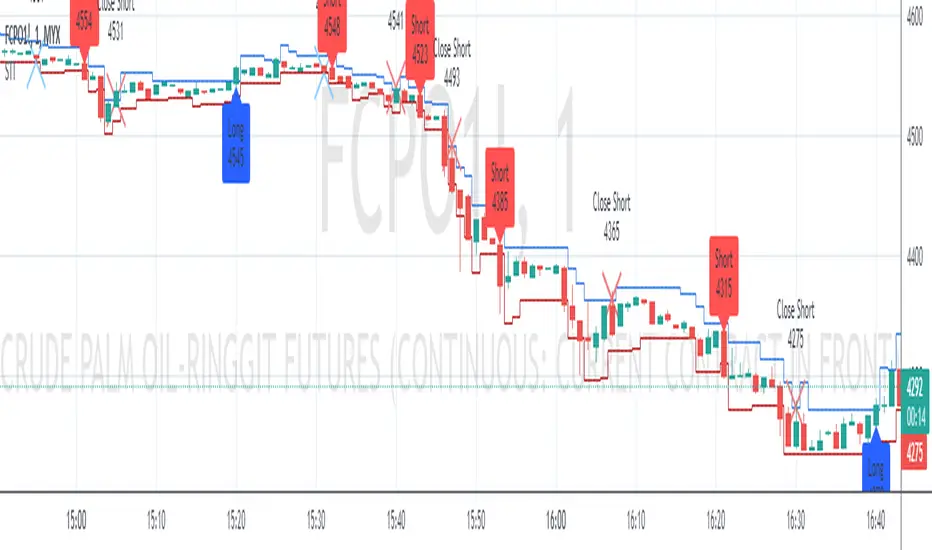
Swing Indicator (Tune for FCPO)Special indicator for FCPO (Crude Palm Oil Futures - Bursa Malaysia Derivative) traders but you can try another instrument.
Trend determination and buy/sell signals are using the Alligator system from Bill Williams.
To get maximum profit, the system uses the trailing stop technique using Average True Range (ATR) with 4 moving average options (RMA, SMA, EMA, WMA).
Please leave comments if any opinions.
Disclaimer
The content is in any event provided with the intention of being for general circulation and availability only. As such it is not intended to and does not form part of any offer or recommendation directed at you specifically, or have any regard to your investment objectives, financial situation, or needs of yourself or any other specific person. Before committing to a trade or investment, please seek advice from financial or other professional advisers regarding the suitability of the trade for you. If you do not wish to seek such financial advice, please consider carefully whether the product is suitable for you as you alone remain responsible for your trading gains and losses.
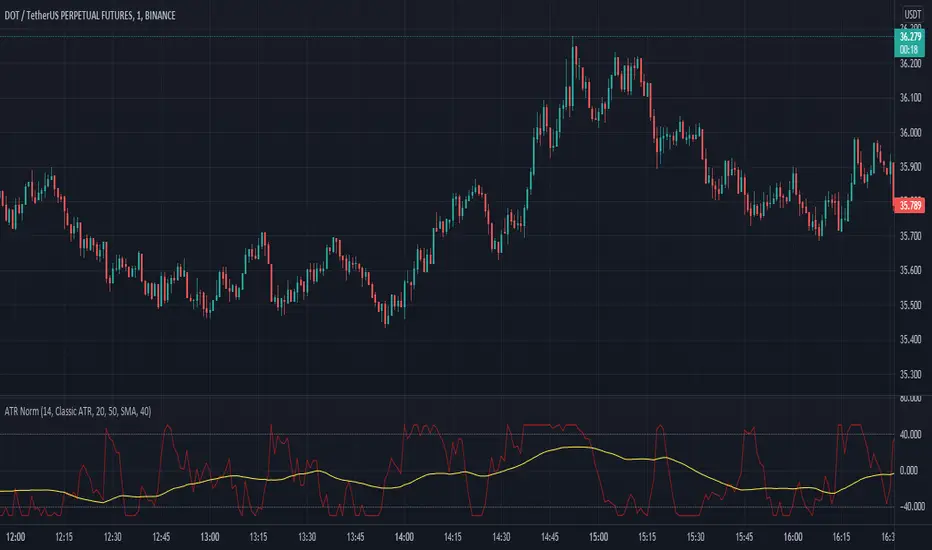
Average True Range NormalizedIntroduction
This simple script is the normalization of the common ATR indicator. The utility in normalization, in this case, is the contextualization of the absolute movements of the ATR compared to the previous candles. Not finding an indicator that reflected my needs, I created it and decided to make it available to the community.
The oscillator is fully based on the original ATR indicator, once normalized it varies its values between -50 and +50 and has a moving average based on it.
I added alarms:
- crossing of horizontal levels (default +40 -40)
- crossing of the moving average
Settings
ATR period : like a normal ATR indicator, the number of candles on which the ATR calculation is based
Smooth : like normal ATR indicator, type of moving average to smooth true range values
Normalization Period : Number of candles on which ATR normalization is based, it takes the maximum and the minimum values in the last N candles and creates the value -50 and +50, between these two values normalize the others.
MA Period : Period of MA based on ATR, this MA can be used like moving level to find the moment of low volatility
Type : Kind of MA, you can choose only between 3 types ( SMA, EMA, WMA )
Horizontal Lines Value : high and low level for high and low volatility
Alert on crossing Horizontal lines : enable alerts on crossing Horizontal Lines
Alert on crossing MA : enable alerts on crossing Moving Average
How to use
ATR isn't a directional indicator, but volatility is fuel for markets, low ATR values indicate quiet moments or consolidation movements, otherwise high ATR values indicate selling or buying pressure. A reversal in price with an increase in ATR would indicate strength behind that move.
The problem, for me, with normal ATR is that often the values have to be contextualized with older values, on the contrary being normalized you can:
- catch small fluctuations, and anticipate the decline;
- contextualize the values without having to look at the history in the previous candles
So:
- under MA or horizontal line the volatility is too low, it would be advisable to consider not opening positions;
- over MA line the volatility is raising and a reversal in price with an increase in ATR would indicate strength behind that move;
Remember that every statistical indicator is just a tool, it needs to be understood to be used at its best, otherwise, it is just a colored line in a colored graph.
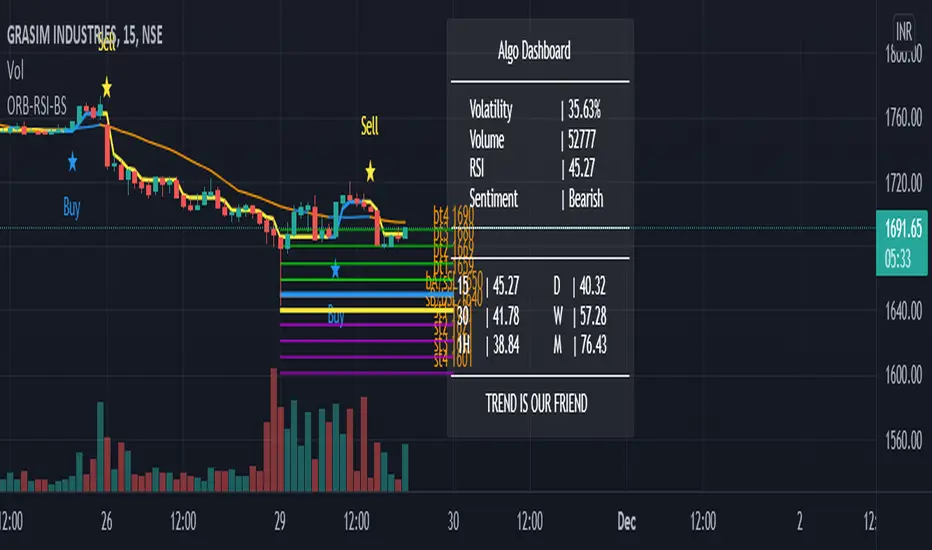
GANN-ORB-RSI-BSGann relied heavily on geometrical and numerical relationships
and created several tools to help with his work. Among these
tools are the Square of Nine, Square of 144, and the Hexagon.
The Square of Nine, or Square as we will refer to here, can be
constructed in at least two ways. The static Square has the
number 1 at the center and the dynamic Square has the historic
low of the time series in the center.
Best delta gridTradingThis indicator help grid traders to chose the best delta in their gridTrading.
The best delta gridTrading indicator is proportional to the Average true range.
MACD MTF Table Indicator MACD MTF Table Provide you Indicator Value for MTF 5,15,30,45,60,120,D,W,M in table format
user can also able to change value of Fast Length, slow length, Smoothing Line as per users requirement
also provided ATR Value for same timeframe NSE:NIFTY NSE:BANKNIFTY

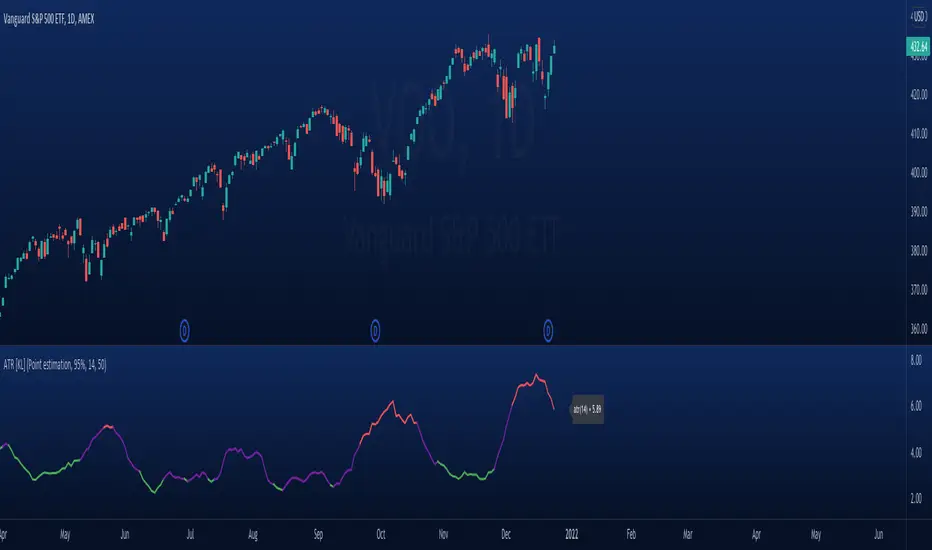
Modified ATR Indicator [KL]Modified Average True Range (ATR) Indicator
This indicator displays the ATR with relative highs and relative lows statistically determined.
What is ATR:
To know what ATR is, we need to understand what a True Range (TR) is.
- TR at a given bar is the highest distance between points: a) High vs low, b) High vs Close, and c) Low vs Close.
- ATR is the moving average of TRs over a predefined lookback period; 14 is the most commonly used.
- ATR can be mathematically expressed as:
Why is ATR Important
ATR often used to measure volatility; high volatility is indicated by high ATR, vice versa for low. This is a versatile tool allowing traders to determine entry/exit points, as well as the size of stop losses and when to take profits relative to it.
This is an opinion: Through observations, I have noticed that ATR can also indirectly tell us the levels of relative volume. This intuitively makes sense because in order to increase length of TR, high amounts of capital inflow/outflow is required (graphically speaking, high volume is required in order to make lengths of candle sticks longer). The relationship between ATR and relative volume should hold unless the market is illiquid to the extreme that there is no relationship between volume and price.
That said, knowing the relative lows/highs of ATR is very useful. It can be interpreted as:
- Relative high = high volatility, usually during sell offs
- Relative low = decreasing volume, could indicate price consolidation
Instead of arbitrarily determining whether ATR is high/low, this indicator will determine relative highs and relative lows using a simple statistical model.
How relative high/low is determined by this model
This indicator applies two-tailed hypothesis testing to test whether ATR (ie. say lookback of 14) has greatly deviated from a larger sample size (ie. lookback of 50). Assuming ATR is normally distributed and variance is known, then test statistic (z) can be used to determine whether ATR14 is within the critical area under Null Hypothesis: ATR14 == ATR50. If z falls below/above the left/right critical values (ie. 1.645 for a 90% confidence interval), then this is shown by the indicator through using different colors to plot the ATR line.
Bjorgum Key Levels
Key Levels Aims to capture 3 of the most significant points in price action
Breakouts
False Breakouts (Traps)
Back Checks
These 3 points alone, if properly identified, can be some of the most significant points of movement in the price history of an asset and bring significant gains to traders, if capitalized on. Here are a few examples of these setups
Breakouts
Breakouts can bring significant rallies as the market swings one sided after key levels are breached. This entry type can bring large trending runs to follow. Momentum is on your side, but the trade off is a higher entry.
False Breakouts
Also known as a bull trap or a bear trap, false breaks can lead to swift and significant reversals and potential for a large and sudden move to the opposite side. When a key level breakout fails to hold, parties entering to capitalize on the "epic breakout" can get left holding the bag forcing them to exit at a loss, which can double the force of pressure. Traps can bring swift gains from good entry prices. However, price is still in a larger trend against you so momentum is weak, so price action is susceptible to roll over.
Backchecks
Back checks are pull backs in trend that find middle ground to the 2 areas already described. Both momentum and entry price are decent, but risk is defined as a key level has flipped offering entry with stops below demand, or above supply.
Combining these 3 methods helps to diversify risk, understand trend development, and bring steady gains. This script helps to identify these points to traders with analysis of key levels, price structure, and trend direction, while providing visual signals and alerts for when they occur.
Best of luck in your coding and trading and thank you for your support

node nirvanaThis indicator is suitable for those who have studied Mr. Nirvana's course, as well as those who work in the style of supply and demand.
