真實波幅均值(ATR)
Trex [MrD3v]To appreciate dear Mr.Khakestar efforts i have converted his mt4 ATR formula to pine script. All credits goes to him.
Special Thanks To shayankm
Long Step $ Short Step added
DR added
Standard SL added
Eng.SL and Hunter.SL added.
Incompatible default colors with dark theme now are fixed.
Colors can be changed from settings.
All drawing sizes can be modified from settings. (Change the sizes for your mobile device)
Now crypto and fx markets are automatically detected.
Added APR only working on Crypto and FX.
Outputs on "BTCUSD(T), FX, Main metals" are now rounded to pips.

V1=PRICE ACTION (INVITE ONLY SCRIPT)
Hello Traders,
Here i bring you my first Price Action Atr based Indictor combined with fib entry and exit trailing levels with minimum risk and maximum profit , as we must have seen at times as we enter the trend reverse and hits our stoploss . Keeping that in mind as i too stuggled and made losses so i decided and focused more on minimizing the stoploss and only on confirmation Long or Short trade is been initiated along with trailing Stoploss as explaned in the images below , why should we give market our money ;) as we are here to make money :D .. There is no holy grail as Stoploss wont be hit but yes it will be way less and all alerts are based on candle close ... Trend Screener is added too which will tell you about the trend .. One can use this on any chart and any timeframe and its very good for scalping too . Vwap and Baseline is added too just incase you want to enter trend manually ... Better results are on 15m and above . Hope you guys will like it and comment if you have any doubts..
-----------------
Disclaimer
Copyright by FaizanNawazz.
The information contained in my scripts/indicators/strategies/ideas does not constitute financial advice or a solicitation to buy or sell any securities of any type. I will not accept liability for any loss or damage, including without limitation any loss of profit, which may arise directly or indirectly from the use of or reliance on such information.
All investments involve risk, and the past performance of a security, industry, sector, market, financial product, trading strategy, or individual’s trading does not guarantee future results or returns. Investors are fully responsible for any investment decisions they make. Such decisions should be based solely on an evaluation of their financial circumstances, investment objectives, risk tolerance, and liquidity needs.
My scripts/indicators are only for educational purposes!
Happy Trading!

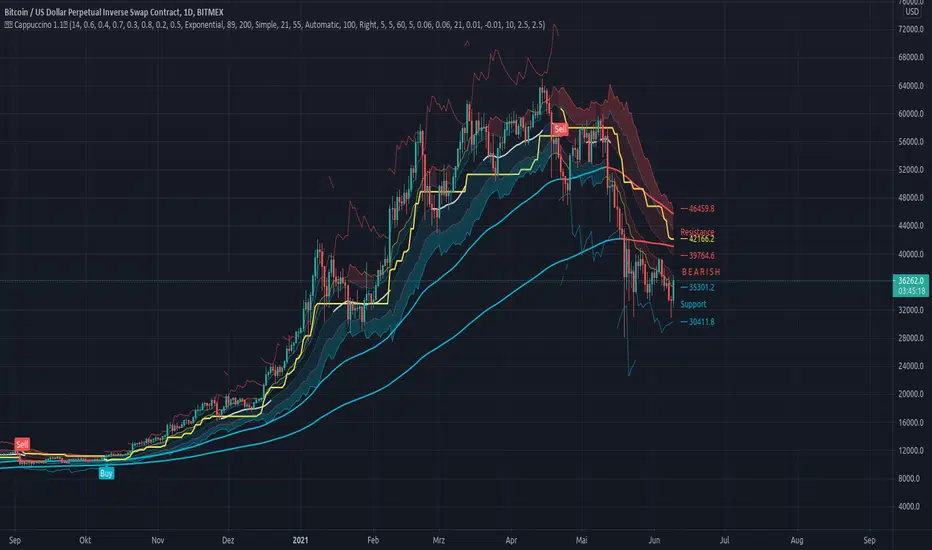
Cappuccino IndicatorThis is a indicator I built on the basis of RSI and price action.
It is the Cappuccino-Indicator. It calculates back the estimated price based on RSI with some optional filters and gives signals for buy and sell.
it works as follows:
- the current RSI value is calculated back to a estiamated market price
- shoutout to some developers who made some functions possible, this was a long work, I cannot find Your sources anymore, I'm sorry. Text me I will publish Your credits. You are awesome and I respect Your work.
- The principle is simple. as suggested by RSI Rookies the market is bullish when in certain RSI Levels, and bearish when in other
- This indicator also combines some trend channels for easier spotting good entries
- The Cappuccino Indicator tries to keep you in a trade as long as possible
- It uses ATR based Trailing SL for you to not get rekt
- It is just a piece of software, You're trading on Your own risk
Have fun.
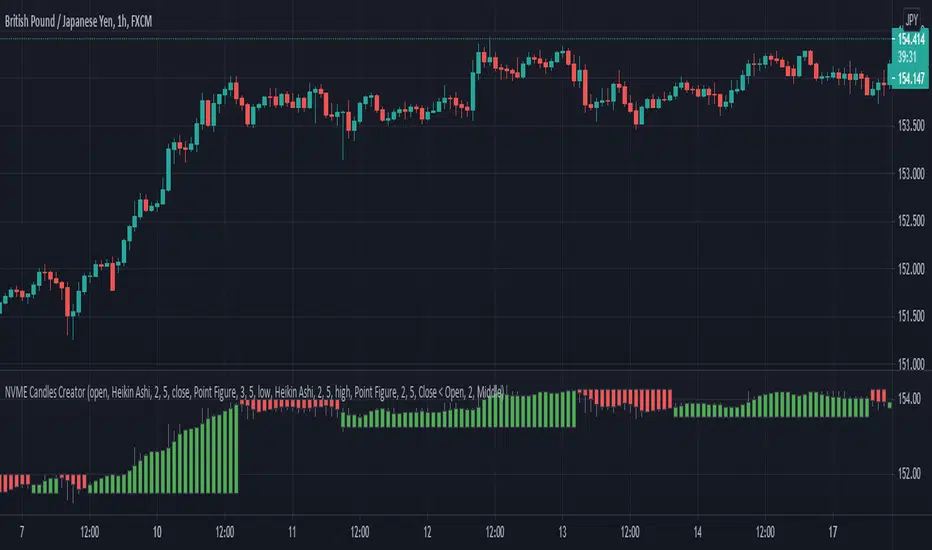
NVME Candles Creator Experimental //Note://
This is an experimental indicator that may provide you with useful information or it may not depending on how you use it and more information can be found below!
NVME Candle Creator indicator is an experimental indicator that allows you as the user to build your own candlestick system within a click of a button. The indicator uses data from 5 different chart series including the following: The default candle stick, Heikin Ashi, Renko (ATR Version), Kagi and the Point and Figure chart. Since there are 4 pieces of data from a candle plot such as the open, the close, the high and the low, we are able to edit each individually with our own data using the security() function and the chart series functions that are linked to the those specific charts. This indicator is designed to be used as a second chart alternative without having to take much screen space, however there are other uses to it such as using this indicator to find information about other chart types and possibly creating a noise free chart series using our integrated colour scheme system.
The features of this indicator are the following:
Sources (1-4) : These are customisable by changing the item listed on the drop down menu, the items displayed will be data from the charts such as open, close, high, low, hl2, hl3, and ohcl etc. There are 4 of these inputs as this will change the data that you are grabbing for the series. (Series 1 -> Close, Series 2 -> Open, Series 3 -> High, Series 4 -> Low)
Candle Style (1-4) : This is the chart series we will be using to get the final output of the indicator, this can be changed by selecting a different item in the dropdown menu. The following content of this drop down menu are: Default (Japanese Candlesticks), Heikin Ashi Candlesticks, ATR (Renko Version), Kagi and Point and Figure. These will strongly determine the final output of the indicator as they can change what data will be represented and how it will be displayed.
Length (1-4) : The value in this input field only affects the following candle style options: ATR, Kagi and Point and Figure. The reason is because these chart series include a customisable input in the form of reversal points or ATR value. Changing this value will determine the final design of the indicator as it can make the candles larger or smaller depending on the number inside the box.
Custom Timeframe (1-4) : This toggle will allow you to fetch data from a different timeframe of choice, however disabling this will fetch data from the current timeframe period.
Timeframe Value (1-4) : This input field is only active when the custom timeframe is enabled and this will change the security function so that it grabs data from the timeframe inputted and this can change the indicator's output so that the candles will look different but it doesn't have a significant change compared to the candle style feature.
Colour Filter: (Affects the candles plotted)
Option 1: "Close > Open" - Recolours the candles in a manner where candles will be green if that candle is greater than the open and the candles will be red if the close is less than the open.
Option 2: "Close < Open" - Recolours the candles in a manner where candles will be red if that candle is greater than the open and the candles will be green if the close is less than the open. (May be useful for some settings where the plots are different) - Use this as a colour correction.
Option 3: "None" - The colours will be removed so you will have to manually change it.
Dashboard: This can be turned off or turned on however it doesn't contain anything useful only a reminder that it isn't recommended to use this indicator alone as it is designed as an experimental indicator.
[JL] ATR Labels with FX Risk Position(USD)I always use ATR to set up SL. So I changed ATR Labels to calculate risk dollars based on curency pairs.
I can not update old ATR Labels title. So I publish this new script.
This pip value calculation is based on USD currency.
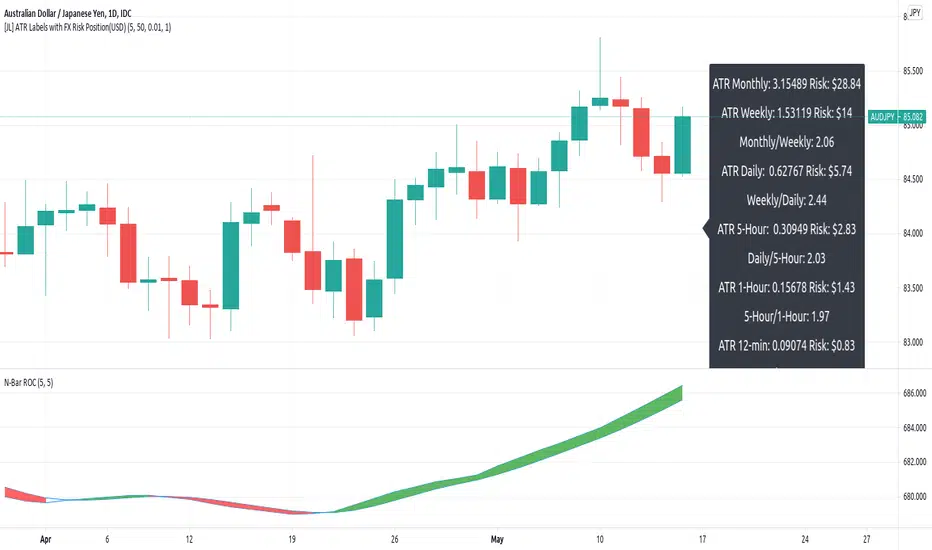
[JL] ATR LabelsJust need to see ATR values when I made Renko script. So I make this script.
I like number 5 so I use 5 to timeframe.
Calculate ATR for the following:
- Monthly
- Weekly
- Daily
- 5-Hour
- 1-Hour
- 12-Min
Label default displayed on right side and middle of 50 bars.

Position Sizing w/ ADR&ATR TrackingScript to use for position sizing based on portfolio size, max position, and max loss inputs. The option to use custom entry and stop are available, but default to last price for entry, and Low of Day (LoD) for stop. The ATR % is a measure of the low of day to current price as a percentage move.
Credit to LonesomeTheBlue for the base code on position sizing and TheScrutiniser/GlinckEastwoot for ADR formula
-Nelgoth, best of luck

MATR 4H Strategy - UpTradingEN // MATR 4H Strategy - UpTradin
Use 1:
This script is effective for all assets. Find out how to get the best performance. This indicator offers several possibilities:
- Only in TimeFrame 4H.
- The gray curve shows you the trend. You should not trade against it.
- Once the trend is established you can buy or sell according to the Buy and Sell sign.
- When the orange point (warning) appears you must remain attentive to a continuation of the movement or a reversal.
Use 2:
You can program limit orders using the green or red stripe. These are two bands that anticipate the high or low point of the price.
Legend:
- The gray line is an Ema 20 based on a Daily TimeFrame.
- The orange point means a continuation or a reversal.
- Buy means a buy zone.
- Sell means a sales area.
- The green curve allows you to program a limit order to buy.
- The red curve allows you to program a limited order to sell.
Operation:
This script works from an ATR programmable according to your needs and correlated according to an Ema. It also shows you the trend in a single one thanks to an Ema 20 based on Daily data.
FR // MATR 4H Strategy - UpTrading
Utilisation 1 :
Ce script est efficace pour la totalité des actifs. Découvrez comment obtenir le fonctionnement idéal. Cet indicateur offre plusieurs possibilités :
- Uniquement en TimeFrame 4H.
- La courbe grise vous indique la tendance. Il ne faut pas trader contre celle-ci.
- Une fois la tendance établie vous pouvez acheter ou vendre selon le signe Buy et Sell.
- Lorsque le point orange (warning) apparaît vous devez rester attentif à une continuation du mouvement ou d’un retournement.
Utilisation 2 :
Vous pouvez programmer des ordres limites grâce à la bande verte ou rouge. Il s’agit de deux bandes qui anticipent le point haut ou bas du prix.
Légende:
- La courbe grisée est une Ema 20 basée sur un TimeFrame Daily.
- Le point orange signifie une continuation ou un retournement.
- Buy signifie une zone d’achat.
- Sell signifie une zone de vente.
- La courbe verte vous permet de programmer un ordre limite à l’achat.
- La courbe rouge vous permet de programmer un ordre limité à la vente.
Fonctionnement:
Ce script fonctionne à partir d’un ATR programmable suivant vos besoins et corrélé suivant une Ema. Il vous indique également en une seule la tendance grâce à une Ema 20 basée sur des données en Daily.

Open Range Breakout with TSLThis ORB with TSL Indicator Session Time is Indian NSE and BSE Equity Market
This indicator Provide you 2 type Setup
Opening Range Plot Only for Observation
1st Range Breakout = Long
2nd Range Breakout = Short
How to work This Indicator?
When Market is Open This Indicator automatically Plot Opening Range High and Low,
if Market bullish & Candle Close above Opening Range high When This Indicator automatically Plot 1st Range High and Low if You Want to 1st Range High Plot Crossingup any Candle You can Also Add Alerts
if Market Bearish & Candle Close Below Opening Range Low When This Indicator automatically Plot 2nd Range High and Low if You Want to 2nd Range Low Plot CrossingDown any Candle You can Also Add Alerts
If you Have any Suggestion please mention here
Thank you so much
This Also Automatically start trailing SL on basis of ATR

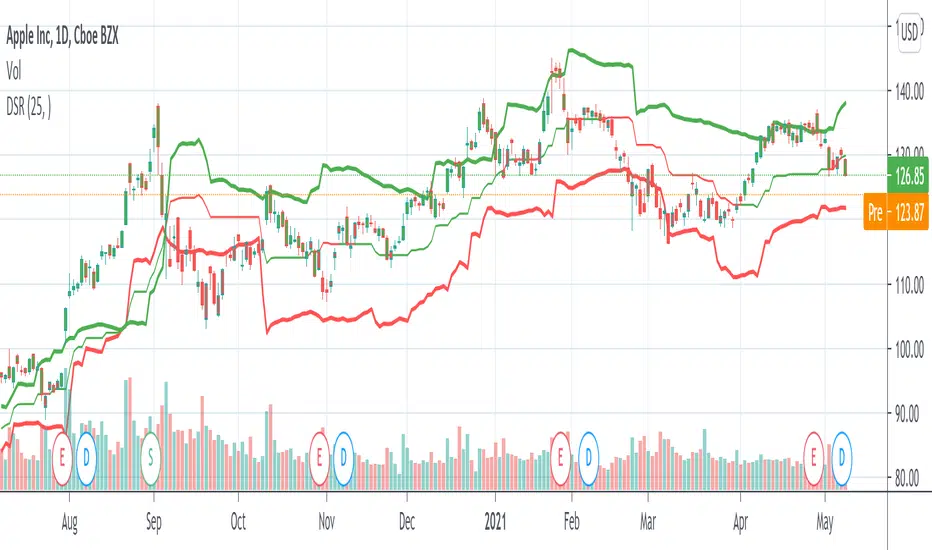
Dynamic Support And Resistance [CC]The Dynamic Support And Resistance Indicator was created by Mike Siroky (Stocks and Commodities pgs 14-18) and this is a handy indicator that will show you useful support and resistance levels no matter how the stock is doing right now. I have color coded the middle line to show buy and sell signals so buy when the line turns green and sell when it turns red.
Let me know if there are any other indicators you want me to publish!
Bonito's Indicator v1What Are Fibonacci Retracement Levels?
Fibonacci retracement levels are horizontal lines that indicate where support and resistance are likely to occur. They are based on Fibonacci numbers. Each level is associated with a percentage. The percentage is how much of a prior move the price has retraced. The Fibonacci retracement levels are 23.6%, 38.2%, 61.8%, and 78.6%. While not officially a Fibonacci ratio, 50% is also used.

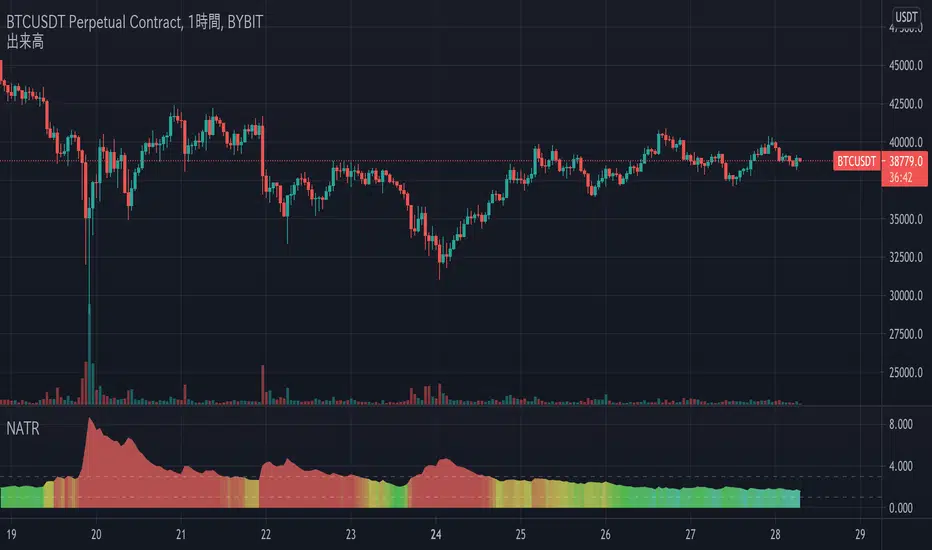
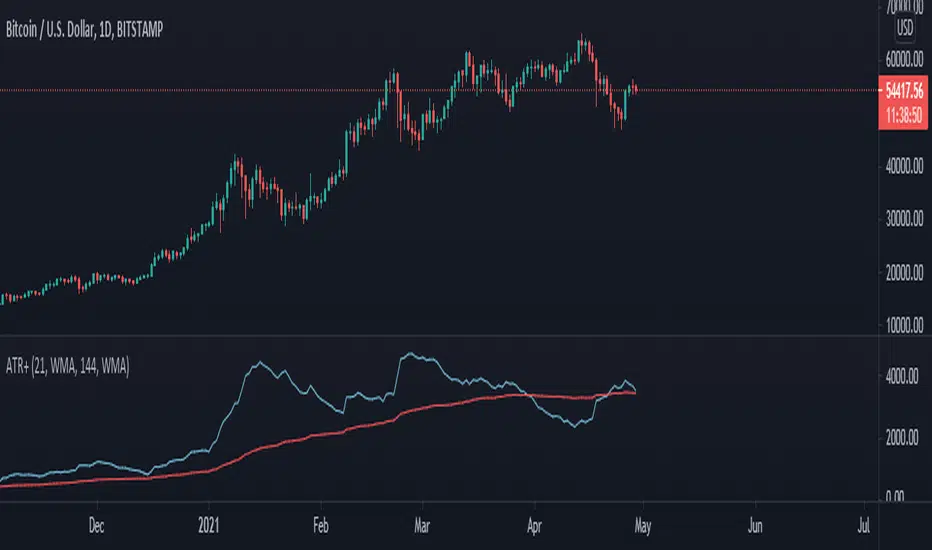
[kai]mATRThis indicator is for calculating the volatility of any interval
mTR (green line): TR is extended to calculate multiple bars at once with magnification setting.
mATR (red line): ATR is extended to calculate multiple bars at once with magnification setting.
dev (blue line): standard deviation
If you turn on "divide source" in the settings, it will be the price volatility.
dev will be the same as BBW
このインジケーターは任意の区間のボラリティを計算するための物です
mTR(緑線) : TRを倍率設定で複数のバーをまとめて計算する用に拡張したものです
mATR(赤線) : ATRを倍率設定で複数のバーをまとめて計算する用に拡張したものです
dev(青線) : 標準偏差
設定で「divide source 価格変動率」をONにすると価格変動率になります
devはBBWと同じになります

NVME Support & ResistanceNVME Support & Resistance is unique compared to other S/R indicators out there because it provides users with automated analysis that can be done within a second and ours generate a highlight block rather than a solid line or dotted line and a highlight block is useful as it covers a bigger range compared to having dots and flat lines. Also, the zones will update corresponding to its lookback period, so if a new support or resistance is found then the block will move until that area is confirmed.
Best with higher timeframes!
This comes with all NVME scripts!

(JS) Interchanging ATR & VWAP BandsOkay so this is pretty simple, but I think it's a great tool for day trading especially. I just took the default VWAP and Keltner channel scripts and combined them together.
The top option allows you to choose which one you'd prefer to use, "Use ATR instead of VWAP" .
The next options, "ATR Source", "KC Length", and "ATR Length" are the parameters for the ATR Bands.
"Number of Bands" allows you to choose how many bands you'd like to be on display (you can choose 1-8).
"Use Expoential MA" and "Band Style" are more default parameters from Keltner Channels used to set up the ATR Bands.
The "ATR Bands" are just stacked Keltner Channels separated by 1 ATR each, whereas the "VWAP Bands" are separated by standard deviation just like the default script from Trading View.
In these example chart, you can see the weekly VWAP with 8 deviation bands and 5 ATR bands with Keltner Channels.

Double Average True Range - Taylor V1Double ATR Line, Assist on Trend, Volume and Unnormal Price Movement.
- Fast Line ATR
- Slow Line ATR
1) Able to Change The ATR = Period
2) Able to Change The ATR = Moving Average Type
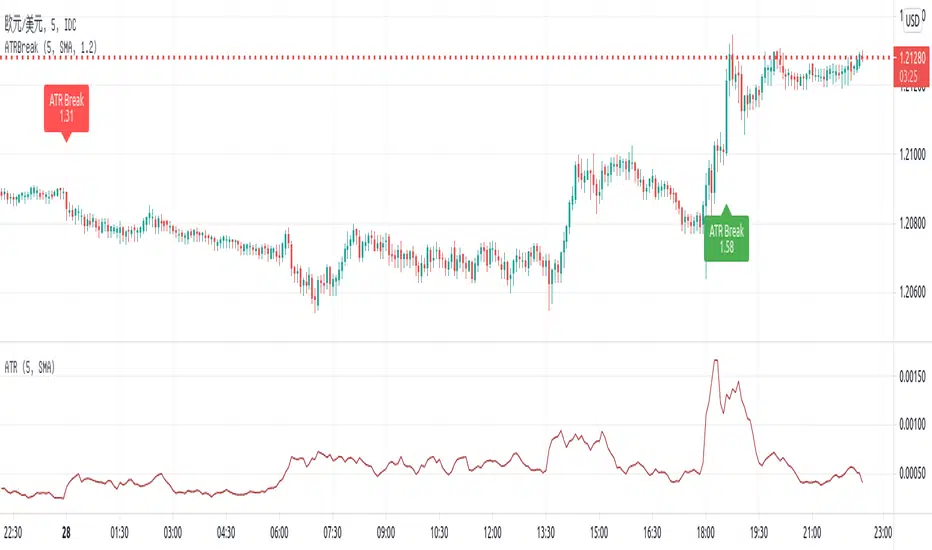
ATR Break on chartThis script is putting one of my old trading method, ATR Break, on chart.
It used to win many times in Dukascopy strategy contest a few years ago.
Pine script is quite easy to learn and very powerful. So I coded it to have a quick view for ATR break on chart.
The rule is simple:
- Current close - open / Previous ATR(5) > alertlevel (1.2), long signal
- Current open - close / Previous ATR(5) > alertlevel (1.2), short signal
The script will display label on the chart with the value of abs(close - open) / Previous ATR(5) to feel the strength.
I used to use the method on 5-min even 1-min chart. SL for 200 points and TP for 5-10 points
Average Trading Range Percentage
Average high/low trading range for the current timeframe.
Daily high/low trading range.

Overall % of ATRThis ATR script is supposed to filter paranormal candles (too small or big) and calculate ATR and percent of average ATR using only average daily candles.

Rosebud Trend [DepthHouse]Rosebud Trend Indicator uses complex range calculations to easily detect trend changes, critical support and resistance levels, and even aid in spotting reversals. The Critical Support & Resistance Zones are plotted via the red and green cloud. This cloud not only visually displays the expected trend direction but often acts as major support and resistance zones. The outer band measures the expected range in which the assets trades within over longer periods of time.
Users can switch the ‘Trend Sensitivity’ between ‘Low’ and ‘High’ to increase or decrease the rate at which the cloud changes.
By altering the S/R Band Thickness users can furthermore increase or decrease the rate at which a trend changes by altering the thickness of the cloud. I prefer to keep these settings at 0.55 , 0.382, or 0.236.
The bar colors are generated by a combination of Rosebuds primary function and our ATR AUTO Oscillator base functions. Users have 3 bar color options to select from: Simple, Complex, and Off .
Simple: Bars colors alternate between shades of red and green based on the trend direction and the ATR Auto strength. Stronger the shade, the stronger the trend.
Complex: This adds a few extra variables to the script which generates a more complex bar color display. Using this option, Rosebud will generate light red bars in a bull trend if downward movement is strong and vice versa in a bear trend. It also will generate a purple bar if the candle successfully closes above or below the Top & Bottom Range Bands; We call this a range break , and it could be an early sign of strong upward or downward movement.
Off: In case you like to keep things even simpler, this option hides all overlay bar colors.
Sample of Complex Bar Colors:
Bull, Bear signals along with Up and Down arrows are too based on a combination of our trend direction and ATR Auto Oscillator calculations.
Users have the option to adjust both bar color, and shape generation settings via:
Smoothed Signal Option: Turns advance smoothing on or off. On will reduce signal noise, while Off could land you that perfect bottom signal with a lower success rate.
Candlestick Length: Default factor for bar color and shape generation, higher the number the fewer signals that will generate.
Candlestick Smoothing: Default smoothing for the Candlestick Length
Signal Lookback: Adjust the factor at which Bull, Bear, Up, and Down. Lower this to 2 for more signals.
Cross Thresholds: The lower this number the easier it is for ‘Bull’, ‘Bear’, and over extended signals to generate; see image below:
*Users also have the option to hide all signal visuals via the 'Shapes' On/Off option.
Users have multiple built in Alerts to choose from:
Bullish Trend Change: When the critical cloud switches to Bullish
Bearish Trend Change: When the critical cloud switches to Bearish
Upper Range Break: When the price action closes above the Range Top
Lower Range Break: When the price action closes below the Range Bottom
Light Bullish Cross: Early bullish signal; also displayed by up arrows by default
Light Bearish Cross: Early bear signal: also displayed by down arrows by default
Verified Bullish Cross: Occurs when a Bull signal is generated.
Verified Bearish Cross: Occurs when a Bear signal is generated.
*Past performance is no guarantee of future results*

Baus BandsThe Baus Bands are a simplified version of another one of my trend following indicators, the Neapolitan Bands. This version only shows the trend trading zones in green and red. An additional 21 EMA with an ATR band was added as part of my own trend trading rules using these bands.
How do I read this indicator?
Is the blue band between and not touching the green or red clouds? The condition is ranging.
Is the blue band touching the green cloud? The condition is a bullish trend.
Is the blue band touching the red cloud? The condition is a bearish trend.
The trend trading rules are exactly the same as the default Neapolitans, but include an extra condition.
A trend has started once 2 conditions are met:
Price has entered either trending cloud.
The 21 EMA ATR band in blue is within the same cloud.
With those conditions met, if you expect the trend to continue, trade pull-backs to the blue band in the direction of the trending cloud.
Isn't this just a 21 EMA trading pull-backs strategy?
No. The 21 EMA alone is not sufficient in my opinion to define a range or trend technically. Always buying the 21 EMA pull-back, especially in a range, is not a great strategy by itself unless you've already identified price as trending. Baus Bands adds that trend identification.
Why make this?
Baus Bands show the conditions I personally use for catching trends and identifying ranges with these indicators, and shows only the information I use.
What's the purpose of the ATR band around the 21 EMA?
Sometimes price will open and close below the 21 EMA and cause some technical analysts will say the trend is over. I added the ATR specifically to get a volatility based, upper and lower bound range around the 21 EMA. that way I have an acceptable price range where price could move past the 21 EMA and still keep a trend valid using similar rules. I then saw that so long this ATR band (not the 21 EMA itself) was touching those trending clouds, then the trend has a good chance of continuing as long as that was true.

Roc & Atr
Roc & Atr Orders
My indicator, where I compare the 20 bar change percentage with the 14 bar atr band, I hope it will be useful to everyone. the green zones can be interpreted as BUY and the red zone as SELL zone. In graphs with high motion and low atr, the channel narrowing can be interpreted as BUY and the channel opening as SELL.
No indicator shows you the right way ... The best way is your own thoughts

ATR Daily Levels Band NakitxuAverage True Range
What Is the Average True Range (ATR)?
The average true range (ATR) is a technical analysis indicator, that measures market volatility by decomposing the entire range of an asset price for that period.
The true range indicator is taken as the greatest of the following: current high less the current low; the absolute value of the current high less the previous close; and the absolute value of the current low less the previous close.
The ATR is then a moving average, generally using 14 days, of the true ranges.
This script is an especial request of a TradingView user.
Shows 5 levels based on ATR daily, plotted in wherever timeframe you are using:
level 1: prv day ATR + prv day close
level 2: prv day ATR + prv day high
level 3: level 2 - prv day ATR
level 4: prv day close - prv day ATR
level 5: prv day low - prv day
Only show the levels if you are in a timeframe daily or lower than daily.
