Dynamic ATR BandsDescription:
The Dynamic ATR Bands indicator visualizes ATR-based stop-loss, take-profit, and trailing levels. Bands can be drawn relative to a fixed entry price or dynamically relative to the current price. It is ideal for trend-following, swing trading, and hybrid strategies, especially on volatile or noisy instruments.
Key Features:
Base ATR Bands:
Plots ATR-based bands above and below a reference price.
Acts as initial stop-loss or target guidance.
Adjustable multiplier (default 1× ATR).
Extra ATR Band:
Add an additional ATR band at a custom multiplier.
Position it above or below the reference price.
Useful for trailing stops or extended profit targets.
Hybrid Entry Mode:
Use Fixed Entry Price: bands are drawn relative to your entry and remain fixed.
Dynamic Mode: bands behave like standard ATR bands, moving with the current price.
Allows visualization of hybrid ATR stop-loss and trailing strategies.
Clean Visuals:
Color-coded bands differentiate base (solid) from extra (semi-transparent).
How to Use:
Set ATR length and multipliers according to your strategy.
Toggle hybrid entry mode and input your entry price, or leave off for dynamic bands.
Set the extra band multiplier and choose its position (upper/lower).
Use the bands as visual guides for stop-loss, take-profit, and trailing levels.
Inputs:
ATR Length: number of periods for ATR calculation
Base ATR Multiplier: distance of base bands from reference price
Extra ATR Multiplier: distance for the additional band
Extra Band Position: choose Upper or Lower
Use Fixed Entry Price: toggle hybrid entry mode
Entry Price: specify entry price if hybrid mode is enabled
Note:
This script is visual only; it does not place trades. It is designed to help plan ATR-based stop-loss, take-profit, and hybrid trade management visually on the chart.
真實波幅均值(ATR)

Volatilidad Multi-TF📊 Multi-Timeframe Volatility (ATR%)
Description
Indicator that displays the current asset's volatility across multiple timeframes simultaneously. It uses the ATR (Average True Range) normalized as a percentage of price, allowing for objective volatility comparison across different timeframes.
✨ Key Features
- Multi-Timeframe Analysis: Visualize volatility across 5 different timeframes (1H, 4H, D, W, M)
- Normalized Volatility: ATR expressed as a percentage of price for accurate comparison
- Compact Table: Clean and easy-to-read interface in the corner of your chart
- Auto-Update: Automatically adapts to the asset you're viewing
- No Additional Plots: Only displays essential information in table format
🎯 How to Use
1. Add the indicator to your chart
2. The table will automatically display the current asset's volatility
3. Percentage values allow you to quickly identify:
- Which timeframe has higher/lower volatility
- Divergences between timeframes
- High or low volatility zones to adjust your strategies
⚙️ Configurable Parameters
- ATR Period: Default 14, adjust according to your strategy
📈 Practical Applications
- Risk Management: Adjust position sizing based on current volatility
- Asset Selection: Identify assets with suitable volatility for your profile
- Entry Timing: Detect volatility expansions/contractions
- Timeframe Analysis: Compare volatility across different time periods
💡 Technical Notes
- Normalized ATR allows volatility comparison between assets with different prices
- Useful for both intraday trading (1H, 4H) and swing/positional trading (D, W, M)
- Compatible with any market: cryptocurrencies, forex, stocks, indices
⚠️ Disclaimer
This indicator is a technical analysis tool. It does not constitute financial advice. Conduct your own analysis and risk management before trading.

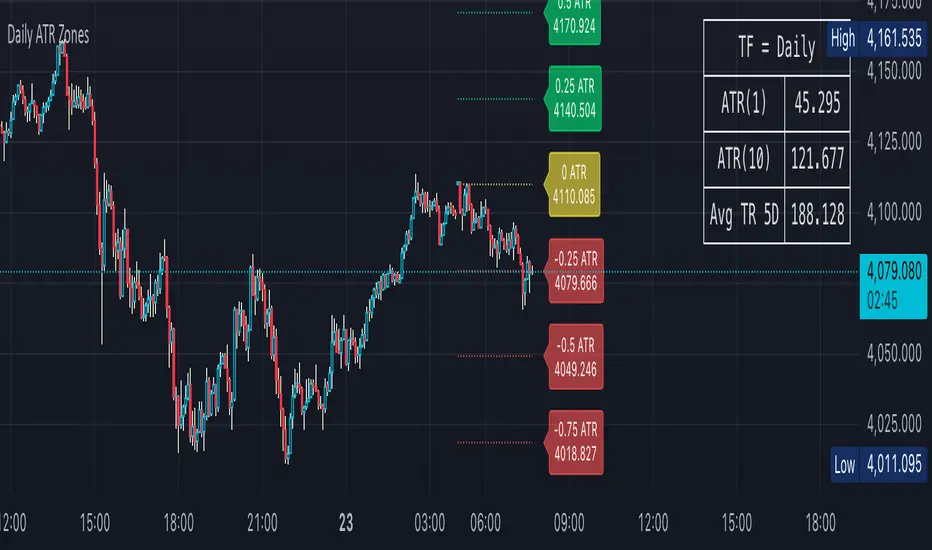
Daily ATR Zones
Dynamic Daily ATR Projection Zones
### **Description:**
This indicator projects potential price levels for the current trading day based on the Average True Range (ATR) of the previous day. It is designed to help intraday traders visualize daily volatility and identify key potential support, resistance, or target levels that are fixed for the entire session and do not repaint.
**How It Works**
The logic is based on two key components: a stable base price and a reliable volatility measure.
* **Base Price:** The indicator uses the **Open price of the current day** as the central anchor point for all projections.
* **Volatility Measure:** The calculation uses the final, completed **ATR value from the previous day**. This ensures that the projected zones are constant throughout the current trading day and are not subject to repainting.
The projection levels are then calculated using the formula:
`Current Day's Open + (Previous Day's ATR * Multiplier)`
**Features**
This script is fully customizable to fit your trading style:
* **Customizable ATR Multipliers:** Easily define your own price zones by entering a comma-separated list of multipliers (e.g., `0.5, 1.0, 1.5, -0.5, -1.0`).
* **Dynamic & Movable Labels:** The price labels are designed to stay on the right edge of the chart, ensuring they never obscure the current price action.
* **Adjustable Label Position:** Use the "Label Horizontal Offset" setting to control how far the labels are positioned from the current bar, keeping your chart clean.
* **Adjustable Label Size:** Choose from five different sizes (Tiny, Small, Normal, Large, Huge) to ensure the labels are perfectly readable on any device.
* **Toggle Labels:** You can turn all labels on or off with a single checkbox.
* **Full Color Customization:** Set unique colors for the positive (upper), negative (lower), and neutral projection zones.
**How to Use**
This tool can be integrated into various intraday trading strategies:
* **Intraday Targets:** The projected levels can serve as potential take-profit or stop-loss targets for scalpers and day traders.
* **Support & Resistance:** Watch for price reactions, such as bounces or rejections, at these ATR levels, as they often act as dynamic support and resistance zones.
* **Volatility Gauge:** The zones provide a quick visual reference for how far the price has moved relative to its recent average daily range. For example, if the price reaches the `1.0 ATR` level, it has completed an "average" day's move.
T3 ATR [DCAUT]█ T3 ATR
📊 ORIGINALITY & INNOVATION
The T3 ATR indicator represents an important enhancement to the traditional Average True Range (ATR) indicator by incorporating the T3 (Tilson Triple Exponential Moving Average) smoothing algorithm. While standard ATR uses fixed RMA (Running Moving Average) smoothing, T3 ATR introduces a configurable volume factor parameter that allows traders to adjust the smoothing characteristics from highly responsive to heavily smoothed output.
This innovation addresses a fundamental limitation of traditional ATR: the inability to adapt smoothing behavior without changing the calculation period. With T3 ATR, traders can maintain a consistent ATR period while adjusting the responsiveness through the volume factor, making the indicator adaptable to different trading styles, market conditions, and timeframes through a single unified implementation.
The T3 algorithm's triple exponential smoothing with volume factor control provides improved signal quality by reducing noise while maintaining better responsiveness compared to traditional smoothing methods. This makes T3 ATR particularly valuable for traders who need to adapt their volatility measurement approach to varying market conditions without switching between multiple indicator configurations.
📐 MATHEMATICAL FOUNDATION
The T3 ATR calculation process involves two distinct stages:
Stage 1: True Range Calculation
The True Range (TR) is calculated using the standard formula:
TR = max(high - low, |high - close |, |low - close |)
This captures the greatest of the current bar's range, the gap from the previous close to the current high, or the gap from the previous close to the current low, providing a comprehensive measure of price movement that accounts for gaps and limit moves.
Stage 2: T3 Smoothing Application
The True Range values are then smoothed using the T3 algorithm, which applies six exponential moving averages in succession:
First Layer: e1 = EMA(TR, period), e2 = EMA(e1, period)
Second Layer: e3 = EMA(e2, period), e4 = EMA(e3, period)
Third Layer: e5 = EMA(e4, period), e6 = EMA(e5, period)
Final Calculation: T3 = c1×e6 + c2×e5 + c3×e4 + c4×e3
The coefficients (c1, c2, c3, c4) are derived from the volume factor (VF) parameter:
a = VF / 2
c1 = -a³
c2 = 3a² + 3a³
c3 = -6a² - 3a - 3a³
c4 = 1 + 3a + a³ + 3a²
The volume factor parameter (0.0 to 1.0) controls the weighting of these coefficients, directly affecting the balance between responsiveness and smoothness:
Lower VF values (approaching 0.0): Coefficients favor recent data, resulting in faster response to volatility changes with minimal lag but potentially more noise
Higher VF values (approaching 1.0): Coefficients distribute weight more evenly across the smoothing layers, producing smoother output with reduced noise but slightly increased lag
📊 COMPREHENSIVE SIGNAL ANALYSIS
Volatility Level Interpretation:
High Absolute Values: Indicate strong price movements and elevated market activity, suggesting larger position risks and wider stop-loss requirements, often associated with trending markets or significant news events
Low Absolute Values: Indicate subdued price movements and quiet market conditions, suggesting smaller position risks and tighter stop-loss opportunities, often associated with consolidation phases or low-volume periods
Rapid Increases: Sharp spikes in T3 ATR often signal the beginning of significant price moves or market regime changes, providing early warning of increased trading risk
Sustained High Levels: Extended periods of elevated T3 ATR indicate sustained trending conditions with persistent volatility, suitable for trend-following strategies
Sustained Low Levels: Extended periods of low T3 ATR indicate range-bound conditions with suppressed volatility, suitable for mean-reversion strategies
Volume Factor Impact on Signals:
Low VF Settings (0.0-0.3): Produce responsive signals that quickly capture volatility changes, suitable for short-term trading but may generate more frequent color changes during minor fluctuations
Medium VF Settings (0.4-0.7): Provide balanced signal quality with moderate responsiveness, filtering out minor noise while capturing significant volatility changes, suitable for swing trading
High VF Settings (0.8-1.0): Generate smooth, stable signals that filter out most noise and focus on major volatility trends, suitable for position trading and long-term analysis
🎯 STRATEGIC APPLICATIONS
Position Sizing Strategy:
Determine your risk per trade (e.g., 1% of account capital - adjust based on your risk tolerance and experience)
Decide your stop-loss distance multiplier (e.g., 2.0x T3 ATR - this varies by market and strategy, test different values)
Calculate stop-loss distance: Stop Distance = Multiplier × Current T3 ATR
Calculate position size: Position Size = (Account × Risk %) / Stop Distance
Example: $10,000 account, 1% risk, T3 ATR = 50 points, 2x multiplier → Position Size = ($10,000 × 0.01) / (2 × 50) = $100 / 100 points = 1 unit per point
Important: The ATR multiplier (1.5x - 3.0x) should be determined through backtesting for your specific instrument and strategy - using inappropriate multipliers may result in stops that are too tight (frequent stop-outs) or too wide (excessive losses)
Adjust the volume factor to match your trading style: lower VF for responsive stop distances in short-term trading, higher VF for stable stop distances in position trading
Dynamic Stop-Loss Placement:
Determine your risk tolerance multiplier (typically 1.5x to 3.0x T3 ATR)
For long positions: Set stop-loss at entry price minus (multiplier × current T3 ATR value)
For short positions: Set stop-loss at entry price plus (multiplier × current T3 ATR value)
Trail stop-losses by recalculating based on current T3 ATR as the trade progresses
Adjust the volume factor based on desired stop-loss stability: higher VF for less frequent adjustments, lower VF for more adaptive stops
Market Regime Identification:
Calculate a reference volatility level using a longer-period moving average of T3 ATR (e.g., 50-period SMA)
High Volatility Regime: Current T3 ATR significantly above reference (e.g., 120%+) - favor trend-following strategies, breakout trades, and wider targets
Normal Volatility Regime: Current T3 ATR near reference (e.g., 80-120%) - employ standard trading strategies appropriate for prevailing market structure
Low Volatility Regime: Current T3 ATR significantly below reference (e.g., <80%) - favor mean-reversion strategies, range trading, and prepare for potential volatility expansion
Monitor T3 ATR trend direction and compare current values to recent history to identify regime transitions early
Risk Management Implementation:
Establish your maximum portfolio heat (total risk across all positions, typically 2-6% of capital)
For each position: Calculate position size using the formula Position Size = (Account × Individual Risk %) / (ATR Multiplier × Current T3 ATR)
When T3 ATR increases: Position sizes automatically decrease (same risk %, larger stop distance = smaller position)
When T3 ATR decreases: Position sizes automatically increase (same risk %, smaller stop distance = larger position)
This approach maintains constant dollar risk per trade regardless of market volatility changes
Use consistent volume factor settings across all positions to ensure uniform risk measurement
📋 DETAILED PARAMETER CONFIGURATION
ATR Length Parameter:
Default Setting: 14 periods
This is the standard ATR calculation period established by Welles Wilder, providing balanced volatility measurement that captures both short-term fluctuations and medium-term trends across most markets and timeframes
Selection Principles:
Shorter periods increase sensitivity to recent volatility changes and respond faster to market shifts, but may produce less stable readings
Longer periods emphasize sustained volatility trends and filter out short-term noise, but respond more slowly to genuine regime changes
The optimal period depends on your holding time, trading frequency, and the typical volatility cycle of your instrument
Consider the timeframe you trade: Intraday traders typically use shorter periods, swing traders use intermediate periods, position traders use longer periods
Practical Approach:
Start with the default 14 periods and observe how well it captures volatility patterns relevant to your trading decisions
If ATR seems too reactive to minor price movements: Increase the period until volatility readings better reflect meaningful market changes
If ATR lags behind obvious volatility shifts that affect your trades: Decrease the period for faster response
Match the period roughly to your typical holding time - if you hold positions for N bars, consider ATR periods in a similar range
Test different periods using historical data for your specific instrument and strategy before committing to live trading
T3 Volume Factor Parameter:
Default Setting: 0.7
This setting provides a reasonable balance between responsiveness and smoothness for most market conditions and trading styles
Understanding the Volume Factor:
Lower values (closer to 0.0) reduce smoothing, allowing T3 ATR to respond more quickly to volatility changes but with less noise filtering
Higher values (closer to 1.0) increase smoothing, producing more stable readings that focus on sustained volatility trends but respond more slowly
The trade-off is between immediacy and stability - there is no universally optimal setting
Selection Principles:
Match to your decision speed: If you need to react quickly to volatility changes for entries/exits, use lower VF; if you're making longer-term risk assessments, use higher VF
Match to market character: Noisier, choppier markets may benefit from higher VF for clearer signals; cleaner trending markets may work well with lower VF for faster response
Match to your preference: Some traders prefer responsive indicators even with occasional false signals, others prefer stable indicators even with some delay
Practical Adjustment Guidelines:
Start with default 0.7 and observe how T3 ATR behavior aligns with your trading needs over multiple sessions
If readings seem too unstable or noisy for your decisions: Try increasing VF toward 0.9-1.0 for heavier smoothing
If the indicator lags too much behind volatility changes you care about: Try decreasing VF toward 0.3-0.5 for faster response
Make meaningful adjustments (0.2-0.3 changes) rather than small increments - subtle differences are often imperceptible in practice
Test adjustments in simulation or paper trading before applying to live positions
📈 PERFORMANCE ANALYSIS & COMPETITIVE ADVANTAGES
Responsiveness Characteristics:
The T3 smoothing algorithm provides improved responsiveness compared to traditional RMA smoothing used in standard ATR. The triple exponential design with volume factor control allows the indicator to respond more quickly to genuine volatility changes while maintaining the ability to filter noise through appropriate VF settings. This results in earlier detection of volatility regime changes compared to standard ATR, particularly valuable for risk management and position sizing adjustments.
Signal Stability:
Unlike simple smoothing methods that may produce erratic signals during transitional periods, T3 ATR's multi-layer exponential smoothing provides more stable signal progression. The volume factor parameter allows traders to tune signal stability to their preference, with higher VF settings producing remarkably smooth volatility profiles that help avoid overreaction to temporary market fluctuations.
Comparison with Standard ATR:
Adaptability: T3 ATR allows adjustment of smoothing characteristics through the volume factor without changing the ATR period, whereas standard ATR requires changing the period length to alter responsiveness, potentially affecting the fundamental volatility measurement
Lag Reduction: At lower volume factor settings, T3 ATR responds more quickly to volatility changes than standard ATR with equivalent periods, providing earlier signals for risk management adjustments
Noise Filtering: At higher volume factor settings, T3 ATR provides superior noise filtering compared to standard ATR, producing cleaner signals for long-term analysis without sacrificing volatility measurement accuracy
Flexibility: A single T3 ATR configuration can serve multiple trading styles by adjusting only the volume factor, while standard ATR typically requires multiple instances with different periods for different trading applications
Suitable Use Cases:
T3 ATR is well-suited for the following scenarios:
Dynamic Risk Management: When position sizing and stop-loss placement need to adapt quickly to changing volatility conditions
Multi-Style Trading: When a single volatility indicator must serve different trading approaches (day trading, swing trading, position trading)
Volatile Markets: When standard ATR produces too many false volatility signals during choppy conditions
Systematic Trading: When algorithmic systems require a single, configurable volatility input that can be optimized for different instruments
Market Regime Analysis: When clear identification of volatility expansion and contraction phases is critical for strategy selection
Known Limitations:
Like all technical indicators, T3 ATR has limitations that users should understand:
Historical Nature: T3 ATR is calculated from historical price data and cannot predict future volatility with certainty
Smoothing Trade-offs: The volume factor setting involves a trade-off between responsiveness and smoothness - no single setting is optimal for all market conditions
Extreme Events: During unprecedented market events or gaps, T3 ATR may not immediately reflect the full scope of volatility until sufficient data is processed
Relative Measurement: T3 ATR values are most meaningful in relative context (compared to recent history) rather than as absolute thresholds
Market Context Required: T3 ATR measures volatility magnitude but does not indicate price direction or trend quality - it should be used in conjunction with directional analysis
Performance Expectations:
T3 ATR is designed to help traders measure and adapt to changing market volatility conditions. When properly configured and applied:
It can help reduce position risk during volatile periods through appropriate position sizing
It can help identify optimal times for more aggressive position sizing during stable periods
It can improve stop-loss placement by adapting to current market conditions
It can assist in strategy selection by identifying volatility regimes
However, volatility measurement alone does not guarantee profitable trading. T3 ATR should be integrated into a comprehensive trading approach that includes directional analysis, proper risk management, and sound trading psychology.
USAGE NOTES
This indicator is designed for technical analysis and educational purposes. T3 ATR provides adaptive volatility measurement but has limitations and should not be used as the sole basis for trading decisions. The indicator measures historical volatility patterns, and past volatility characteristics do not guarantee future volatility behavior. Market conditions can change rapidly, and extreme events may produce volatility readings that fall outside historical norms.
Traders should combine T3 ATR with directional analysis tools, support/resistance analysis, and other technical indicators to form a complete trading strategy. Proper backtesting and forward testing with appropriate risk management is essential before applying T3 ATR-based strategies to live trading. The volume factor parameter should be optimized for specific instruments and trading styles through careful testing rather than assuming default settings are optimal for all applications.

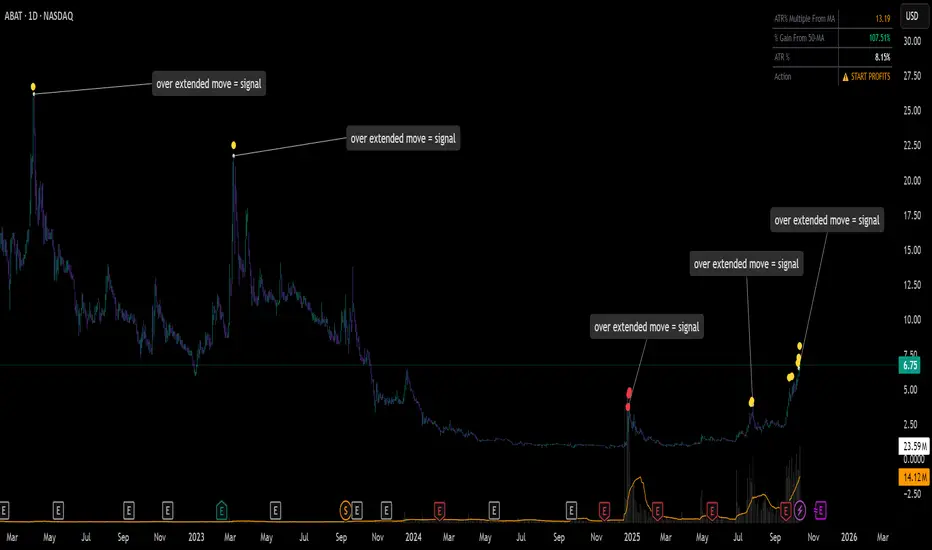
ATR% Multiple From MA - Overextensions trackingATR% Multiple From MA - Quantifiable Profit Taking Indicator
This overlay indicator identifies overextended price moves by calculating how many ATR% multiples price is away from a moving average, providing objective profit-taking signals.
Formula:
A = ATR% = (ATR / Price) × 100
B = % Gain from MA = ((Price - MA) / MA) × 100
ATR% Multiple = B / A
Signals:
Yellow circle at 7x: Start scaling out partial profits
Red circle at 10x+: Heavily overextended, aggressive profit taking recommended
Stats table: Real-time ATR% Multiple, % Gain from MA, ATR%, and action status
For very volatile markets I usually go for 10x and 15x extension instead of 7x and 10x.
This method normalizes moves across different volatility environments, eliminating emotional decision-making. Historical examples include PLTR, SOFI, TSLA, NVDA which stalled after exceeding 10x.
Customizable Settings:
ATR Length (default: 14)
MA Length (default: 50)
Profit Zone thresholds (7x, 10x)
Toggle circles and MA display
Squeeze Hour Frequency [CHE]Squeeze Hour Frequency (ATR-PR) — Standalone — Tracks daily squeeze occurrences by hour to reveal time-based volatility patterns
Summary
This indicator identifies periods of unusually low volatility, defined as squeezes, and tallies their frequency across each hour of the day over historical trading sessions. By aggregating counts into a sortable table, it helps users spot hours prone to these conditions, enabling better scheduling of trading activity to avoid or target specific intraday regimes. Signals gain robustness through percentile-based detection that adapts to recent volatility history, differing from fixed-threshold methods by focusing on relative lowness rather than absolute levels, which reduces false positives in varying market environments.
Motivation: Why this design?
Traders often face uneven intraday volatility, with certain hours showing clustered low-activity phases that precede or follow breakouts, leading to mistimed entries or overlooked calm periods. The core idea of hourly squeeze frequency addresses this by binning low-volatility events into 24 hourly slots and counting distinct daily occurrences, providing a historical profile of when squeezes cluster. This reveals time-of-day biases without relying on real-time alerts, allowing proactive adjustments to session focus.
What’s different vs. standard approaches?
- Reference baseline: Classical volatility tools like simple moving average crossovers or fixed ATR thresholds, which flag squeezes uniformly across the day.
- Architecture differences:
- Uses persistent arrays to track one squeeze per hour per day, preventing overcounting within sessions.
- Employs custom sorting on ratio arrays for dynamic table display, prioritizing top or bottom performers.
- Handles timezones explicitly to ensure consistent binning across global assets.
- Practical effect: Charts show a persistent table ranking hours by squeeze share, making intraday patterns immediately visible—such as a top hour capturing over 20 percent of total events—unlike static overlays that ignore temporal distribution, which matters for avoiding low-liquidity traps in crypto or forex.
How it works (technical)
The indicator first computes a rolling volatility measure over a specified lookback period. It then derives a relative ranking of the current value against recent history within a window of bars. A squeeze is flagged when this ranking falls below a user-defined cutoff, indicating the value is among the lowest in the recent sample.
On each bar, the local hour is extracted using the selected timezone. If a squeeze occurs and the bar has price data, the count for that hour increments only if no prior mark exists for the current day, using a persistent array to store the last marked day per hour. This ensures one tally per unique trading day per slot.
At the final bar, arrays compile counts and ratios for all 24 hours, where the ratio represents each hour's share of total squeezes observed. These are sorted ascending or descending based on display mode, and the top or bottom subset populates the table. Background shading highlights live squeezes in red for visual confirmation. Initialization uses zero-filled arrays for counts and negative seeds for day tracking, with state persisting across bars via variable declarations.
No higher timeframe data is pulled, so there is no repaint risk from external fetches; all logic runs on confirmed bars.
Parameter Guide
ATR Length — Controls the lookback for the volatility measure, influencing sensitivity to short-term fluctuations; shorter values increase responsiveness but add noise, longer ones smooth for stability — Default: 14 — Trade-offs/Tips: Use 10-20 for intraday charts to balance quick detection with fewer false squeezes; test on historical data to avoid over-smoothing in trending markets.
Percentile Window (bars) — Sets the history depth for ranking the current volatility value, affecting how "low" is defined relative to past; wider windows emphasize long-term norms — Default: 252 — Trade-offs/Tips: 100-300 bars suit daily cycles; narrower for fast assets like crypto to catch recent regimes, but risks instability in sparse data.
Squeeze threshold (PR < x) — Defines the cutoff for flagging low relative volatility, where values below this mark a squeeze; lower thresholds tighten detection for rarer events — Default: 10.0 — Trade-offs/Tips: 5-15 percent for conservative signals reducing false positives; raise to 20 for more frequent highlights in high-vol environments, monitoring for increased noise.
Timezone — Specifies the reference for hourly binning, ensuring alignment with market sessions — Default: Exchange — Trade-offs/Tips: Set to "America/New_York" for US assets; mismatches can skew counts, so verify against chart timezone.
Show Table — Toggles the results display, essential for reviewing frequencies — Default: true — Trade-offs/Tips: Disable on mobile for performance; pair with position tweaks for clean overlays.
Pos — Places the table on the chart pane — Default: Top Right — Trade-offs/Tips: Bottom Left avoids candle occlusion on volatile charts.
Font — Adjusts text readability in the table — Default: normal — Trade-offs/Tips: Tiny for dense views, large for emphasis on key hours.
Dark — Applies high-contrast colors for visibility — Default: true — Trade-offs/Tips: Toggle false in light themes to prevent washout.
Display — Filters table rows to focus on extremes or full list — Default: All — Trade-offs/Tips: Top 3 for quick scans of risky hours; Bottom 3 highlights safe low-squeeze periods.
Reading & Interpretation
Red background shading appears on bars meeting the squeeze condition, signaling current low relative volatility. The table lists hours as "H0" to "H23", with columns for daily squeeze counts, percentage share of total squeezes (summing to 100 percent across hours), and an arrow marker on the top hour. A summary row above details the peak count, its share, and the leading hour. A label at the last bar recaps total days observed, data-valid days, and top hour stats. Rising shares indicate clustering, suggesting regime persistence in that slot.
Practical Workflows & Combinations
- Trend following: Scan for hours with low squeeze shares to enter during stable regimes; confirm with higher highs or lower lows on the 15-minute chart, avoiding top-share hours post-news like tariff announcements.
- Exits/Stops: Tighten stops in high-share hours to guard against sudden vol spikes; use the table to shift to conservative sizing outside peak squeeze times.
- Multi-asset/Multi-TF: Defaults work across crypto pairs on 5-60 minute timeframes; for stocks, widen percentile window to 500 bars. Combine with volume oscillators—enter only if squeeze count is below average for the asset.
Behavior, Constraints & Performance
Logic executes on closed bars, with live bars updating counts provisionally but finalizing on confirmation; table refreshes only at the last bar, avoiding intrabar flicker. No security calls or higher timeframes, so no repaint from external data. Resources include a 5000-bar history limit, loops up to 24 iterations for sorting and totals, and arrays sized to 24 elements; labels and table are capped at 500 each for efficiency. Known limits: Skips hours without bars (e.g., weekends), assumes uniform data availability, and may undercount in sparse sessions; timezone shifts can alter profiles without warning.
Sensible Defaults & Quick Tuning
Start with ATR Length at 14, Percentile Window at 252, and threshold at 10.0 for broad crypto use. If too many squeezes flag (noisy table), raise threshold to 15.0 and narrow window to 100 for stricter relative lowness. For sluggish detection in calm markets, drop ATR Length to 10 and threshold to 5.0 to capture subtler dips. In high-vol assets, widen window to 500 and threshold to 20.0 for stability.
What this indicator is—and isn’t
This is a historical frequency tracker and visualization layer for intraday volatility patterns, best as a filter in multi-tool setups. It is not a standalone signal generator, predictive model, or risk manager—pair it with price action, news filters, and position sizing rules.
Disclaimer
The content provided, including all code and materials, is strictly for educational and informational purposes only. It is not intended as, and should not be interpreted as, financial advice, a recommendation to buy or sell any financial instrument, or an offer of any financial product or service. All strategies, tools, and examples discussed are provided for illustrative purposes to demonstrate coding techniques and the functionality of Pine Script within a trading context.
Any results from strategies or tools provided are hypothetical, and past performance is not indicative of future results. Trading and investing involve high risk, including the potential loss of principal, and may not be suitable for all individuals. Before making any trading decisions, please consult with a qualified financial professional to understand the risks involved.
By using this script, you acknowledge and agree that any trading decisions are made solely at your discretion and risk.
Do not use this indicator on Heikin-Ashi, Renko, Kagi, Point-and-Figure, or Range charts, as these chart types can produce unrealistic results for signal markers and alerts.
Best regards and happy trading
Chervolino
Thanks to Duyck
for the ma sorter

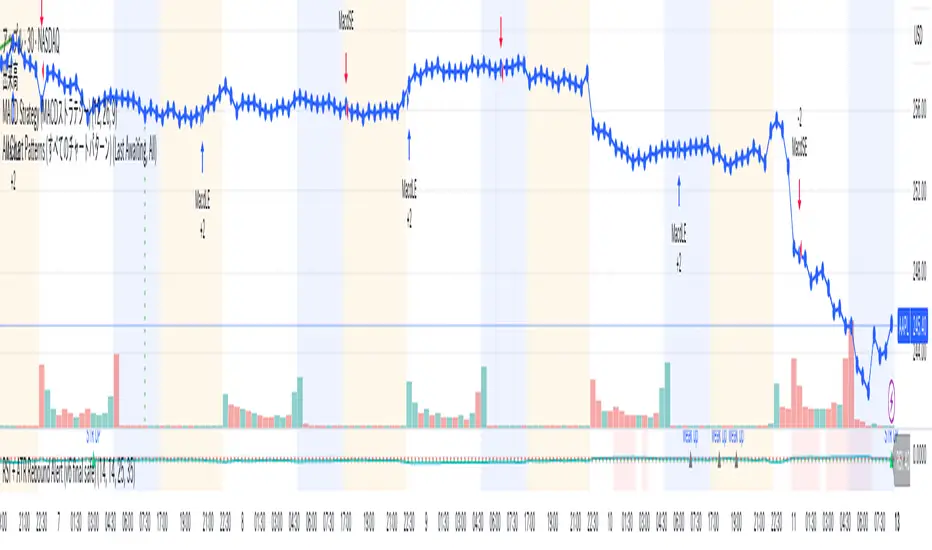
Arisa RSI Rebound Alert (v6.2)Short description:
Simple RSI-based rebound detection with ATR confirmation — designed for traders who prefer a clean and intuitive signal.
Full description:
This indicator detects oversold and rebound phases using RSI and confirms the strength of each rebound with ATR slope analysis.
It is optimized for deep correction phases (e.g. RSI 25→35 cross), helping traders catch early reversal signals while avoiding unnecessary noise.
💡 Recommended use:
• Timeframes: 30min–4h
• Ideal for short- to mid-term rebound trades
• Combine with Heikin-Ashi or volume expansion for higher accuracy
✨ Key Features:
• Clear oversold/rebound thresholds (default RSI <25 / cross-up >35)
• Background highlight for deep oversold conditions
• Visual markers for strong vs. weak rebounds (ATR slope filter)
• Alert-ready (three conditions included)
🪶 Concept:
This script is designed for traders who value simplicity and intuition — focusing on meaningful signals rather than automation overload.
It’s for those who still want to see and feel the market before taking action.
⸻
Author:
Arisa Sanjo (Japan)
Created with the support of GPT-5, based on live trading insights from October 2025.
License:
Free to use and modify with proper attribution.
If you redistribute or enhance this script, please mention “Based on Arisa RSI Rebound Alert (v6.2)” in your description.
CyberTradingV1.4 TRexCyberTradingV1.3 — Multi-TF Volatility/Structure + FVG Suite (by College Pips)
TL;DR
One utility to read volatility regime (ATR vs TH), map market structure & swings, and track FVG/CE imbalances—so you can gauge range, context and entries in one place. No signals or promises; it’s a contextual toolkit.
What it does
Volatility table (multi-TF): Shows ATR-style and TH proxies across 1m → Monthly, so you can compare current TF vs higher TFs.
Composite levels: LQC / GAM / Trigger / TRex quantify “how much is enough” for legs/impulses relative to the active TF.
Structure & swings: Validated swing highs/lows with optional time-anchored rectangles (height sized by LQC) and auto structure/diagonal lines.
Imbalances (FVG): Auto-detect UP/DOWN FVGs, extend forward, optional CE line; alerts fire on touches/entries/fills.
Candle sizing: Directional color map by fixed ATR-ratio buckets; Inside Bars are force-colored for clarity.
How components work together (mashup rationale)
Read regime with the table (ATR vs TH per TF).
Map structure with swings/lines to see HH/HL/LH/LL context.
Focus imbalances with FVG + optional CE; monitor with alerts.
Act with thresholds using LQC/GAM/Trigger/TRex to standardize expectations across symbols/TFs.
Method transparency
ATR/TH math: ATR is a smoothed multi-window blend; TH scales the daily range to TF via √time.
Composites: LQC ≈ √(ATR×TH) × C(TF); GAM2/3/4 and Trigger/TRex apply TF-specific scalars to min/max aggregates (see source for exact coefficients).
Multi-TF: Values come from request.security and finalize on higher-TF bar close (no look-ahead).
Swings: Confirmed using left/right strengths; labels are offset back to the pivot bar.
FVG/CE: Classic 3-bar definition; CE is the midpoint line. Boxes extend until touched/filled; optional auto-delete on fill.
Usage
Enable the table to gauge expansion/contraction.
Turn on swing rectangles for LQC-sized reaction zones.
Toggle FVG + CE on your execution TF; use alerts to catch re-entries/resolutions.
Combine with price action and your own trade plan.
Limitations & fair warnings (be honest)
Offsets/past plotting: Swing labels and rectangles are anchored to past bars (offset = -right_strength). They do not predict future bars.
Repainting notes: Swings confirm after right_strength bars; higher-TF values finalize on their close. Past markings can update as confirmations occur.
Tick handling: Uses syminfo.mintick (special cases for JPY/XAU/XAG). Validate on exotic symbols.
No promises: This is a context tool, not a buy/sell signal generator.
Alerts included
ABOVE/BELOW threshold: Price crossing CE or FVG bounds.
IOFED up/down: Price entering an FVG from above/below.
Inputs (high-level)
Layout/positioning, color palettes, swing rectangle styling (width/fill/border), detection strengths, label/line widths, FVG lookback, CE on/off & style, auto-delete filled boxes.
Credits & reuse
Concepts like FVG/CE are widely known in market-microstructure education.
This implementation—table architecture, LQC/GAM/Trigger framework, swing rectangles, candle bucketing, and alert logic—is original to College Pips / CyberTradingV1.4

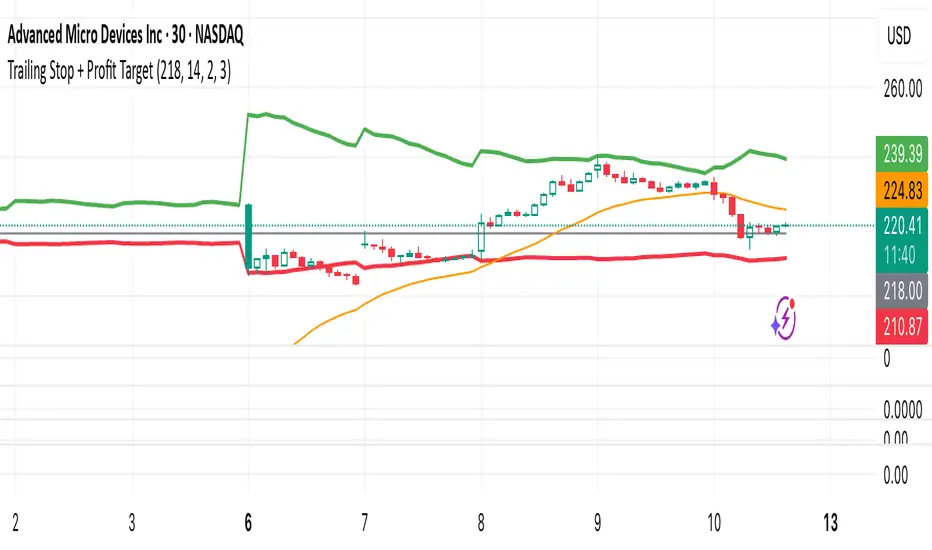
Trailing Stop + Profit TargetTrailing Stop + Exit Confirmation is a manual-entry tool designed to help traders visually manage trades with dynamic trailing stops and profit targets, based on ATR projections with a toggle button to reset calculations in real-time. Contains a “Short” toggle to work for short positions as well, which automatically inverses the PT and SL lines when toggled on.
Primary Calculations: Utilizes a manually adjustable entry price (default: $5 — ideal for options traders) that (when adjusted and recalculated) populates the chart with an adaptive ATR-based trailing stop line, dynamic profit target line, and optional 21-day EMA for directional context.
Below the Entry Price is a fully functional, manual reset toggle to reset all parameters mid-session to assess risk-reward based on entry price, risk tolerance, etc. followed by the “Short” toggle.
Primary Directions/Functions:
Enter your trade price in the “Manual Entry Price” field.
The script will begin plotting a dynamic trailing stop and profit target based on current market conditions.
Use the reset toggle to clear all calculations and start a new position at any time.
Customizable Settings:
ATR Length and Multiplier
Risk/Reward Profit Target Multiplier
Toggle to show/hide trailing stop, target, and EMA lines
Options Trading Use Case:
This tool is especially useful for options traders looking to manage premium-based entries (e.g., $5.00) on intraday or swing trades. The dynamic stop and target lines provide clear visual cues for scaling out or exiting based on price action, while allowing for tighter or looser risk depending on volatility (ATR).
This tool does not auto-detect entries or backtest positions. It is intended to complement your entry signals, not generate them. I've written an Options Momentum Signal indicator you can find right here which functions well in tandem with this tool.
Made for traders who execute trades manually and want typical preset guidelines for profit and stop loss signals but lets you recalculate them by simply clicking a button, especially if any major news or downturn causes a big change in market conditions so you can make adjustments in real time.
MTRADE ATR SL FINDERAverage True Range Stop Loss Finder (ATR)
This indicator automatically calculates dynamic stop-loss levels based on market volatility using the Average True Range (ATR) formula.
It provides both Long and Short stop levels derived from ATR values and adapts them in real time as volatility changes.
🔍 Features
Adjustable ATR Length (default: 20)
Four smoothing methods: RMA, SMA, EMA, WMA
Configurable Multiplier (default: 1.5× ATR)
Real-time High (Short Stop) and Low (Long Stop) lines on the chart
A clean on-chart table displaying:
ATR value
High stop level (H)
Low stop level (L)
— all shown with 7-decimal precision for accurate readings
⚙️ Use Cases
Volatility-based stop-loss and take-profit placement
Risk management and trailing-stop automation
Intraday and swing trading systems using ATR-driven exits
🧠 Technical Details
Built in Pine Script v5
Supports up to 7 decimal precision (precision=7)
Works as an overlay, displaying ATR bands directly on price action
Fully customizable colors and smoothing logic
by fiyatherseydir

1m Scalping ATR (with SL & Zones)A universal ATR indicator that anchors volatility to your stop-loss.
Read any market (FX, JPY pairs, Gold/Silver, indices, crypto) consistently—regardless of pip/point conventions and timeframe.
Why this indicator?
Classic ATR is absolute (pips/points) and feels different across markets/TFs. ATR Takeoff normalizes ATR to your stop-loss in pips and highlights clear zones for “quiet / ideal / too volatile,” so you instantly know if a 10-pip SL fits current conditions.
Key features
Auto pip detection (FX, JPY, XAU/XAG, indices, BTC/ETH).
Selectable ATR source: chart timeframe or fixed ATR TF (e.g., “15”, “30”, “60”).
Display modes:
Percent of SL – ATR relative to SL in %, great for M1 (typical 10–30%).
Multiple of SL – ATR as a multiple of SL (e.g., 0.6× / 1.0× / 1.2×).
Panel zones:
Green = “Ready for takeoff” (≤ Low), Yellow = reference (Mid), Red = too volatile (≥ High).
Status badge (top-right): Quiet / ATR ok / Wild, current ATR/SL value, ATR TF used.
Direction-agnostic: Works the same for longs and shorts.
Inputs (at a glance)
Length / Smoothing (RMA/SMA/EMA/WMA): ATR base settings.
Your Stop-Loss (Pips): Reference SL (e.g., 10).
ATR Timeframe (empty = chart): Use chart TF or a fixed TF.
Display Mode: “Percent of SL” or “Multiple of SL.”
Low/Mid/High (Percent Mode): Zone thresholds in % of SL.
Low/Mid/High (Multiple Mode): Zone thresholds in ×SL.
Recommended defaults
Length 14, Smoothing RMA, SL 10 pips
Display Mode: Percent of SL
Low/Mid/High (%): 15 / 20 / 25
ATR Timeframe: empty (= chart) for reactive, or “30” for smoother M30 context with M1 entries.
How to use
Set SL (pips). 2) Choose display mode. 3) Optionally pick ATR TF.
Interpretation:
≤ Low (green): setups allowed.
≈ Mid (yellow): neutral reference.
≥ High (red): too volatile → adjust SL/size or wait.
Note: Auto-pip relies on common ticker naming; verify on exotic symbols.
Disclaimer: For research/education. Not financial advice.

Session-Conditioned Regime ATRWhy this exists
Classic ATR is great—until the open. The first few bars often inherit overnight gaps and 24-hour noise that have nothing to do with the intraday regime you actually trade. That inflates early ATR, scrambles thresholds, and invites hyper-recency bias (“today is crazy!”) when it’s just the open being the open.
This tool was built to:
Separate session reality from 24h noise. Measure volatility only inside your defined session (e.g., NYSE 09:30–16:00 ET).
Judge candles against the current regime, not the last 2–3 bars. A rolling statistic from the last N completed sessions defines what “typical” means right now.
Label “large” and “small” objectively. Bars are colored only when True Range meaningfully departs from the session regime—no gut feel, no open-bar distortion (gap inclusion optional).
Overview
Purpose: objectively identify unusually big or small candles within the active trading session, compared to the recent session regime.
Use cases: volatility filters, entry/exit confirmation, session bias detection, adaptive sizing.
This indicator replaces generic ATR with a session-conditioned, regime-aware measure. It colors candles only when their True Range (TR) is abnormally large/small versus the last N completed sessions of the same session window.
How it works
Session gating: Only bars inside the selected session are evaluated (presets for NYSE, CME RTH, FX NY; custom supported).
Per-bar TR: TR = max(high, prevRef) − min(low, prevRef).
prevRef is the prior close for in-session bars.
First bar of the session can include the overnight gap (optional; default off).
Regime statistic: For any bar in session k, aggregate all in-session TRs from the previous N completed sessions (k−N … k−1), then compute Median (default) or Mean.
Today’s anchor: Running statistic from today’s session start → current bar (for context and the on-chart ratio).
Color logic:
Big if TR ≥ bigMult × RegimeStat
Small if TR ≤ smallMult × RegimeStat
Colored states: big bull, big bear, small bull, small bear.
Non-triggering bars retain the chart’s native colors.
Panel (top-right by default)
Regime ATR (Nd): session-conditioned statistic over the past N completed sessions.
Today ATR (anchored): running statistic for the current session.
Ratio (Today/Regime): intraday volatility vs regime.
Sample size n: number of bars used in the regime calculation.
Inputs
Session Preset: NYSE (09:30–16:00 ET), CME RTH (08:30–15:00 CT), FX NY (08:00–17:00 ET), Custom (session + IANA timezone).
Regime Window: number of completed sessions (default 5).
Statistic: Median (robust) or Mean.
Include Open Gap: include overnight gap in the first in-session bar’s TR (default off).
Big/Small thresholds: multipliers relative to RegimeStat (defaults: Big=1.5×, Small=0.67×).
Colors: four independent colors for big/small × bull/bear.
Panel position & text size.
Hidden outputs: expose RegimeStat, TodayStat, Ratio, and Z-score to other scripts.
Alerts
RegimeATR: BIG bar — triggers when a bar meets the “Big” condition.
RegimeATR: SMALL bar — triggers when a bar meets the “Small” condition.
Hidden outputs (for strategies/screeners)
RegimeATR_stat, TodayATR_stat, Today_vs_Regime_Ratio, BarTR_Zscore.
Notes & limitations
No look-ahead: calculations only use information available up to that bar. Historical colors reflect what would have been known then.
Warm-up: colors begin once there are at least N completed sessions; before that, regime is undefined by design.
Changing inputs (session window, multipliers, median/mean, gap toggle) recomputes the full series using the same rolling regime logic per bar.
Designed for standard candles. Styling respects existing chart colors when no condition triggers.
Practical tips
For a broader or tighter notion of “unusual,” adjust Big/Small multipliers.
Prefer Median in markets prone to outliers; use Mean if you want Z-score alignment with the panel’s regime mean/std.
Use the Ratio readout to spot compression/expansion days quickly (e.g., <0.7× = compressed session, >1.3× = expanded).
Roadmap
More session presets:
24h continuous (crypto, index CFDs).
23h/Globex futures (CME ETH with a 60-minute maintenance break).
Regional equities (LSE, Xetra, TSE), Asia/Europe/NY overlaps for FX.
Half-day/holiday templates and dynamic calendars.
Multi-regime comparison: track multiple overlapping regimes (e.g., RTH vs ETH for futures) and show separate stats/ratios.
Robust stats options: trimmed mean, MAD/Huber alternatives; optional percentile thresholds instead of fixed multipliers.
Subpanel visuals: rolling TodayATR and Ratio plots; optional Z-score ribbon.
Screener/strategy hooks: export boolean series for BIG/SMALL, plus a lightweight strategy template for backtesting entries/exits conditioned on regime volatility.
Performance/QOL: per-symbol presets, smarter warm-up, and finer control over sample caps for ultra-low TF charts.
Changelog
v0.9b (Beta)
Session presets (NYSE/CME RTH/FX NY/Custom) with timezone handling.
Panel enhancements: ratio + sample size n.
Four-state bar coloring (big/small × bull/bear).
Alerts for BIG/SMALL bars.
Hidden Z-score stream for downstream use.
Gap-in-TR toggle for the first in-session bar.
Disclaimer
For educational purposes only. Not investment advice. Validate thresholds and session settings across symbols/timeframes before live use.

Rolling Midpoint of Price & VWAP with ATR BandsThe Rolling Midpoint of Price & VWAP with ATR Bands indicator is a dual-equilibrium concept that fuses price-range structure and traded-volume flow into one continuously updating hybrid model. Traditional VWAPs reset each session and reflect where trading occurred by volume, while midpoints used here reveal where price has structurally balanced between extremes. This script merges both ideas into a cohesive, dynamic system. The Rolling Price Midpoint (50 % of range) represents the structural fair-value line, calculated as the average of the highest high and lowest low over a selected window. The Rolling VWAP (Volume-Weighted Window) tracks the flow-based fair-value line by weighting each bar’s typical price by its volume. Together, these components form the Hybrid Equilibrium — the adaptive center of gravity that shifts as price and volume evolve. Surrounding this equilibrium, ATR Bands at ± 2.226 ATR and ± 5.382 ATR define volatility envelopes that expand and contract with market energy. The result is a living cloud that breathes with the market: compressing during phases of balance and widening during impulsive movements, offering traders a clear visual framework for understanding equilibrium, volatility, and directional bias in real time.
➖
⚙️ Auto-Preset System
The Auto-Preset System intelligently adjusts lookback windows for both the Price Midpoint and VWAP calculations according to the active chart timeframe.
This ensures that the indicator automatically adapts to any trading style — from scalping on 1-minute charts to swing trading on daily or weekly charts — without manual tuning.
🔹 How It Works
When Auto-Preset mode is enabled, the script dynamically selects the most effective lookback lengths for each timeframe.
These presets are optimized to balance responsiveness and stability, maintaining consistent real-world coverage (e.g., the same approximate duration of price data) across all intervals.
📊 Preset Mapping Table
| Chart Timeframe | Price Midpoint Lookback | VWAP Lookback |
|:----------------:|:-----------------------:|:--------------:|
| 1–3m | 13 bars | 21 bars
| 5–10m | 21 bars | 34 bars
| 15–30m | 34 bars | 55 bars
| 1–2 hr | 55 bars | 89 bars
| 4 hr-1D | 89 bars | 144 bars
| 1W | 144 bars | 233 bars
| 1M | 233 bars | 377 bars
⚡ Notes & Customization
- Manual Override: Turn off Auto-Preset Mode to specify your own custom lookback lengths.
- Consistency Across Scales: These adaptive values keep the indicator visually coherent when switching between timeframes — avoiding distortions that can occur with static lengths.
- Practical Benefit: Traders can maintain a single chart layout that self-tunes seamlessly, removing the need to manually recalibrate settings when shifting from short-term to long-term analysis.
In short, the Auto-Preset System is designed to make this hybrid equilibrium tool timeframe-aware — automatically scaling its logic so that the cloud behaves consistently, regardless of chart resolution.
➖
🌐 Hybrid Equilibrium Envelope
The core hybrid midpoint acts as the mean of structural (price) and volumetric (VWAP) balance.
ATR-based bands project natural expansion zones:
🔸+2.226 / –2.226 ATR → inner equilibrium (controlled trend)
*🔸+5.382 / –5.382 ATR → outer volatility extension (over-stretch / reversion zones)
Color-coded fills show regime strength:
* 🟧 Upper Outer (+5.382) – strong bullish expansion
* 🟩 Upper Inner (+2.226) – trending equilibrium
* 🔴 Lower Inner (–2.226) – mild bearish control
* 🟣 Lower Outer (–5.382) – volatility exhaustion
➖
🧭 Higher-Timeframe Framework
Two macro anchors — Price length of 144 and VWAP length of 233 — outline higher-timeframe bias zones. These help confirm when local momentum aligns with (or fades against) long-term structure.
Labels on the right show active lookback values for quick readout:
`$(13) V(21)` → current rolling pair
`$144 / V233` → macro anchors
➖
🧩 Chart Examples
**AMD 15m (Equilibrium Expansion)**
Price steadily rides above the hybrid midpoint as teal and orange (bullish) ATR zones widen, confirming a phase of controlled bullish volatility and healthy trend expansion.
BTCUSD 1m (Volatility Compression)
Bitcoin coils tightly inside the teal-to-maroon equilibrium bands before breaking out.
The hybrid midpoint flattens and ATR envelopes contract, signaling a state of balance before volatility expansion.
ETHUSD 15m (Transition from Compression → Impulse)
Ethereum transitions from purple-zone compression into a clear upper-band expansion.
The hybrid midpoint breaks above the macro VWAP 233, confirming the shift from equilibrium to directional momentum.
SOFI 1m (Micro Bias Reversal)
SOFI’s intraday structure flips as price reclaims the hybrid midpoint.
The macro VWAP 233 flattens, signaling a transition from oversold lower bands back toward equilibrium and early trend recovery.
➖
🎯 How to Use
1. Bias Detection – Price > Hybrid Midpoint → bullish; < → bearish.
2. Volatility Gauge – Watch band spacing for compression / expansion cycles.
3. Confluence Checks – Align Hybrid Midpoint with HTF 233 VWAP for strong continuation signals.
4. Mean Reversion Zones – Outer bands highlight areas where probability of snap-back increases.
➖
🔧 Inputs & Customization
Auto Presets toggle
🔸Manual Lookback Overrides** for fine-tuning
🔸Plot Window Length** (show recent vs full history)
🔸ATR Sensitivity & Fill Opacity** controls
🔸Label Padding / Font Size** for cleaner overlay visuals
➖
🧮 Formula Highlights
➖Rolling Midpoint = (highest(high,N) + lowest(low,N)) / 2
➖Rolling VWAP = Σ(Typical Price×Vol) / Σ(Vol)
➖Hybrid = (PriceMid + VWAP) / 2
➖Upper₂ = Hybrid + ATR×2.226
➖Lower₂ = Hybrid − ATR×2.226
➖Upper₅ = Hybrid + ATR×5.382
➖Lower₅ = Hybrid − ATR×5.382
➖
🎯 Ideal For
➡️ Traders who want adaptive fair-value zones that evolve with both price and volume.
➡️ Analysts who shift between scalping, swing, and position timeframes, and need a tool that self-adjusts.
➡️ Those who rely on visual structure clarity to confirm setups across changing volatility conditions.
➡️ Anyone seeking a hybrid model that unites structural range logic (midpoint) and flow-based balance (VWAP).
➖
🏁 Final Word
This script is more than a visual overlay — it’s a complete trend and structure framework built to adapt with market rhythm. It helps traders visualize equilibrium, momentum, and volatility as one cohesive system. Whether you’re seeking clean trend alignment, dynamic support/resistance, or early warning signs of reversals, this indicator is tuned to help you react with confidence — not hindsight.
➖
Remember — no single indicator should ever stand alone. For best results, pair it with price action context, higher-timeframe structure, and complementary tools such as moving averages or trendlines. Use it to confirm setups, not define them in isolation.
💡 Turn logic into clarity, structure into trades, and uncertainty into confidence.

50% Fib Trend Cloud + ATR BandsThis indicator plots two structural 50% fibonacci midpoints from recent confirmed 'left/right' swings that form a *cloud* of equilibrium, then adds a rolling 50% fibonacci range midpoint based on a lookback window that's wrapped in ATR bands. Importantly, it solves a specific trading problem:
Structural midpoints (macro context) are powerful but can lag when price escapes prior ranges. Enter rolling 50% fib + ATR ➡️ which restores real-time balance & tolerance (micro context). Together they show where price is balanced structurally, where it’s balanced right now, and how much volatility to tolerate before acting.
➖➖➖
🔑 Why this is different
Most tools either draw a single midpoint (ex., daily 50%) or ATR bands around a moving average. This script fuses dual swing-based 50% midpoints (structure) + a rolling 50% with ATR (flow), so you don’t lose context when price escapes prior ranges. The cloud tells you who’s in control (fast vs. slow structure). The rolling 50% + ATR tells you how far is “too far” now.
➖➖➖
🧠 What it does (at a glance)
🔸Structural Equilibrium × 2 (Fib1/Fib2)
Two independent 50% midpoints formed from swing pivots (configurable Left/Right bars + optional smoothing). Their gap is the Midpoint Cloud = structural “fair value” zone.
🔸Rolling 50% + ATR Bands
A rolling highest/lowest window computes an always-current 50% rolling midpoint plot; ±ATR × length envelopes define a soft value area and over-stretch boundaries.
🔸Actionable Visuals
Optional fill between Fib1/Fib2, labels, and candle-overlay modes to instantly read regime (above both / below both / between).
🔸Smart Defaults
Timeframe-aware presets for L/R pivots & smoothing; full manual overrides available.
➖➖➖
⚙️ Calculations (plain-English)
🔸Pivot midpoints (Fib1 & Fib2):
1) Detect a swing using `Left/Right` bars
2) Take the swing’s high/low → compute 50%
3) (Optional) Smooth the line (SMA) to stabilize on noisy TFs
4) Repeat with a different sensitivity to get two distinct midpoints
🔸Rolling midpoint:
Highest High / Lowest Low over the last *N* bars → (HH + LL) / 2
🔸ATR levels:
`Upper = Rolling50 + ATR × Mult`, `Lower = Rolling50 − ATR × Mult`
(Typical: ATR length 14–21; Multipliers 2.236 for L1, 5.382 for L2)
➖➖➖
🤖 Auto-Configured Presets (with Manual Override)
💡Goal: make the midpoints “just work” on common timeframes while still letting you dial them in.
💡How Auto Presets work
When Auto Presets = ON, the script picks sensible L/R/S (Left bars / Right bars / Smoothing) for Fib Trend 1 and Fib Trend 2 based on chart timeframe.
🔸Fib 1 (fast) emphasizes *micro-structure* for quicker bias shifts.
🔸Fib 2 (slow) emphasizes *macro-structure* for anchor/bias context.
These defaults keep Fib 1 responsive without jitter and Fib 2 stable without lag.
➡️ Turn Auto Presets = OFF to take full control with the manual inputs described below.
➖➖➖
🛠 Manual Fib Midpoint Settings (when Auto = OFF)
💡Each midpoint uses three knobs:
🔸Pivot Left (L): bars to the left that must be lower/higher to qualify a swing
🔸Pivot Right (R): bars to the right that must be lower/higher to confirm the swing
🔸Smoothing (S): SMA period applied to the raw 50% midpoint (stabilizes noise)
5-Minute optimized defaults
🔸Fib Trend 1: `L21 / R5 / S55` → responsive local structure (entries/exits, re-balancing zones)
🔸Fib Trend 2: `L55 / R13 / S89` → broader structure (trend context, anchors/stops)
Timeframe guidance
🔸1m–3m: may feel a touch laggy → consider ~`L13 / R3 / S34`
🔸15m–1h: defaults remain strong → optionally ~`L34 / R8 / S89`
🔸4h+ : increase span for stability → `L89–144 / R13–21 / S144–233`
➡️ Rule of thumb: shorter L/R = faster detection, longer S = smoother line. Tune until Fib 1 captures the “active swing” and Fib 2 captures the “dominant swing” without whipsaw.
➖➖➖
🎛 Inputs (quick reference)
🔸Fib Trend 1/2: Source (High/Low/Close), Left/Right bars, Smoothing length, Show/Hide, Cloud fill toggle
🔸Rolling 50%: Lookback length, Price basis (Wicks/Close/HLC3/OHLC4), Plot scope (Full / Last N / None)
🔸ATR Bands: ATR length, Multipliers (L1/L2), Plot scope, Line width/colors
🔸Overlay & Labels: Candle overlay mode, Label padding/size, 50% centerline toggle, Plot widths
➖➖➖
🖍️ Candle Coloring & Overlay Modes
💡Purpose: make trend instantly visible on the candles and ATR levels.
1) Color Logic (dropdown)
🔸 Fib Midpoints — Colors by position of price vs. Fib 1 & Fib 2
🔸ATR Zones — Colors by which ATR zone price is in relative to the Rolling 50%
➡️ Price Reference: Choose the input used for the decision (Close, HL2, OHLC3, OHLC4).
➡️Tip: Close is crisp; HL2/OHLC variants are smoother.
2) Overlay Style (dropdown)
🔸 None — No visual change to candles
🔸 Bar Color — Uses `barcolor()` to tint built-in candles (this takes into account your Trading View settings, for instance if you have wicks set to white, they will show up as white with this setting)
🔸 PlotCandles — Draws unified custom candles (body, wick, border) with the same color for maximum clarity
💡Practical use
🔸 Pick Fib Midpoints to read structural bias at a glance (above/below/between the cloud).
🔸 Pick ATR Zones to read value vs. stretch around the Rolling 50% (mean-reversion vs. trend extension).
➖➖➖
📘 How to use
A) Trend confirmation
- Strong bullish bias when price holds above both structural mids; strong bearish when below both.
- Use the Rolling 50% + ATR as a dynamic re-entry zone: pullbacks that respect ATR(L1) often continue the prevailing trend.
B) Transition / mean reversion
- Inside the Cloud (between Fib1 & Fib2) treat behavior as neutralization/re-balancing; range tactics tend to outperform momentum plays.
- In ranges, fades near ±ATR around the rolling 50% can mark short-term edges.
C) Breakout context
- When price leaves the Cloud, the Rolling 50% keeps you anchored so price never feels “floating.” A clean hold outside ATR(L1/L2) suggests regime strength; quick re-entries hint at traps.
➖➖➖
🖼 Chart examples
➡️ Each snapshot shows how the Cloud (structure) and the Rolling 50% + ATR (flow) work together.
1) 1-Minute Downtrend – Cloud as Dynamic Ceiling
- The Cloud slopes down; pullbacks repeatedly fail under the Cloud’s underside.
- Rolling 50% (dashed mid) + ATR(L1) act as a reversion band: rallies stall near upper ATR and rotate lower.
2) 15-Minute Persistent Drift – Structure Guides, Flow Times Entries
- Long drift lower with Cloud overhead.
- Consolidations near the rolling mid resolve in the trend direction; ATR bands frame risk on each attempt.
3) 15-Minute Uptrend (BTC) – From Cloud Escape to Value Stair-Step
- After escaping the prior Cloud, rolling 50% + ATR establish a new higher value area.
- Pullbacks into ATR(L1) produce orderly stair-steps; Cloud remains supportive on deeper dips
4) 5-Minute BTC – Pullback to Value then Rotate
- Strong leg up; retrace tags lower ATR band and rotates back toward the rolling mid.
- Labels (Fib1/Fib2) make the structural context explicit for decision-making.
➖➖➖
🧪 Starter presets
- Intraday (5–15m): Fib1 ~ L21/R5 (smooth 5), Fib2 ~ L55/R13 (smooth 9) • Rolling = 55 • ATR = 14 • L1 = 2.5x, L2 = 5.0x
- Scalping: Shorten lookbacks & smoothing; keep ATR multipliers similar, or tighten L1.
- Swing: Lengthen all lookbacks; consider ATR length 21–28.
➖➖➖
🏁Final Word
This script is not just a visual tool, it’s a complete trend and structure framework. Whether you're looking for clean trend alignment, dynamic support/resistance, or early warning signs of a reversal, this system is tuned to help you react with confidence — not hindsight.
Rembember, no single indicator should be used in isolation. For best results, combine it with price action analysis, higher-timeframe context, and complementary tools like trendlines, moving averages etc Use it as part of a well-rounded trading approach to confirm setups — not to define them alone.
---
💡Turn logic into clarity. Structure into trades. And uncertainty into confidence.

Risk Recommender — (Heatmap)📊 Risk Recommender — Per-Trade & Annualized (Heatmap Columns)
Estimate the optimal risk percentage for any market regime.
This tool dynamically recommends how much of your account equity to risk — either per trade or at a portfolio (annualized) level — using volatility as the guide.
⚙️ How it works
Two distinct modes give you flexibility:
1️⃣ Per-Trade (ATR-based)
• Calculates the current Average True Range (ATR) compared to its long-term baseline.
• When volatility is high (ATR ↑), risk per trade decreases to maintain constant dollar risk.
• When volatility is low (ATR ↓), risk per trade increases within your defined floor and ceiling.
• The display is normalized by stop distance (× ATR) and smoothed to avoid noise.
2️⃣ Annualized (Volatility Targeting)
• Computes realized volatility (standard deviation of log returns) and an EWMA forecast of future volatility.
• Blends current and forecast volatilities to estimate “effective” volatility.
• Scales your base risk so that portfolio volatility converges toward your chosen annual target (e.g., 20%).
• Useful for portfolio-level or systematic strategies that maintain constant volatility exposure.
🎨 Heatmap Visualization
The vertical column graph acts like a thermometer:
• 🟥 Red → “Reduce risk” (volatility high).
• 🟩 Green → “Increase risk” (volatility low).
• Smoothed and bounded between your Floor and Ceiling risk levels.
• Optional dotted guides mark those bounds.
• Label shows the current mode, recommended risk %, and key metrics (ATR ratio or effective volatility).
🔧 Key Inputs
• Base max risk per trade (%) — your normal per-trade risk budget.
• ATR length / Baseline ATR length — control sensitivity to short- vs. long-term volatility.
• Target annualized volatility (%) — portfolio volatility target for quant mode.
• λ (lambda) — smoothing factor for the EWMA volatility forecast (0.90–0.99 typical).
• Floor & Ceiling — clamps the output to avoid extreme sizing.
• Smoothing & Hysteresis — prevent rapid changes in risk recommendations.
🧮 Interpreting the Output
• “Recommended Risk (%)” = suggested portion of equity to risk on the next trade (or current exposure).
• In Per-Trade mode: reflects current ATR ÷ baseline ATR .
• In Annualized mode: reflects target volatility ÷ effective volatility .
• Use the color and height of the column as a quick visual cue for aggressiveness.
💡 Typical Use Cases
• Position-sizing overlay for discretionary traders.
• Volatility-targeting component for algorithmic or multi-asset systems.
• Educational tool to understand how volatility governs prudent risk management.
📘 Notes
• This indicator provides risk suggestions only ; it does not place trades.
• Works on any symbol or timeframe.
• Combine with your own strategy or alerts for full automation.
• All calculations use built-in Pine functions; no proprietary logic.
Tags:
#RiskManagement #ATR #Volatility #Quant #PositionSizing #SystematicTrading #AlgorithmicTrading #Portfolio #TradingStrategy #Heatmap #EWMA #Risk

Dominant DATR [CHE] Dominant DATR — Directional ATR stream with dominant-side EMA, bands, labels, and alerts
Summary
Dominant DATR builds two directional volatility streams from the true range, assigns each bar’s range to the up or down side based on the sign of the close-to-close move, and then tracks the dominant side through an exponential average. A rolling band around the dominant stream defines recent extremes, while optional gradient coloring reflects relative magnitude. Swing-based labels mark new higher highs or lower lows on the dominant stream, and alerts can be enabled for swings, zero-line crossings, and band breakouts. The result is a compact pane that highlights regime bias and intensity without relying on price overlays.
Motivation: Why this design?
Conventional ATR treats all range as symmetric, which can mask directional pressure, cause late regime shifts, and produce frequent false flips during noisy phases. This design separates the range into up and down contributions, then emphasizes whichever side is stronger. A single smoothed dominant stream clarifies bias, while the band and swing markers help distinguish continuation from exhaustion. Optional normalization by close makes the metric comparable across instruments with different price scales.
What’s different vs. standard approaches?
Reference baseline: Classic ATR or a basic EMA of price.
Architecture differences:
Directional weighting of range using positive and negative close-to-close moves.
Separate moving averages for up and down contributions combined into one dominant stream.
Rolling highest and lowest of the dominant stream to form a band.
Optional normalization by close, window-based scaling for color intensity, and gamma adjustment for visual contrast.
Event logic for swing highs and lows on the dominant stream, with label buffering and pruning.
Configurable alerts for swings, zero-line crossings, and band breakouts.
Practical effect: You see when volatility is concentrated on one side, how strong that bias currently is, and when the dominant stream pushes through or fails at its recent envelope.
How it works (technical)
Each bar’s move is split into an up component and a down component based on whether the close increased or decreased relative to the prior close. The bar’s true range is proportionally assigned to up or down using those components as weights.
Each side is smoothed with a Wilder-style moving average. The dominant stream is the side with the larger value, recorded as positive for up dominance and negative for down dominance.
The dominant stream is then smoothed with an exponential moving average to reduce noise and provide a responsive yet stable signal line.
A rolling window tracks the highest and lowest values of the dominant EMA to form an envelope. Crossings of these bounds indicate unusual strength or weakness relative to recent history.
For visualization, the absolute value of the dominant EMA is scaled over a lookback window and passed through a gamma curve to modulate gradient intensity. Colors are chosen separately for up and down regimes.
Swing events are detected by comparing the dominant EMA to its recent extremes over a short lookback. Labels are placed when a prior bar set an extreme and the current bar confirms it. A managed array prunes older labels when the user-defined maximum is exceeded.
Alerts mirror these events and also include zero-line crossings and band breakouts. The script does not force closed-bar confirmation; users should configure alert execution timing to suit their workflow.
There are no higher-timeframe requests and no security calls. State is limited to simple arrays for labels and persistent color parameters.
Parameter Guide
Parameter — Effect — Default — Trade-offs/Tips
ATR Length — Smoothing of directional true range streams — fourteen — Longer reduces noise and may delay regime shifts; shorter increases responsiveness.
EMA Length — Smoothing of the dominant stream — twenty-five — Lower values react faster; higher values reduce whipsaw.
Band Length — Window for recent highs and lows of the dominant stream — ten — Short windows flag frequent breakouts; long windows emphasize only exceptional moves.
Normalize by Close — Divide by close price to produce a percent-like scale — false — Useful across assets with very different price levels.
Enable gradient color — Turn on magnitude-based coloring — true — Visual aid only; can be disabled for simplicity.
Gradient window — Lookback used to scale color intensity — one hundred — Larger windows stabilize the color scale.
Gamma (lines) — Adjust gradient intensity curve — zero point eight — Lower values compress variation; higher values expand it.
Gradient transparency — Transparency for gradient plots — zero, between zero and ninety — Higher values mute colors.
Up dark / Up neon — Base and peak colors for up dominance — green tones — Styling only.
Down dark / Down neon — Base and peak colors for down dominance — red tones — Styling only.
Show zero line / Background tint — Visual references for regime — true and false — Background tint can help quick scanning.
Swing length — Bars used to detect swing highs or lows — two — Larger values demand more structure.
Show labels / Max labels / Label offset — Label visibility, cap, and vertical offset — true, two hundred, zero — Increase cap with care to avoid clutter.
Alerts: HH/LL, Zero Cross, Band Break — Toggle alert rules — true, false, false — Enable only what you need.
Reading & Interpretation
The dominant EMA above zero indicates up-side dominance; below zero indicates down-side dominance.
Band lines show recent extremes of the dominant EMA; pushes through the band suggest unusual momentum on the dominant side.
Gradient intensity reflects local magnitude of dominance relative to the chosen window.
HH/LL labels appear when the dominant stream prints a new local extreme in the current regime and that extreme is confirmed on the next bar.
Zero-line crosses suggest regime flips; combine with structure or filters to reduce noise.
Practical Workflows & Combinations
Trend following: Consider entries when the dominant EMA is on the regime side and expands away from zero. Band breakouts add confirmation; structure such as higher highs or lower lows in price can filter signals.
Exits and stops: Tighten exits when the dominant stream stalls near the band or fades toward zero. Opposite swing labels can serve as early caution.
Multi-asset and multi-timeframe: Works across liquid assets and common timeframes. For lower noise instruments, reduce smoothing slightly; for high noise, increase lengths and swing length.
Behavior, Constraints & Performance
Repaint and confirmation: No security calls and no future-looking references. Swing labels confirm one bar later by design. Real-time crosses can change intra-bar; use bar-close alerts if needed.
Resources: `max_bars_back` is two thousand. The script uses an array for labels with pruning, gradient color computations, and a simple while loop that runs only when the label cap is exceeded.
Known limits: The EMA can lag at sharp turns. Normalization by close changes scale and may affect thresholds. Extremely gappy data can produce abrupt shifts in the dominant side.
Sensible Defaults & Quick Tuning
Starting point: ATR Length fourteen, EMA Length twenty-five, Band Length ten, Swing Length two, gradient enabled.
Too many flips: Increase EMA Length and swing length, or enable only swing alerts.
Too sluggish: Decrease EMA Length and Band Length.
Inconsistent scales across symbols: Enable Normalize by Close.
Visual clutter: Disable gradient or reduce label cap.
What this indicator is—and isn’t
This is a volatility-bias visualization and signal layer that highlights directional pressure and intensity. It is not a complete trading system and does not produce position sizing or risk management. Use it with market structure, context, and independent risk controls.
Disclaimer
The content provided, including all code and materials, is strictly for educational and informational purposes only. It is not intended as, and should not be interpreted as, financial advice, a recommendation to buy or sell any financial instrument, or an offer of any financial product or service. All strategies, tools, and examples discussed are provided for illustrative purposes to demonstrate coding techniques and the functionality of Pine Script within a trading context.
Any results from strategies or tools provided are hypothetical, and past performance is not indicative of future results. Trading and investing involve high risk, including the potential loss of principal, and may not be suitable for all individuals. Before making any trading decisions, please consult with a qualified financial professional to understand the risks involved.
By using this script, you acknowledge and agree that any trading decisions are made solely at your discretion and risk.
Do not use this indicator on Heikin-Ashi, Renko, Kagi, Point-and-Figure, or Range charts, as these chart types can produce unrealistic results for signal markers and alerts.
Best regards and happy trading
Chervolino

MACD-V+ (ATR Normalized MACD)MACD-V+ is an ATR-normalized MACD tool that focuses on true turning points inside Overbought/Oversold zones. It marks a signal only when the MACD’s slope changes direction and shows real progress back toward the zero line, with an optional dwell (depth & time) filter so you don’t get faked out by shallow pokes into a zone. Clean visuals, “first-in-zone” gating, and configurable labeling make it practical for discretionary and systematic traders alike.
For best results, adjust Overbought and Oversold levels based on stock volatility. The default settings of 150 and -150 are for highly volatile tickers. Reduce for less volatile tickers.
Please help me improve the code for everyone.

Vol-Pace Projected-ATR-ADX-Alert-MAThe VolSC indicator analyzes stock volume trends with a focus on the Pace metric, which projects today's volume as a percentage of the 30-day average, highlighting unusual activity (e.g., over 200% turns bright green with alerts). The phantom projection bar, a wide green histogram to the right of the last bar, visually represents this projected volume on daily charts only, aiding quick identification of potential volume surges without cluttering intraday or weekly views. Additional features include ADX strength, ATR averages, and customizable table display for comprehensive insights.
Key Features:
* Primary Indicator: Volume with ADX (Average Directional Index) text.
* Pacing and Alerts: Calculates the volume pace for the day. Features an unusual volume alert with an adjustable threshold (e.g., 200%).
* Volume Projection: Projects a visual "Phantom Volume" for the day, offset to the right of the actual volume bar.
* ATR Indicator: Displays the 2x ATR (Average True Range) value as text.
* Volume Average: Displays the ADV (Average Daily Volume) Moving Average as text.
* Customization: Most settings are adjustable.

Elite Entries VWAP Fibonacci Bands PremiumElite Entries VWAP Fibonacci Bands
Precision pullbacks. Cleaner trends. External filter ready.
What it is
A professional-grade VWAP/MIDAS-based band system with optional TRAMA or EMA central lines, Fibonacci expansion zones (0.236/0.382/0.5/0.618/0.786), reversal/pullback signals, and an ATR trailing stop. The latest update adds an Open-Source Filter that lets you gate entries using any other indicator’s plot on your chart. That means fewer false signals and cleaner alignment with your personal edge.
Why traders love it
Dialed pullbacks & trend breaks at 0.236 / 0.382 / 0.618
Clean reversal reads at 0.382 / 0.618 / 0.786
External filter integration (choose Source A/B from any indicator)
Stackable filters: Volume > SMA(20) + RSI threshold
ATR trailing stop included for exits
Flexible midline: MIDAS (anchored VWAP), TRAMA, or EMA
Fib bands you can color & label individually
What’s new (vX.X)
Open-Source Filter (External Indicator Gating)
Pick Source A (and optional B) from other indicators on your chart.
Comparators for entries: Close > A, A > B, A crosses up B, A > Threshold, A rising (and mirrored sell rules).
Apply to Pullback/Trend only (236/382/618) or All Signals (adds reversals, retests, rejections).
Built-in SMA smoothing for A/B to tame noisy externals.
Stability fix: valid input.source defaults to avoid compile errors.
Signals included
Reversals: 0.786, 0.618, 0.382
Pullback/Trend breaks: 0.236 / 0.382 / 0.618 (above/below central line)
Centerline retests (bounce confirmation)
0.618 rejections (directional candle logic)
ATR Trailing Stop (long/short)
All signals honor active filters (Volume/RSI + Open-Source Filter if enabled).
Quick start
Choose your Central Line: MIDAS (anchored VWAP), TRAMA, or EMA.
Set anchor (Timeframe or Date) and Std Dev Multiplier to size the bands.
Enable the pullback/trend signals you want (236/382/618) + any reversals.
Optional filters: Volume > SMA(20) and RSI threshold.
To gate with another indicator: turn on Open-Source Filter, pick Source A (and B), choose comparators, and select scope (Pullback/Trend Only or All Signals).
(Optional) Enable ATR trailing stop for dynamic exits.
Turn on alerts—you’re live.
Best-use ideas
Trend alignment: Gate buys with A rising where A = your HTF MA/VWAP; gate sells with A falling.
Momentum cross: A crosses up B (A=fast, B=slow) to allow only momentum-supported pullbacks.
Level validation: Close > A to ensure price is reclaiming your external baseline before entries.
Alerts
Alerts are available for every signal (reversal, pullback/trend break, retest, rejection). They only fire when all enabled filters pass.
Works on
Any symbol/any timeframe. Day trading, scalping, swing trading—especially useful during NY session volatility and post-anchor resets.
Notes & disclaimer
External filter dropdowns list plots exposed by other indicators.
Trading involves risk. This tool is for education/information—not financial advice.
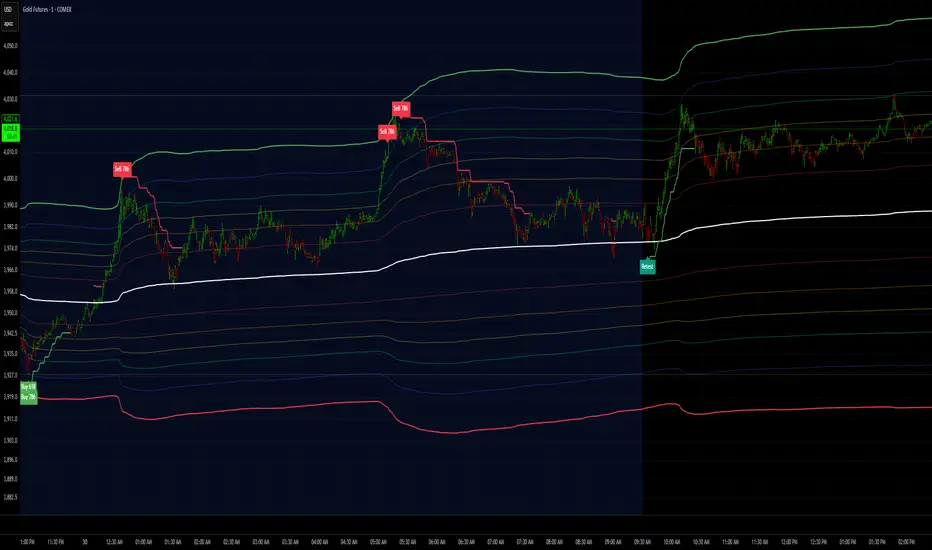
Multi-Timeframe Trend ImprovedMulti-Timeframe Trend Improved — Volatility Stop & Trend Change Alerts
This script tracks trend direction across four customizable timeframes using a Volatility Stop method based on ATR. It displays:
VolStop levels and trend direction (Uptrend/Downtrend) per timeframe.
Bars since the last trend change in each timeframe.
A customizable table showing all data with color-coded trends.
Visual alerts via triangle shapes on the chart when a trend change occurs.
🔧 Fully configurable:
Timeframes (e.g., 65min, 4H, Daily, Weekly)
ATR length, multiplier, and smoothing
Table location, font size, border width, and label color
Ideal for traders who want a clear multi-timeframe overview of market trends and volatility-based support/resistance levels.

ATR Volatility and Trend AnalysisATR Volatility and Trend Analysis
Unlock the power of the Average True Range (ATR) with the ATR Volatility and Trend Analysis indicator. This comprehensive tool is designed to provide traders with a multi-faceted view of market dynamics, combining volatility analysis, dynamic support and resistance levels, and trend detection into a single, easy-to-use indicator.
How It Works
The ATR Volatility and Trend Analysis indicator is built upon the core concept of the ATR, a classic measure of market volatility. It expands on this by providing several key features:
Dynamic ATR Bands: The indicator plots three sets of upper and lower bands around the price. These bands are calculated by multiplying the current ATR value by user-defined multipliers. They act as dynamic support and resistance levels, widening during volatile periods and contracting during calm markets.
Volatility Breakout Signals: Identify potential breakouts with precision. The indicator generates a signal when the current ATR value surges above its own moving average by a specified threshold, indicating a significant increase in volatility that could lead to a strong price move.
Trend Detection: The indicator determines the market trend by analyzing both price action and ATR behavior. A bullish trend is signaled when the price is above its moving average and volatility is increasing. Conversely, a bearish trend is signaled when the price is below its moving average and volatility is increasing.
How to Use the ATR Multi-Band Indicator
Identify Support and Resistance: Use the ATR bands as key levels. Price approaching the outer bands may indicate overbought or oversold conditions, while a break of the bands can signal a strong continuation.
Confirm Breakouts: Look for a volatility breakout signal to confirm the strength behind a price move. A breakout from a consolidation range accompanied by a volatility signal is a strong indicator of a new trend.
Trade with the Trend: Use the background coloring and trend signals to align your trades with the dominant market direction. Enter long positions during confirmed bullish trends and short positions during bearish trends.
Set Up Alerts: The indicator includes alerts for band crosses, trend changes, and volatility breakouts, ensuring you never miss a potential trading opportunity.
What makes it different?
While many indicators use ATR, the ATR Volatility and Trend Analysis tool is unique in its integration of multiple ATR-based concepts into a single, cohesive system. It doesn't just show volatility; it interprets it in the context of price action to deliver actionable trend and breakout signals, making it a complete solution for ATR-based analysis.
Disclaimer
This indicator is designed as a technical analysis tool and should be used in conjunction with other forms of analysis and proper risk management.
Past performance does not guarantee future results, and traders should thoroughly test any strategy before implementing it with real capital.

ATR ProThe indicator was created for traders who are taking ATR seriously in their trading strategy and at the same time want a tool which will omit paranormal movements when showing a true average range of the asset as well os providing details on how the price moves in terms of volatility.
The Table:
ATR % Passed - Shows the current passed ATR as of average of last 10 days without taking into account biggest 2 and smallest 2 bars taking into account also the gap. The number after “/“ sign shows the true range in dollars.
Curr. D1 vs ATR % - Shows the size of current D1 bar as % of ATR above.
D1 Closure % - Shows % of closure of current D1 bar in relation to its own high or low. 100% means that the close price is the same of today’s high or low.
Volume 7d % - Shows the volume done as % of 7-day average.
5m bar - shows the size of current 5m bars in dollars and in the parentheses shows the 5m ATR in the same logic as the one above.
1m bar - shows the size of current 1m bars in dollars and in the parentheses shows the 1m ATR in the same logic as the one above.
Lines on the Chart:
The lines show the price lines where a specific % of ATR will already be passed. The indicator has 4 selections as %: 30, 50, 80 and 100 %.
Settings:
Table data position on the window
Text size
Text color
Colors of the ATR lines based on percentages.
Show/Hide the ATR lines individually
Use the Close of the current daily bar as the basis for calculating the ATR
Check this box when the market is closed – when doing homework.
Uncheck this box when the market opens, so that the ATR lines are drawn correctly on the chart.
Move the ATR line X bars to the right to keep it away from bars.

Signal Core Basic [NevoxCore]⯁ OVERVIEW
Signal Core Basic is a clean and functional ATR-based trailing stop with BUY/SELL signals.
It modernizes the classic "UT-style" concept with adaptive sensitivity, multi-source inputs (Close, Heikin-Ashi, ZLEMA, KAMA), and compact visuals.
The tool is designed for traders who want a clear, minimal, and reliable base indicator without repainting issues.
⯁ HOW IT WORKS
Calculates an ATR-based trailing stop (nLoss = Key × ATR).
Adaptive mode scales sensitivity depending on trend strength (trend/range detection).
Trailing stop flips when price crosses from one regime to the other.
BUY/SELL signals trigger only when confirmed and not blocked by cooldown.
Label ring-buffer ensures chart stays clean (max 50 labels).
Bar coloring optional (solid), auto-disabled when classic red/green colors are enabled.
⯁ KEY FEATURES
ATR-based trailing stop with adjustable sensitivity.
Adaptive key (trend/range aware).
Multiple compute sources: Close, Heikin-Ashi, ZLEMA, KAMA.
Global confirm-on-close switch (no repaint).
Early-flip protection (cooldown).
Compact BUY/SELL labels with auto-cleanup (max 50).
Optional solid bar coloring.
Alerts with ticker, timeframe, and price included.
⯁ SETTINGS (quick overview)
Visual: Classic Colors, Show Labels, Plot Trailing Stop, Barcolor ON/OFF.
Source & Sensitivity: Key Value, ATR Length, Compute Source.
Advanced: Adaptive Key toggle with min/max bounds.
Global: Confirm on bar close.
Extras: Cooldown protection (bars).
⯁ ALERTS (built-in)
Basic Long: BUY signal.
Basic Short: SELL signal.
Each alert includes {{ticker}} {{interval}} @ {{close}}.
⯁ HOW TO USE
Use as a trailing stop and regime filter.
Combine BUY/SELL signals with your strategy rules.
Enable cooldown for cleaner signals in choppy markets.
Try ZLEMA or Heikin-Ashi as compute source for smoother performance.
⯁ WHY IT’S DIFFERENT
Unlike generic UT-style scripts, Signal Core Basic adds adaptive sensitivity, multiple input sources, and strict non-repaint safety.
The visuals follow NevoxCore’s design standards: compact, minimal, and clean — ready for live trading with alerts.
⯁ DISCLAIMER
Backtest and paper-trade before using live. Not financial advice.
Performance depends on market, timeframe, and parameters.