ASFX - Automatic VWAPs & Key LevelsAutomate your AVWAPs and key levels for day trading! NY Market open VWAP, Previous day NY VWAP, and more are included. Inital Balance and Opening Range are also automated.
Avwap

ORBs, EMAs, SMAs, AVWAPThis is an update to a previously published script. In short the difference is the added capability to adjust the length of EMAs. Also added 3 customizable SMAs. Enjoy! Let me know what you think of the script please. This is only second one I have ever done. Through practice and people like @LuxAlgo and other Pinescripters this isn't possible. Tedious hrs with ChatGPT to correct nuances, who doesnt seem to learn from (insert pronoun) mistakes
This all-in-one indicator combines key institutional tools into a unified framework for intraday and swing trading. Designed for traders who use multi-session analysis and dynamic levels, it automatically maps out global session breakouts, moving averages, and volume-weighted anchors with high clarity.
Features include:
🕓 Tokyo, London, and New York ORBs (Opening Range Breakouts) — 30-minute configurable range boxes that persist until the next New York open.
📈 Anchored VWAP with Standard Deviation Bands — dynamically anchorable to session, week, or month for institutional-grade price tracking.
📊 Exponential Moving Averages (9, 20, 113, 200) — for short-, mid-, and long-term momentum structure.
📉 Simple Moving Averages (20, 50, 100) — fully customizable lengths, colors, and visibility toggles for trend confirmation.
🏁 Prior High/Low Levels (PDH/PDL, PWH/PWL, PMH/PML) — automatically plotted from previous day, week, and month, with labels placed at each session’s midpoint.
🎛️ Session-Aligned Time Logic — all time calculations use New York session anchors with DST awareness.
💡 Clean Visualization Options — every component can be toggled on/off, recolored, or customized for your workflow.
Best used for:
ORB break-and-retest setups
VWAP and EMA rejections
Confluence-based trading around key session levels
Multi-session momentum tracking

ORBs, EMAs, AVWAPThis Pine Script (version 6) is a multi-session trading indicator that combines Opening Range Breakouts (ORBs), Exponential Moving Averages (EMAs), and an Anchored VWAP (AVWAP) system — all in one overlay script for TradingView.
Here’s a clear breakdown of its structure and functionality:
🕒 1. Session Logic and ORB Calculation
Purpose: Identify and plot the high and low of the first 30 minutes (default) for the Tokyo, London, and New York trading sessions.
Session Anchors (NY time):
Tokyo → 20:00
London → 03:00
New York → 09:30
(All configurable in inputs.)
ORB Duration: Default is 30 minutes (orbDurationMin), also user-configurable.
Resets:
London and NY ORBs reset at the start of each new New York trading day (17:00 NY time).
Tokyo ORB resets independently using a stored timestamp.
Process:
For each session:
While the time is within the ORB window, the script captures the session’s high and low.
Once the window closes, those levels remain plotted until reset.
Plot Colors:
Tokyo → Yellow (#fecc02)
London → Gray (#8c9a9c)
New York → Magenta (#ff00c8)
These form visible horizontal lines marking the prior session ranges — useful for breakout or retest trading setups.
📈 2. EMA System
Purpose: Provide trend and dynamic support/resistance guidance.
It calculates and plots four EMAs:
EMA Period Color Purpose
EMA 9 Short-term Green Fast signal
EMA 20 Short-term Red Confirms direction
EMA 113 Medium Aqua Trend filter
EMA 200 Long-term Orange Macro trend baseline
Each EMA is plotted directly on the price chart for visual confluence with ORB and VWAP levels.
⚖️ 3. Anchored VWAP (AVWAP)
Purpose: Display a volume-weighted average price anchored to specific timeframes or events, optionally with dynamic deviation or percentage bands.
Features:
Anchor Options:
Time-based: Session, Week, Month, Quarter, Year, Decade, Century
Event-based: Earnings, Dividends, Splits
VWAP resets when the chosen anchor condition is met (e.g., new month, new earnings event, etc.).
Bands:
Up to three levels of symmetric upper/lower bands.
Choose between Standard Deviation or Percentage-based widths.
Display Toggles:
Each band’s visibility is optional.
VWAP can be hidden on 1D+ timeframes (hideonDWM option).
Color Scheme:
VWAP: Fuchsia (magenta-pink) line
Bands: Green / Olive / Teal with light-filled zones
⚙️ 4. Technical Highlights
Uses ta.vwap() with built-in band calculations.
Handles instruments with or without volume (errors if missing volume).
Uses time-zone aware timestamps (timestamp(NY_TZ, …)).
Uses timeframe.change() to detect new anchors for the VWAP.
Employs persistent variables (var) to maintain session state across bars.
💡 In Practice
This indicator is designed for multi-session intraday traders who:
Trade Tokyo, London, or NY open breakouts or retests.
Use EMA stacking and crossovers for trend confirmation.
Use Anchored VWAP as a fair-value or mean-reversion reference.
Need clear visual structure across different market sessions.
It provides strong session separation, trend context, and volume-weighted price reference — making it ideal for discretionary or semi-systematic trading strategies focused on liquidity zones and session momentum.

Auto AVWAP (Anchored-VWAP) with Breakout Screener_v2Updated indicator for AWAP breakout. The indicator identified the candle that breaks out of AVWAP

J. YOUNG INDICATOR (2)QUICK REFERENCE to help with a PRICE FOR OPTIONS and or B/H entry MEDIAN PRICE of the MONTHLY/QUARTERLY aVWAPS to get a more accurate price point

FlowSpike ES — BB • RSI • VWAP + AVWAP + News MuteThis indicator is purpose-built for E-mini S&P 500 (ES) futures traders, combining volatility bands, momentum filters, and session-anchored levels into a streamlined tool for intraday execution.
Key Features:
• ES-Tuned Presets
Automatically optimized settings for scalping (1–2m), daytrading (5m), and swing trading (15–60m) timeframes.
• Bollinger Band & RSI Signals
Entry signals trigger only at statistically significant extremes, with RSI filters to reduce false moves.
• VWAP & Anchored VWAPs
Session VWAP plus anchored VWAPs (RTH open, weekly, monthly, and custom) provide high-confidence reference levels used by professional order-flow traders.
• Volatility Filter (ATR in ticks)
Ensures signals are only shown when the ES is moving enough to offer tradable edges.
• News-Time Mute
Suppresses signals around scheduled economic releases (customizable windows in ET), helping traders avoid whipsaw conditions.
• Clean Alerts
Long/short alerts are generated only when all conditions align, with optional bar-close confirmation.
Why It’s Tailored for ES Futures:
• Designed around ES tick size (0.25) and volatility structure.
• Session settings respect RTH hours (09:30–16:00 ET), the period where most liquidity and institutional flows concentrate.
• ATR thresholds and RSI bands are pre-tuned for ES market behavior, reducing the need for manual optimization.
⸻
This is not a generic indicator—it’s a futures-focused tool created to align with the way ES trades day after day. Whether you scalp the open, manage intraday swings, or align to weekly/monthly anchored flows, FlowSpike ES gives you a clear, rules-based signal framework.

Structural Liquidity Signals [BullByte]Structural Liquidity Signals (SFP, FVG, BOS, AVWAP)
Short description
Detects liquidity sweeps (SFPs) at pivots and PD/W levels, highlights the latest FVG, tracks AVWAP stretch, arms percentile extremes, and triggers after confirmed micro BOS.
Full description
What this tool does
Structural Liquidity Signals shows where price likely tapped liquidity (stop clusters), then waits for structure to actually change before it prints a trigger. It spots:
Liquidity sweeps (SFPs) at recent pivots and at prior day/week highs/lows.
The latest Fair Value Gap (FVG) that often “pulls” price or serves as a reaction zone.
How far price is stretched from two VWAP anchors (one from the latest impulse, one from today’s session), scaled by ATR so it adapts to volatility.
A “percentile” extreme of an internal score. At extremes the script “arms” a setup; it only triggers after a small break of structure (BOS) on a closed bar.
Originality and design rationale, why it’s not “just a mashup”
This is not a mashup for its own sake. It’s a purpose-built flow that links where liquidity is likely to rest with how structure actually changes:
- Liquidity location: We focus on areas where stops commonly cluster—recent pivots and prior day/week highs/lows—then detect sweeps (SFPs) when price wicks beyond and closes back inside.
- Displacement context: We track the last Fair Value Gap (FVG) to account for recent inefficiency that often acts as a magnet or reaction zone.
- Stretch measurement: We anchor VWAP to the latest N-bar impulse and to the Daily session, then normalize stretch by ATR to assess dislocation consistently across assets/timeframes.
- Composite exhaustion: We combine stretch, wick skew, and volume surprise, then bend the result with a tanh transform so extremes are bounded and comparable.
- Dynamic extremes and discipline: Rather than triggering on every sweep, we “arm” at statistical extremes via percent-rank and only fire after a confirmed micro Break of Structure (BOS). This separates “interesting” from “actionable.”
Key concepts
SFP (liquidity sweep): A candle briefly trades beyond a level (where stops sit) and closes back inside. We detect these at:
Pivots (recent swing highs/lows confirmed by “left/right” bars).
Prior Day/Week High/Low (PDH/PDL/PWH/PWL).
FVG (Fair Value Gap): A small 3‑bar gap (bar2 high vs bar1 low, or vice versa). The latest gap often acts like a magnet or reaction zone. We track the most recent Up/Down gap and whether price is inside it.
AVWAP stretch: Distance from an Anchored VWAP divided by ATR (volatility). We use:
Impulse AVWAP: resets on each new N‑bar high/low.
Daily AVWAP: resets each new session.
PR (Percentile Rank): Where the current internal score sits versus its own recent history (0..100). We arm shorts at high PR, longs at low PR.
Micro BOS: A small break of the recent high (for longs) or low (for shorts). This is the “go/no‑go” confirmation.
How the parts work together
Find likely liquidity grabs (SFPs) at pivots and PD/W levels.
Add context from the latest FVG and AVWAP stretch (how far price is from “fair”).
Build a bounded score (so different markets/timeframes are comparable) and compute its percentile (PR).
Arm at extremes (high PR → short candidate; low PR → long candidate).
Only print a trigger after a micro BOS, on a closed bar, with spacing/cooldown rules.
What you see on the chart (legend)
Lines:
Teal line = Impulse AVWAP (resets on new N‑bar extreme).
Aqua line = Daily AVWAP (resets each session).
PDH/PDL/PWH/PWL = prior day/week levels (toggle on/off).
Zones:
Greenish box = latest Up FVG; Reddish box = latest Down FVG.
The shading/border changes after price trades back through it.
SFP labels:
SFP‑P = SFP at Pivot (dotted line marks that pivot’s price).
SFP‑L = SFP at Level (at PDH/PDL/PWH/PWL).
Throttle: To reduce clutter, SFPs are rate‑limited per direction.
Triggers:
Triangle up = long trigger after BOS; triangle down = short trigger after BOS.
Optional badge shows direction and PR at the moment of trigger.
Optional Trigger Zone is an ATR‑sized box around the trigger bar’s close (for visualization only).
Background:
Light green/red shading = a long/short setup is “armed” (not a trigger).
Dashboard (Mini/Pro) — what each item means
PR: Percentile of the internal score (0..100). Near 0 = bullish extreme, near 100 = bearish extreme.
Gauge: Text bar that mirrors PR.
State: Idle, Armed Long (with a countdown), or Armed Short.
Cooldown: Bars remaining before a new setup can arm after a trigger.
Bars Since / Last Px: How long since last trigger and its price.
FVG: Whether price is in the latest Up/Down FVG.
Imp/Day VWAP Dist, PD Dist(ATR): Distance from those references in ATR units.
ATR% (Gate), Trend(HTF): Status of optional regime filters (volatility/trend).
How to use it (step‑by‑step)
Keep the Safety toggles ON (default): triggers/visuals on bar‑close, optional confirmed HTF for trend slope.
Choose timeframe:
Intraday (5m–1h) or Swing (1h–4h). On very fast/thin charts, enable Performance mode and raise spacing/cooldown.
Watch the dashboard:
When PR reaches an extreme and an SFP context is present, the background shades (armed).
Wait for the trigger triangle:
It prints only after a micro BOS on a closed bar and after spacing/cooldown checks.
Use the Trigger Zone box as a visual reference only:
This script never tells you to buy/sell. Apply your own plan for entry, stop, and sizing.
Example:
Bullish: Sweep under PDL (SFP‑L) and reclaim; PR in lower tail arms long; BOS up confirms → long trigger on bar close (ATR-sized trigger zone shown).
Bearish: Sweep above PDH/pivot (SFP‑L/P) and reject; PR in upper tail arms short; BOS down confirms → short trigger on bar close (ATR-sized trigger zone shown).
Settings guide (with “when to adjust”)
Safety & Stability (defaults ON)
Confirm triggers at bar close, Draw visuals at bar close: Keep ON for clean, stable prints.
Use confirmed HTF values: Applies to HTF trend slope only; keeps it from changing until the HTF bar closes.
Performance mode: Turn ON if your chart is busy or laggy.
Core & Context
ATR Length: Bigger = smoother distances; smaller = more reactive.
Impulse AVWAP Anchor: Larger = fewer resets; smaller = resets more often.
Show Daily AVWAP: ON if you want session context.
Use last FVG in logic: ON to include FVG context in arming/score.
Show PDH/PDL/PWH/PWL: ON to see prior day/week levels that often attract sweeps.
Liquidity & Microstructure
Pivot Left/Right: Higher values = stronger/rarer pivots.
Min Wick Ratio (0..1): Higher = only more pronounced SFP wicks qualify.
BOS length: Larger = stricter BOS; smaller = quicker confirmations.
Signal persistence: Keeps SFP context alive for a few bars to avoid flicker.
Signal Gating
Percent‑Rank Lookback: Larger = more stable extremes; smaller = more reactive extremes.
Arm thresholds (qHi/qLo): Move closer to 0.5 to see more arms; move toward 0/1 to see fewer arms.
TTL, Cooldown, Min bars and Min ATR distance: Space out triggers so you’re not reacting to minor noise.
Regime Filters (optional)
ATR percentile gate: Only allow triggers when volatility is at/above a set percentile.
HTF trend gate: Only allow longs when the HTF slope is up (and shorts when it’s down), above a minimum slope.
Visuals & UX
Only show “important” SFPs: Filters pivot SFPs by Volume Z and |Impulse stretch|.
Trigger badges/history and Max badge count: Control label clutter.
Compact labels: Toggle SFP‑P/L vs full names.
Dashboard mode and position; Dark theme.
Reading PR (the built‑in “oscillator”)
PR ~ 0–10: Potential bullish extreme (long side can arm).
PR ~ 90–100: Potential bearish extreme (short side can arm).
Important: “Armed” ≠ “Enter.” A trigger still needs a micro BOS on a closed bar and spacing/cooldown to pass.
Repainting, confirmations, and HTF notes
By default, prints wait for the bar to close; this reduces repaint‑like effects.
Pivot SFPs only appear after the pivot confirms (after the chosen “right” bars).
PD/W levels come from the prior completed candles and do not change intraday.
If you enable confirmed HTF values, the HTF slope will not change until its higher‑timeframe bar completes (safer but slightly delayed).
Performance tips
If labels/zones clutter or the chart lags:
Turn ON Performance mode.
Hide FVG or the Trigger Zone.
Reduce badge history or turn badge history off.
If price scaling looks compressed:
Keep optional “score”/“PR” plots OFF (they overlay price and can affect scaling).
Alerts (neutral)
Structural Liquidity: LONG TRIGGER
Structural Liquidity: SHORT TRIGGER
These fire when a trigger condition is met on a confirmed bar (with defaults).
Limitations and risk
Not every sweep/extreme reverses; false triggers occur, especially on thin markets and low timeframes.
This indicator does not provide entries, exits, or position sizing—use your own plan and risk control.
Educational/informational only; no financial advice.
License and credits
© BullByte - MPL 2.0. Open‑source for learning and research.
Built from repeated observations of how liquidity runs, imbalance (FVG), and distance from “fair” (AVWAPs) combine, and how a small BOS often marks the moment structure actually shifts.

AVWAP (ATR-Weighted VWAP) IndicatorAVWAP (Average True Range Weighted Average Price), you typically combine two core indicators:
1. VWAP (Volume Weighted Average Price)
This is the base indicator that calculates the average price weighted by volume over a session or specified period.
VWAP serves as the core reference price level around which volatility adjustments are made for AVWAP.
2. ATR (Average True Range)
ATR measures market volatility, representing the average price range over a set period.
ATR is used to create volatility bands or buffers around the VWAP, adjusting levels to reflect prevailing market volatility.
How These Indicators Work Together for AVWAP:
Use VWAP to establish your average price line weighted by volume.
Calculate ATR to understand the average price movement range.
Apply ATR as multipliers to VWAP to create upper and lower volatility-adjusted bands (e.g., VWAP ± 1 × ATR), which form the AVWAP bands.
These bands help identify volatility-aware support/resistance and stop-loss placement zones.
So to make things easier I have built a custom AVWAP indicator to be used
How to use my custom indicator:
The central blue line is the VWAP.
The red and green bands above and below VWAP are AVWAP bands set at VWAP ± 1.5 × ATR by default.
Adjust the ATR length and multiplier inputs to suit the timeframe and volatility preferences.
Use the bands as dynamic support/resistance and for setting stop loss zones based on volatility.

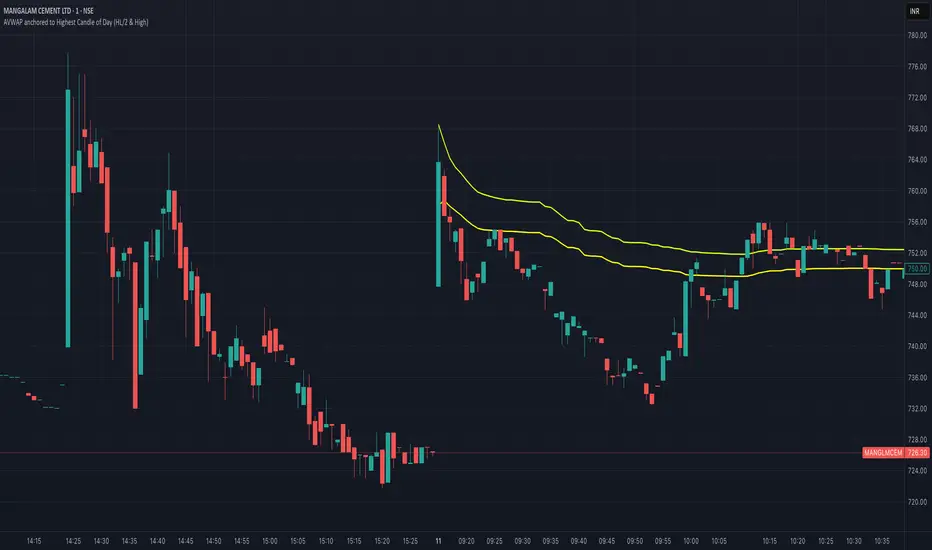
AVWAP from day's highThis indicator will automatically plot AVWAP from day's high candle.
formual will be HL/2 and H
The Great Anchors: Dual AVWAP Powered by RSI
The Great Anchors
*Dual Anchored Volume Weighted Average Price Powered by RSI*
---
📌 Overview
The Great Anchors is a dual AVWAP-based indicator that resets dynamically using RSI extremes — either from the current asset or a master symbol (e.g., BTCUSDT). It identifies meaningful shifts in price structure and momentum using these "anchored" levels.
It’s designed to help traders spot trend continuations, momentum inflection points, and entry signals aligned with overbought/oversold conditions — but only when the market confirms through volume-weighted price direction.
---
🛠 Core Logic
• AVWAP 1 (favwap): Anchored when RSI reaches overbought levels (top anchor)
• AVWAP 2 (savwap): Anchored when RSI reaches oversold levels (bottom anchor)
• AVWAPs are recalculated each time a new OB/OS condition is triggered — acting like "fresh anchors" at key market turning points.
---
⚙️ Key Features
🔁 Auto or Manual RSI Thresholds
→ Automatically determines dynamic RSI OB/OS levels based on past peaks and troughs, or lets you set fixed levels.
🧠 Master Symbol Control
→ Use the RSI of a separate asset (like BTCUSDT, ETHUSDT, SOLUSDT, BNBUSDT, SUPRAUSDT) or indices (like TOTAL, TOTAL2, BFR) to control resets — ideal for tracking how BTC/major coins impacts altcoins/others.
🔍 Trend-Filtering Signal Logic
→ Signals are filtered for less noise and are triggered when:
- Both AVWAPs are rising (bullish) or falling (bearish)
- Price action confirms the structure
🎯 Visual Markers & Alerts
→ "💥" for bullish signals and "🔥" for bearish ones. Alerts included for automation or push notifications.
---
🎯 How to Use It
1. Add the indicator to your chart.
2. Choose whether to use RSI from the current symbol or a master symbol (e.g., BTC).
3. Select auto-adjusted or manual OB/OS levels.
4. Watch for:
- AVWAP(s) making a significant change (at this point it's one of the AVWAPs resetting)
- Check if price flip it upwards or downwards
- If price goes above both AVWAPs thats a likely bullish trend
- If price can't go above both AVWAPs up and fall bellow both that's a likely bearish trend
- Price retesting upper AVWAP and bounce
- likely bullish continuation
- Price retesting lower AVWAP and dip
- likely bearish continuation
- Signal icons on chart ("💥 - Bullish" or "🔥- Bearish")
Best suited for:
• Swing traders
• Momentum traders
• Traders timing altcoin entries using BTC/Major asset's RSI
---
🔔 Signal Explanation
💥 Bullish Signal =
• Both AVWAPs rising
• Higher lows in price structure
• Bullish candle close
• Triggered from overbought RSI reset
🔥 Bearish Signal =
• Both AVWAPs falling
• Lower highs in price structure
• Bearish candle close
• Triggered from oversold RSI reset
Signals reset by opposite signals to prevent noise or overfitting.
---
⚠️ Tips & Notes
• Use AVWAPs as dynamic support/resistance, even without signal triggers
• Pair with volume or divergence tools for stronger confirmation
---
🧩 Credits & Philosophy
This tool is built with a simple philosophy:
"Anchor your trades to meaningful moments in price — not arbitrary time."
The dual AVWAP concept helps you see how price reacts after momentum peaks, giving you a cleaner bias and more precise trade setups.
---

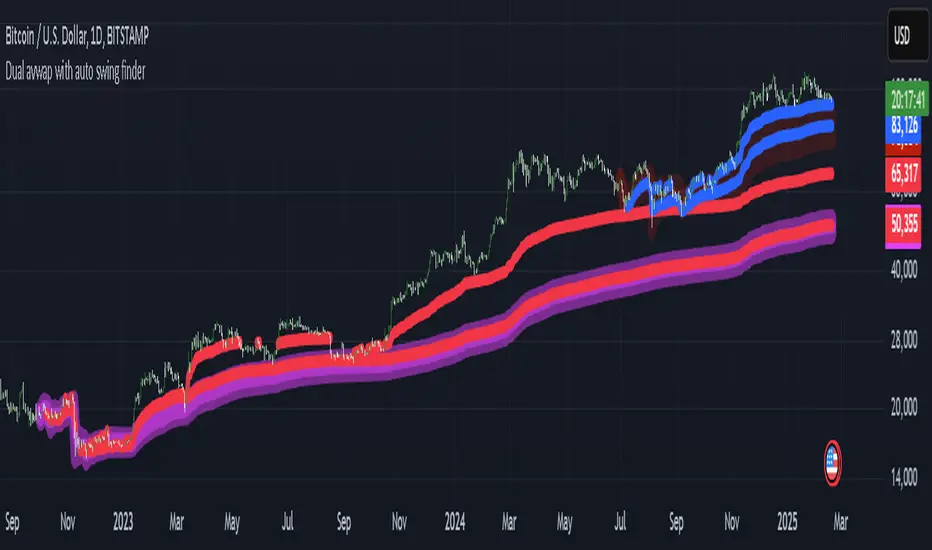
My auto dual avwap with Auto swing low/pivot low finderWelcome to My Auto Dual AVWAP with Auto Swing Low/Pivot Low Finder – an open-source TradingView indicator designed to enhance your technical analysis toolbox. This indicator is published under the Mozilla Public License 2.0 and is available for anyone to study, modify, and distribute.
Key Features
Auto Pivot/Swing Low Finder:
In addition to VWAP lines, the indicator incorporates an automatic detection mechanism for swing lows/pivot lows. This feature assists in identifying potential support areas and price reversals, further enhancing your trading strategy.
Dual VWAP Calculation with high/low range:
The indicator calculates two separate volume-weighted average price (VWAP) lines based on different price inputs (low and high prices) and defined time sessions. This allows traders to gain a more nuanced view of market activity during specific trading periods.
Customizable Time Sessions:
You can specify distinct start and end times for each VWAP calculation session. This flexibility helps you align the indicator with your preferred trading hours or market sessions, making it adaptable to various time zones and trading styles.
Easy to Customize:
With clear code structure and detailed comments, the script is designed to be accessible even for traders who want to customize or extend its functionality. Whether you're a seasoned coder or just starting out, the code is written with transparency in mind.
How It Works
Session Initialization:
The script sets up two distinct time sessions using user-defined start and end times. For each session, it detects the beginning of the trading period to reset cumulative values.
Cumulative Calculations:
During each session, the indicator accumulates the product of price and volume as well as the total volume. The VWAP is then computed as the ratio of these cumulative values.
Dual Data Sources:
Two separate data inputs (using low and high prices) are used to calculate two VWAP lines. This dual approach provides a broader perspective on market trends and can help in identifying dynamic support and resistance levels.
Visualization:
The calculated VWAP lines are plotted directly on your chart with distinct colors and thickness settings for easy visualization. This makes it simple to interpret the data at a glance.
Why Use This Indicator?
Whether you are a day trader, swing trader, or simply looking to refine your market analysis, My Auto Dual AVWAP with Auto Swing Low/Pivot Low Finder offers a robust set of features that can help you identify key price levels and improve your decision-making process. Its open-source nature invites collaboration and customization, ensuring that you can tailor it to fit your unique trading style.
Feel free to explore, modify, and share this indicator. Happy trading!
DIN: Dynamic Trend NavigatorDIN: Dynamic Trend Navigator
Overview
The Dynamic Trend Navigator script is designed to help traders identify and capitalize on market trends using a combination of Weighted Moving Averages (WMA), Volume Weighted Average Price (VWAP), and Anchored VWAP (AVWAP). The script provides customizable settings and flexible alerts for various crossover conditions, enhancing its utility for different trading strategies.
Key Features
- **1st and 2nd WMA**: Allows users to set and visualize two Weighted Moving Averages. These can be customized to any period, providing flexibility in trend identification.
- **VWAP and AVWAP**: Incorporates both VWAP and AVWAP, offering insights into price levels adjusted by volume.
- **ATR and ADX Indicators**: Includes the Average True Range (ATR) and Average Directional Index (ADX) to help assess market volatility and trend strength.
- **Flexible Alerts**: Configurable buy and sell alerts for any crossover condition, making it versatile for various trading strategies.
How to Use the Script
1. **Set the WMA Periods**: Customize the periods for the 1st and 2nd WMAs to suit your trading strategy.
2. **Enable VWAP and AVWAP**: Choose whether to include VWAP and AVWAP in your analysis by enabling the respective settings.
3. **Configure Alerts**: Set up alerts for the desired crossover conditions (WMA, VWAP, AVWAP) to receive notifications for potential trading opportunities.
4. **Monitor Signals**: Watch for buy and sell signals indicated by triangle shapes on the chart, which appear at the selected crossover points.
When to Use
- **Best Time to Use**: The script is most effective in trending markets where price movements are well-defined. It helps traders stay on the right side of the trend and avoid false signals during periods of low volatility.
- **When Not to Use**: Avoid using the script in choppy or sideways markets where price action lacks direction. The script may generate false signals in such conditions, leading to potential losses.
Benefits of VWAP and AVWAP
- **VWAP**: The Volume Weighted Average Price provides a price benchmark that adjusts for volume, helping traders identify fair value levels. It is particularly useful for intraday trading and gauging market sentiment.
- **AVWAP**: The Anchored VWAP allows traders to set a starting point for VWAP calculations, providing flexibility in analyzing price levels over specific periods or events. This helps in identifying key support and resistance levels based on volume.
Unique Aspects
- **Customizability**: The script offers extensive customization options for WMA periods, VWAP, AVWAP, and alert conditions, making it adaptable to various trading strategies.
- **Combining Indicators**: By integrating WMAs, VWAP, AVWAP, ATR, and ADX, the script provides a comprehensive view of market conditions, enhancing decision-making.
- **Real-Time Alerts**: The flexible alert system ensures traders receive timely notifications for potential trade setups, improving responsiveness to market changes.
Examples
- **Example 1**: A trader sets the 1st WMA to 8 and the 2nd WMA to 100, enabling the VWAP. When the 1st WMA crosses above the 2nd WMA or VWAP, a buy signal is triggered, indicating a potential long entry.
- **Example 2**: A trader sets the AVWAP to start 30 bars ago and monitors for crossovers with the 1st WMA. When the 1st WMA crosses below the AVWAP, a sell signal is triggered, suggesting a potential short entry.
Final Notes
The Dynamic Trend Navigator script is a powerful tool for traders looking to enhance their market analysis and trading decisions. Its unique combination of customizable indicators and flexible alert system sets it apart from other scripts, making it a valuable addition to any trader's toolkit.
Disclaimer: Never any financial advice. Just ThisGirl loving experimenting with indicators to help myself, as well as others.

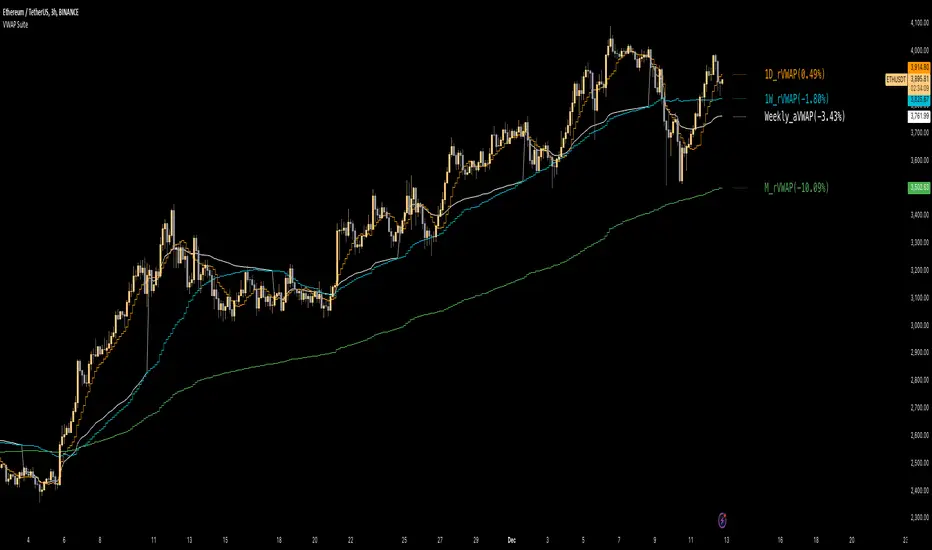
Multiple VWAP SuiteThe VWAP Suite is a tool I created to streamline VWAP analysis for traders. By integrating Anchored and Rolling VWAPs into a single indicator, it eliminates the need for multiple separate tools, keeping charts clean and organized without sacrificing flexibility or functionality. The goal was to simplify VWAP management by combining six different configurations into one intuitive and highly customizable indicator. It’s designed for traders who utilize VWAP-based strategies for trend analysis, support/resistance identification, or mean-reversion setups.
Features:
1. Integrated Anchored VWAPs:
Includes three customizable Anchored VWAPs, each tied to a specific timeframe such as Session, Weekly, Monthly, or even Decade.
Standard deviation bands can provide visual cues for dynamic support/resistance or volatility ranges.
Each VWAP can be toggled on/off and customized for color and band appearance.
2. Rolling VWAPs:
Includes three independently configurable Rolling VWAPs for dynamic timeframe analysis (Daily, Weekly, Monthly).
Rolling VWAPs feature optional deviation bands to gauge price action within a defined volatility range.
Smooth visualization using stepline plots for better trend identification.
3. Labeling System:
Labels show the VWAP levels and percentage deviations from the current price for easy reference.
Adjustable text size for improved chart readability.
4. Customizability:
Fully adjustable input sources for both Anchored and Rolling VWAPs, allowing you to tailor the indicator to your strategy.
Ability to enable or disable specific VWAPs, deviation bands, or labels depending on your focus.
Why Did I Make This?
Managing multiple VWAP indicators often leads to cluttered charts and inefficient workflows. I created the VWAP Suite to address this issue, combining Anchored and Rolling VWAPs into a single, powerful tool. Whether you’re a scalper, swing trader, or long-term trend follower, this script keeps everything you need in one place, simplifying your workflow and enhancing your ability to make informed trading decisions.
Feel free to comment any suggestions or questions! Enjoy!
Three Anchored Moving Averages (VWAP / SMA / EMA)
This indicator allows users to anchor three types of moving averages (Simple Moving Average (SMA), Exponential Moving Average (EMA), and Volume Weighted Average Price (VWAP)) to specific points in time (anchor points)
Key Features:
Select from three Moving Average Types:
Simple Moving Average (SMA): Averages the closing prices over a specified period.
Exponential Moving Average (EMA): Gives more weight to recent prices, making it more responsive to new information.
Volume Weighted Average Price (VWAP): Averages the price weighted by volume, useful for understanding the average price at which the asset has traded over a period.
Up to Three Anchor Points:
Users can set up to three different anchor points to calculate the moving averages from specific dates and times. This allows for analysis of price action starting from significant points or specific events. For example, you can anchor to the low and high of a move to identify key levels or to points where the price takes off from a previous anchored MA.
Customisable Sentiment Options:
Each anchor point can be associated with a sentiment input (Auto, Bull, Bear, None), which influences if the MAs are displayed as lines or zones/bands:
Auto: Automatically determines the sentiment based on whether anchor points are on pivot highs and lows. If anchored to a pivot high, the system will assume a bearish sentiment and display a red band or zone between the MA OHLC4 and High. Anchoring to a pivot low will display a green band (OHLC4 - Low).
Bull: Forces a bullish sentiment (Green Band - OHLC4 to Low)
Bear: Forces a bearish sentiment (Red Band - OHLC4 to High)
None: Ignores sentiment and displays a single line (OHLC4)
Chart Matching:
The indicator includes an option to display the moving averages only if the chart symbol matches a specified ticker. This feature ensures that the indicator is relevant to the specific asset being analysed.
How to Use the Indicator:
1. Set Anchor Points: When added to your chart, select three anchor points by point and click. If you only wish to anchor to a single point, click on that point three times and disable the other two in settings once the indicator is applied.
2. Select Moving Average Type: Choose between SMA, EMA, or VWAP using the dropdown menu. EMAs are the most responsive.
3. Enable/Disable Anchor Points: Use the checkboxes to enable or disable each anchor point.
4. Select Sentiment Type: Choose between Auto, Bull, Bear, or None.
5. Chart Matching: Optionally, specify a chart symbol to restrict the indicator's display to that particular asset.
6. Interpret the Plots: The indicator plots the high, mid, and low values of the selected moving average type from each anchor point. The fills between these plots help identify potential support and resistance zones. These should be used as points of interest for pullback reversals or potential continuation if the price breaks through.
Practical Applications:
Trend Analysis: Identify the overall trend direction from specific historical points.
Support and Resistance: Determine key dynamic support and resistance levels based on anchored moving averages.
Event-Based Analysis: Anchor the moving averages to significant events (e.g., earnings releases, economic data) to study their impact on price trends.
Multi Timeframe Analysis: Higher Timeframe Anchors can be used to identify longer term trend analysis. Switching to a lower timeframe for execution triggers at these points wont distort the MA levels as they are anchored to a specific point in time
Intraday or Swing Trading: trend analysis using anchor points can be used for any style of trading (Intraday / Swing / Invest). Use anchored levels as points of interest and wait for hints in price action to try and catch the next move.

Alpha Edge Pro - Intraday [LevelUp]Alpha Edge Pro™ is a collection of tools for intraday analysis built in collaboration with Brian Shannon, CMT, creator of the anchored VWAP (AVWAP) and the author of two best-selling books on technical analysis.
🔹—— Key Features ——🔹
▪ AVWAP auto-anchored on 1-day, 2-day, week-to-date and month-to-date.
▪ AVWAP works with any global exchange, respecting trading days, hours & holidays.
▪ AVWAP and the TradingView Replay are excellent for historical analysis.
▪ 5-day moving average auto-calculated based on the chart timeframe.
▪ 5-day moving average auto-adjusts the minutes in the trading day for crypto and futures.
▪ View up to two daily moving averages on intraday charts.
▪ Pivot points (floor trader pivots) highlight support/resistance levels (R1/S1, R2/S2, etc).
▪ Highlight current and prior day highs/lows as these are areas of potential support and resistance.
▪ Comprehensive stats tables for AVWAP, price highs/low, pivots and ATR (average true range).
▪ Custom alerts for AVWAP, pivot points and 5-day moving average.
🔹—— AVWAP ——🔹
The Volume Weighted Average Price (VWAP) is the cumulative average price a stock traded for one day. AVWAP is the same as the VWAP with the exception that the start point (the anchor) is configurable based on a trader's preference, not simply the start of the trading day. From the anchor point forward, on each bar, AVWAP is calculated based on the cumulative volume and average price.
The AVWAP shows the relationship between price and volume over any time period based on the anchor point. At a glance we can see who is in control, the buyers (bulls) or the sellers (bears).
AVWAP Concepts
▪ When a stock is above an advancing AVWAP, buyers are in control for that timeframe, as the average price is increasing.
▪ When prices are below a declining AVWAP, sellers are in control for that timeframe, as the average price is declining.
▪ When prices oscillate above and below the AVWAP it indicates indecision for that timeframe.
What's unique about AVWAP in this indicator is that it is auto-anchored on 1-day, 2-day, week-to-date and month-to-date. In addition, Alpha Edge supports any exchange around the globe, respecting trading days, hours and holidays. You can also use the TradingView Replay feature with this indicator, a powerful tool for historical and post-mortem analysis.
▪ 1-Day, 2-Day and Week-To-Date
▪ Saudi Exchange (Tadāwul)
Trading Days: Sunday to Thursday, 10:00am to 3:00pm.
Auto-Anchor: Detects start of trading week.
▪ London Stock Exchange (LSE)
Trading days: Monday to Friday, 8:00am to 4:30pm.
Auto-Anchor: Detects U.K. bank holiday.
▪ Review Historical Data and Past Trades
🔹—— 5-Day Moving Average ——🔹
A common trend following theme is to look for stocks where the trend of the 50-SMA is upward. We can view intraday charts to see if the price action is setting up for a low risk trade by verifying that the shorter timeframe aligns with the longer. As we look at various timeframes, we need to make sure the moving average is consistent across the timeframes, which is done via the 5-day moving average as explained by Brian Shannon:
"If you want to see a five DAY moving average on a chart with 10 minute candles, you have to consider how many 10 minute periods of trading there are in the trading day. The US equities markets are open from 9:30- 4:00 each day, which is 6.5 hours per trading day. In each hour of trading, there are 6-10 minute periods, so during the regular session for equities, the market is open for 390 minutes or 39-10 minute periods per day. If we are to get a five day moving average, we would take the 39-10 minute periods the market is open each day and then multiply that by five days. 39 x 5 = 195. So a 5 DAY moving average is represented by a 195 PERIOD moving average when looking at a 10 minute timeframe."
As trend followers, our goal is to find stocks where the 5-day moving average is trending up.
In Alpha Edge, the default value for the minutes per day is 390, the number of minutes in one trading day in the U.S. This value can be changed to match any exchange. For example, if trading the India National Stock Exchange (NSE), which is open from 9:15am to 3:30pm, the minutes per day could be set to 375.
Minutes per day are auto-adjusted for crypto and futures:
▪ Crypto: 1440 minutes per day based on 24 hrs per day.
▪ Futures: 1380 minutes per day based on 23 hrs per day.
▪ 5-Day Moving Average Trending Up
Important Note: Based on the math as described above using the minutes in the trading day, there will be chart timeframes where the 5-day moving average is not shown. If you have the 5-day moving average enabled from within the indicator Settings, yet the 5-day line is not visible, try changing to another timeframe.
🔹—— Vertical Start Line - Anticipating Direction ——🔹
By placing a vertical line on the bar where the 5-day moving average begins, one can anticipate the trend by viewing the bars that will fall off the moving average as new bars are added. This can be helpful to gauge if the trend will continue in its current trajectory or begin to move in a different direction.
▪ 5-Day Vertical Line
🔹—— Intraday and Daily Moving Averages ——🔹
In addition to custom moving averages based on intraday price action, there are two configurable daily moving averages. Viewing daily moving averages on intraday charts can be helpful as they often act as areas of support/resistance.
▪ Daily 10-EMA on Intraday Chart - Acting as Support
▪ Daily 50-SMA on Intraday Chart - Acting as Resistance
🔹—— Current and Prior Day Highs & Lows ——🔹
Linda Raschke, a legendary trader featured in Jack Schwager’s book, New Market Wizards, on the importance of tracking the previous day's price range:
"If I could trade with only one indicator, it would be with the previous day’s high and low. The reason why they are so important is this is where support and resistance come in and they are also the most visible chart points for all market participants. They are very strong psychological markers.”
With Alpha Edge, there are clear visual indicators, with optional price data, marking both current and prior day high/low values. This makes it easy to view potential areas of support/resistance. These areas can also be considered for entering, exiting or profit taking.
▪ Prior Day & Current Day Highs/Lows
🔹—— Pivot Points ——🔹
Floor trader pivot points are price levels that may act as areas of support or resistance. These pivot points were initially created by floor traders operating within the trading pits of the equity futures exchange in Chicago, Illinois.
The calculations for determining these pivots are based on the prior day's high, low and close:
Pivot (P) = (prevHigh + prevLow + prevClose) / 3
Resistance R1 = (2 * P) - prevLow
Support S1 = (2 * P) - prevHigh
Resistance R2 = P + (prevHigh - prevLow)
Support S2 = P - (prevHigh - prevLow)
Resistance R3 = prevHigh + (2 * (pivot - prevLow))
Support S3 = prevLow - (2 * (prevHigh - pivot))
▪ R1 Acting as Resistance
▪ S1 Acting as Support
🔹—— Stats Table ——🔹
With the stats table, at a glance you can view AVWAP values, current and prior days highs/lows, pivot points as well as the ATR (average true range). Each section in the table can be toggled on/off.
▪ Stats Table
🔹—— Custom Alerts ——🔹
Alpha Edge indicator supports the following custom alerts:
▪ 1-day & 2-day AVWAP cross.
▪ WTD/MTD AVWAP cross.
▪ R1/R2 and S1/S2 cross.
▪ 5-day moving average cross.
🔹—— Best Practices ——🔹
▪ Look for confirmation of an uptrend on multiple timeframes.
▪ Use multiple signals and/or patterns for confirmation of the trend.
▪ Avoid chasing extended stocks.
▪ Always define risk before entering a trade — know where you’ll exit.
▪ Size positions based on volatility and conviction, not emotion.
▪ Be patient — trends take time to develop.
付費腳本

Multi-Time AVWAP_BEARConcept
Collaboration Highlight:
This was a collaboration with @Chart_School and @KioseffTrading Thank you to both, along with Ricardo Santos for his awesome library we used.
Overview
See how you view different time frame charts with one indicator and little to no adjustment.
Innovation:
The concept of using Anchored VWAP (AVWAP) with time events is a powerful technique in trading and technical analysis. Anchored VWAP differs from the traditional Volume Weighted Average Price (VWAP) by allowing traders to select a specific starting point or "anchor," from which the VWAP calculation begins. This approach is particularly useful for assessing price movements in relation to significant market events or specific periods of interest.
Utility and Flexibility:
Explaining the flexibility in turning on and off different time slices without much adjustment showcases a user-friendly design.
Key Uses and Benefits
Comparative Performance:
Anchoring the VWAP at the start of different time frames (e.g., weekly, monthly, quarterly) enables traders to compare the current price performance against previous periods. This comparison can highlight trends or shifts in trading momentum relative to past activity.
Support and Resistance Levels:
AVWAP lines can act as dynamic support and resistance levels. When anchored to significant time events, these levels gain additional relevance as they reflect the market's valuation of an asset since a notable point in time. Traders often watch for price interactions with these levels to make informed trading decisions.
Risk Management:
Anchored VWAP can serve as a benchmark for setting stop-loss orders or profit targets. By considering the price's relation to the AVWAP of a specific period or after a key event, traders can define exit points that are aligned with market-generated information.
Trend Confirmation: The direction and stability of the price relative to an anchored VWAP can indicate the strength of a trend. If the price consistently remains above an AVWAP anchored at a bullish event (or below for a bearish event), it may confirm the trend's continuation.
Further Reading
Educational Resource:
Becuase we are using Volume with a relation to price AVWAP is very powerful to show data that cannot be eye balled on its own. Brian Shannon's book "Maximum Trading Gains With Anchored VWAP - The Perfect Combination of Price, Time & Volume", is an excellent guide to best practices on how to use AVWAP to your advatage while trading. His book goes into depth about the best way to use this indicator to its fullest potencial.
Tips for Using This Indicator
Weekly / Monthly / Quarterly Settings:
All the settings for the lower timeframe charts are similar. Here is an example of seeing a Weekly AVWAP for 6 weeks, showing:
1. The start of the 6-week AVWAP is using a High Low Close source for the first candle of the 6 weeks.
2. The lines are colored "Red" for the AVWAPs.
3. The line thickness is "1".
Yearly Settings
Simlair to the other settings with the Yearly we give you a couple more options along with 3 years to toggle on and off. The idea was to allow the user to see which AVWAP most effected by price and quickly toggle them on and off to unclutter their chart.
Watch for how and if the labels over lap and choose the one you feel is most in play. In Shannon's Book he talks about "Hand off's" and "Pinches". These concepts are easy to spot with being able to see all the Major Time Events, then simply toggle off the one you dont need.
A great benefit to how we coded this script you can buzz through a watch list without having to re-adjust the Anchor points. This will save you time if following a basket of symbols and show coorlations in the overall market.
Secret Feature
When looking at these becuase the user doesn't need to hand plot the anchor points and we are fouced on major time slices, I encourge you to use the Trading View "Bar Replay" Feature. You think that you are missing a high or low AVWAP but what is happening is the indicator is re-plotting a level that is super hard to see, then you will see the hand-offs like Shannon discusses in his book. This blew me away while we were discussing it post development.
Conclusion
There are so many uses of how to use VWAP and therories on its best practice. We are only using "TIME EVENTS". For more ways to use AVWAP, I would encourge you to also handplot them with Trading View's new "Anchored VWAP", as seen in the standard toolbar.
Using your ideas along with this indicator i think its a powerful combination.
Also Check Out: allanster's - Anchored VWAP Pinch & Handoff, Intervals, and Signals
He has a great AVWAP script that incorporates many AVWAP ideas.

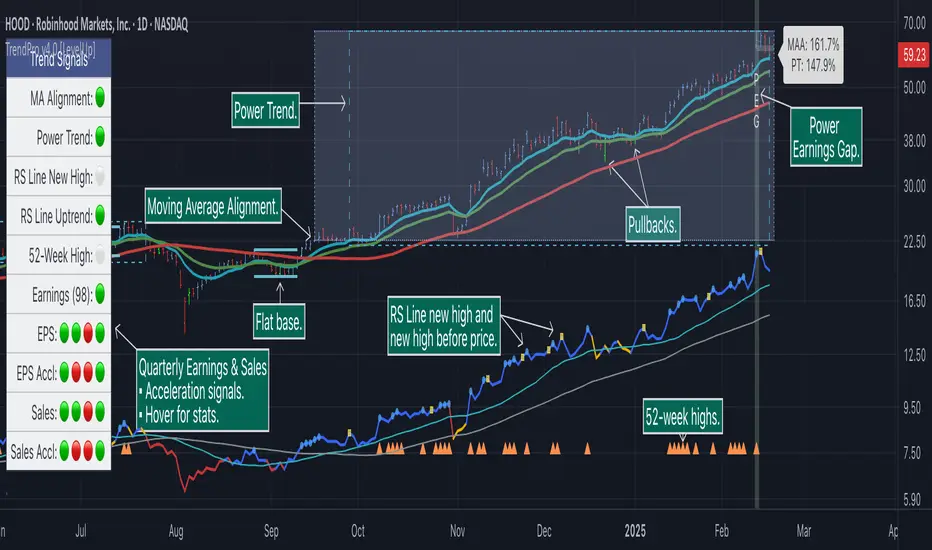
Trend Alignment Pro [LevelUp]Trend Alignment Pro™ is designed for traders who focus on trading with the trend. This indicator automates key aspects of fundamental and technical analysis to identify and highlight chart patterns and signals, drawing on the proven techniques of legendary trend-following traders such as William O'Neil, Jesse Livermore, and Stan Weinstein.
The indicator name, Trend Alignment , emphasizes the importance of confirming price action, patterns, and signals across multiple timeframes. It provides both daily and weekly analysis to enable accurate and timely trend identification.
🔹—— Key Features ——🔹
Daily Timeframe
Moving Average Alignment™
▪ Highlight trends based on moving averages and price action.
▪ Specify price in relation to moving averages (e.g. close above).
▪ Specify which moving averages are required to be in an uptrend.
▪ Specify moving average stacking requirements (e.g. fast above slow).
▪ Require active Power Trend (optional).
▪ Set stop-loss and requirements to end Moving Average Alignment.
Power Trend Tools and Analysis
▪ Highlight Power Trends with box or symbols at start/end points.
▪ Auto-tracking of key metrics towards a new Power Trend.
Custom Moving Averages
▪ Specify type (EMA/SMA), length and color.
▪ View 10-week SMA on daily chart.
Stats Table
▪ Comprehensive daily price and percent change stats.
Signals Table
▪ Track important trend signals with clear visuals.
Power Earnings Gap (PEG) Detection
▪ Auto-detect and highlight Power Earnings Gaps.
▪ Customize requirements, such as gap-up percent and earnings surprise.
Weekly Timeframe
Custom Moving Averages
▪ Specify type (EMA/SMA), length and color.
Tight Weeks and Up Weeks
▪ Specify weekly and percent change requirements.
Stats Table
▪ Comprehensive weekly price and percent change stats.
Daily & Weekly Timeframes
Flat Base & Consolidation
▪ Automated detection with defaults based on the active timeframe.
Custom Relative Strength Line
▪ Specify index and lookback range.
▪ Symbols plotted on RS Line indicating new high and new high before price.
▪ Two custom moving averages for daily & weekly timeframes.
Anchored VWAP (AVWAP)
▪ Multiple anchor options: year-to-date, year-to-date low/high.
Pullbacks
▪ Set key requirements and minimum number of bars.
52-Week and All-Time Highs
▪ Bullish indicators indicating outperformance.
Marked Highs & Lows
▪ Identify potential areas of support/resistance.
🔹—— Daily Chart Examples ——🔹
Daily charts are ideal for analyzing short to intermediate term trends and spotting actionable setups as they develop.
🔹—— Weekly Chart Example ——🔹
Weekly charts are helpful for identifying longer-term trends and patterns.
🔹—— Moving Average Alignment (Daily) ——🔹
Moving Average Alignment™ (MAA) is a trend-identification tool that uses moving averages, price action and their relationships to one another to detect momentum and upward trends. MAA offers extensive customization, including the following:
▪ Moving average types (EMA/SMA) and length.
▪ Which moving averages are required to be in an uptrend.
▪ Requirements on the order of moving averages (e.g. fast above slow).
▪ Optional requirement that the stock be in a Power Trend.
▪ Set stop-loss and requirements to signal the end of the MAA.
MAA delivers clear visual confirmation of trend strength and helps identify both the start and potential end of an uptrend.
🔹—— Power Trend (Daily) ——🔹
The concept of a Power Trend was created by Mike Webster, Justin Nielsen and Charles Harris while working with William O’Neil, founder of Investor's Business Daily and creator of the CANSLIM methodology. When a Power Trend is active, there is a stronger than usual uptrend underway.
A Power Trend by definition uses a major index, such as the Nasdaq Composite (IXIC), as the data source for determining a Power Trend's state. The Trend Alignment indicator builds upon this concept by enabling the current chart symbol to be the data source for the Power Trend, thus offering traders a unique and quantifiable signal when a stock is in a strong uptrend.
What Starts A Power Trend
▪ Low is above the 21-EMA for at least 10 days.
▪ 21-EMA is above the 50-SMA for at least five days.
▪ 50-SMA is in an uptrend.
▪ Close up for the day.
What Ends A Power Trend
▪ 21-EMA crosses under 50-SMA and the close is below prior day close.
▪ Close below the 50-SMA and low is 10% below recent high.
One unique feature of the Trend Alignment indicator is that you can track the progress towards a new Power Trend beginning. See the chart below for more details.
🔹—— Power Earnings Gap (Daily) ——🔹
A Power Earnings Gap refers to a stock experiencing a significant price gap-up, on high volume, following an earnings report. This typically occurs when the stock opens at least 5-10% (or more) above the prior day's close, forming a gap-up bar on the chart that signals strong retail and/or institutional buying and the start or continuation of a major uptrend. It's a bullish pattern seen in leading growth stocks that often continue to outperform.
There are extensive customization options including required gap-up percent, minimum volume change over the average volume and preferred earnings surprise requirements.
🔹—— Relative Strength Line ▪ RS Line (Daily & Weekly) ——🔹
The Relative Strength Line (RS Line), another concept popularized by William O’Neil, is a technical indicator used in stock analysis to measure a stock's performance relative to a benchmark index, such as the S&P 500. An upward-trending RS Line indicates the stock is outperforming the market, while a downward trend shows underperformance. This helps identify potential leaders or laggards regardless of market conditions.
RS Line New High
When the RS Line reaches a new high, this signals that the stock's relative strength against the benchmark is at its highest point over the current lookback range — clear evidence of market leadership.
RS Line New High Before Price
When the RS Line hits a new high ahead of the stock's price reaching a new high, this can be a leading indicator of impending price strength, as it shows the stock gaining momentum relative to the market before that strength is reflected in its price. This signal shows early outperformance and potential market leadership, often preceding a breakout or trend continuation.
New High and New High Before Price Symbols
Easily spot RS Line new highs and new highs before price; a small circle on the RS Line indicates new highs and a small square highlights new high before price.
Highlight Breaks of Moving Averages
There are two custom moving averages of the RS Line that can be configured. Looking for breaks above or below these moving averages can be helpful to effectively manage positions, such as scaling out of a trade systematically.
🔹—— Tight Weeks and Up Weeks (Weekly) ——🔹
In William O'Neil's CANSLIM methodology, tight weekly closes and up weeks are key technical indicators used to evaluate stock chart patterns and identify potential buying opportunities. Tight and up weeks may indicate institutional accumulation and price strength.
Tight closes on a weekly timeframe refer to consecutive weeks where closing prices stay within a narrow 1-1.5% range of the prior week's close, often with declining volume. This signals buyer control and accumulation, making it a bullish indicator, particularly in patterns like three-weeks-tight after an initial breakout.
When a stock closes higher than the prior week, this signals positive momentum. Multiple up weeks often indicate sustained buying and may help to spotlight emerging leaders. Increased volume on up weeks show institutional support and increase the potential for a breakout.
🔹—— Automated Anchored VWAP ▪ AVWAP (Daily & Weekly) ——🔹
Based on the work of Brian Shannon, CMT, the anchored VWAP (AVWAP) shows the average price a stock has traded at, weighted by volume, starting from a specific point in time, the anchor. AVWAP can be helpful for trend confirmation and reversals, breakout and breakdown signals as well as risk management for placing stops.
The AVWAP works with any exchange around the globe, respecting trading days, hours and holidays. Use the AVWAP with the TradingView Replay feature for historical and post-mortem analysis.
🔹—— Marked Highs and Lows (Daily & Weekly) ——🔹
Pivot highs and pivot lows are core principles in technical analysis for identifying potential turning points, support/resistance, and trends. Shown on the chart as either price or a triangle symbol, these visual cues help to quickly spot significant price levels.
Pivots highlight historical turning points in price, serving as reliable zones for potential bounces or breakouts. They can also help determine overall market direction, for example, higher highs and higher lows in uptrends. Pivots also represent where demand overwhelms supply or vice versa.
🔹—— Price Stats and Signals Tables (Daily & Weekly) ——🔹
Comprehensive daily and weekly price stats. Daily charts also includes real-time signals to monitor the trend as well as quarterly earnings and sales data.
🔹—— Custom Alerts ——🔹
The Trend Alignment indicator supports custom alerts:
▪ Moving Average Alignment started.
▪ Moving Average Alignment ended.
▪ Power Trend started.
▪ Power Trend ended.
▪ Power Earnings Gap started.
🔹—— Best Practices ——🔹
▪ Look for confirmation of an uptrend on multiple timeframes.
▪ Use multiple signals and/or patterns for confirmation of the trend.
▪ Relative strength is key to find stocks outperforming the market.
▪ Focus on companies with earnings and sales acceleration.
▪ Avoid chasing extended stocks.
▪ Always define risk before entering a trade — know where you’ll exit.
▪ Size positions based on volatility and conviction, not emotion.
▪ Be patient — trends take time to develop.
付費腳本
Multi VWAP [MW]Introduction
The Multi VWAP tool extends the concept of using the Anchored Volume Weighted Average Price, popularized by its founder, Brian Shannon, founder of AlphaTrends, and creates automatic AVWAPS for multiple anchor points, such as for 2-day, 3-day, 4-day, 5-day, and custom date anchors as well as automagically creating month-to-date and year-to-date anchors. Currently, most standard VWAP tools allow users to place custom anchored VWAPs, but the routine of doing this for every equity being watched can become cumbersome. This tool makes that process multi-times easier. Brian Shannon is also the author of “Maximum Trading Gains With Anchored VWAP: The Perfect Combination of Price, Time, and Volume”. Available at Amazon.
Settings
Daily VWAP : A continuous line of the the daily Volume Weighted Average Price (VWAP)
Weekly VWAP : A continuous line of the weekly VWAP
2-Day AVWAP : The anchored VWAP from 2 trading days ago (holidays and weekends are excluded in this calculation)
3-Day AVWAP : The anchored VWAP from 3 trading days ago
4-Day AVWAP : The anchored VWAP from 4 trading days ago
5-Day AVWAP : The anchored VWAP from 5 trading days ago. The slope of this line and the position of the price relative to this line can be used to determine trend direction.
10-Day AVWAP : The anchored VWAP from 10 trading days ago
Month-to-Date AVWAP : The anchored VWAP from the beginning of the current month
Year-to-Date AVWAP : The anchored VWAP from the beginning of the current year
Custom Date AVWAP : Sets a date to begin an anchored VWAP starting from any time.
Use only the most recent VWAP for Week, Month, and Year: Toggles on and off the continuous weekly, monthly, and yearly VWAPs
Calculations
This indicator does not provide buy or sell signals. It is simply the VWAP calculated starting from an “anchor point”, or start time. It is the calculated by the summation of Price x Volume / Volume for the period starting at the anchor point.
How to Interpret
According to Brian Shannon, VWAP is an objective measure of what the average trader has paid for a particular equity over a given period, and is the value that large institutional investors frequently use as a trade signal. Therefore, by definition, when the price is above an AVWAP, buyers are in control for that period of time. Likewise, if the price is below the AVWAP, sellers are in control for that period of time.
Shannon also distinguishes the importance of an increasing or decreasing 5 day VWAP, which reflects the price sentiment, objectively, for roughly the last trading week, or 5 trading days. Pricing below a decreasing 5-day VWAP is considered very bearish, while pricing above an increasing 5-day VWAP is considered bullish and is recommended before considering long positions.
Additionally, a custom VWAP can be generated to coincide with important events, such as FOMC meetings, CPI reports, earnings reports, etc.
Practically speaking, price action can tend to change direction when a significant VWAP is hit, voiding buy and sell signals. Like moving averages, this indicator can show, in real-time, how a buy or sell signal should be interpreted. A significant AVWAP line is a point of interest, and can serve as strong support or resistance, because large institutions may be using those values for entries or exits. For a great analysis of how to use AVWAP, visit the AlphaTrends channel on Youtube here or you can buy Brian Shannon’s “Anchored VWAP” book on Amazon.
Other Usage Notes and Limitations
It's important for traders to be aware of the limitations of any indicator and to use them as part of a broader, well-rounded trading strategy that includes risk management, fundamental analysis, and other tools that can help with reducing false signals, determining trend direction, and providing additional confirmation for a trade decision. Diversifying strategies and not relying solely on one type of indicator or analysis can help mitigate some of these risks.
Additionally, the indicator may take a little longer to load than usual. On the rare occasion where it fails to load, you may need to remove the indicator and add it back to your chart. Also, if you do encounter this problem, avoid redrawing your chart while the indicator is being added to the screen.
Acknowledgements
This script uses the MarketHolidays library by @Protervus. Also, for debugging, the JavaScript-style Debug Console by @algotraderdev and the TimeFormattingLibrary by @twingall were invaluable. And, of course, without Brian Shannon's books, videos, and interviews, this indicator would would not be possible.

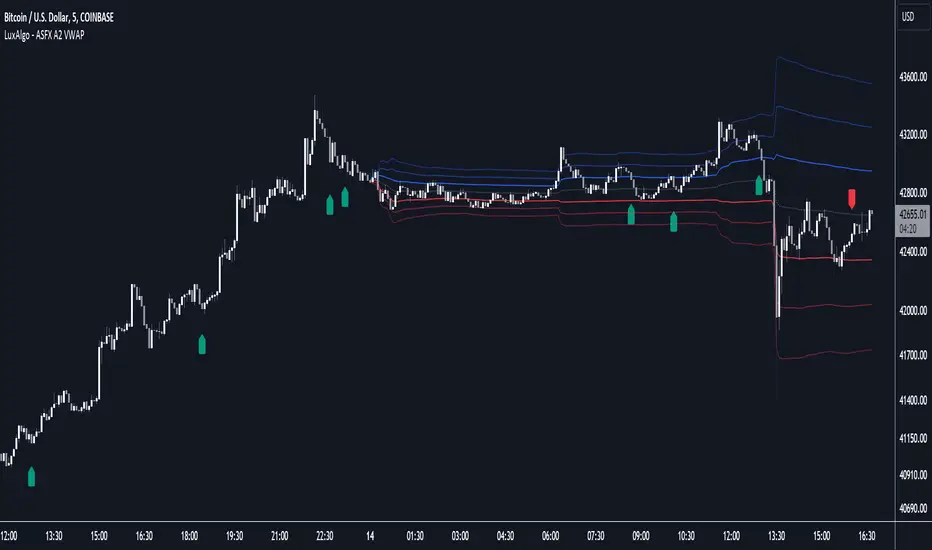
ASFX A2 VWAP [LuxAlgo]The ASFX A2 VWAP is a toolkit based on A2 signals and daily anchored VWAP bands, a methodology proposed by trader & educator Austin Silver (ASFX).
Pre-built alerts are also included.
🔶 USAGE
The A2 strategy involves identifying potential trades using specific signals and confirmation from the 21 EMA (Exponential Moving Average). Below we can see a bullish A2 signal triggering as price is closing below the 21 EMA with less than half of the candles closing price.
Within the settings, we have enabled the stop loss setting to assist us with trade setups generated from A2 signals.
Users can enable multiple layers of StDev multipliers on the AAVWAP to find areas of support & resistance alongside the A2 signals & other features included.
🔶 DETAILS
If 'Filter Based On VWAP' is enabled, bullish signals will only be displayed if located above the anchored VWAP, while bearish signals will only be displayed when located under the VWAP. The image above illustrates this, with transparent signals showing the ones that are supposed to be filtered.
The Stop Loss is based on the most recent A2 signal, and is constructed from the 1.618 Fibonacci retracement using the following points depending on the A2 signal:
Bullish: From candle low to the current daily maximum.
Bearish: From candle high to current daily minimum.
🔶 SETTINGS
🔹 A2
Validation EMA Period : Period of the EMA used to validate triggered A2 signals.
Trigger EMA Period : Period of the EMA used to trigger A2 signals.
Filter Based On VWAP : Filter A2 signals based on their location relative to the VWAP output.
🔹 VWAP
source : Input data for the anchored VWAP calculation
Show Central AVWAP : Display central VWAP on the chart
StDev Multiplier 1 : Display first VWAP bands, using a StDev multiplier of 1 by default.
StDev Multiplier 2 : Display second VWAP bands, using a StDev multiplier of 2 by default.
StDev Multiplier 3 : Display third VWAP bands, using a StDev multiplier of 3 by default.
🔹 Stop Loss
Stop Loss : Display stop loss based on the most recent A2 signal
Quantum VWAP ProThe VWAP indicator is another of our suite of volume indicators and one which was first referred to in 1988 when it appeared in an article entitled “The Total Cost Of Transactions On The NYSE” in the March edition of the Journal Of Finance from that year, which went on to explain its importance, particularly from an institutional perspective, which underpins its significance in appreciating the power and importance of this indicator.
In many ways, it is akin to the volume price analysis methodology itself, as we are merely attempting to follow the footprints in the sand left by their passage and described by volume. The same is true here, but in this case, we are following the institutions in much the same way.
Originally, the VWAP indicator was developed as a benchmark to measure whether an institutional customer received a fair execution of their order by the broker buying and selling on their behalf. The difference between the reported price and the VWAP gave the customer a benchmark against which to judge whether they had received a fair price or not. A portfolio manager for example, wants to know how the price they paid compared to the average price of the stock during the time it took to fill the order. If an order is filled at a worse price than the VWAP, it raises questions as to the ability of the broker. If the broker purchased a million shares at $40.50 and the VWAP during this time was at $40.70, the customer is likely to be happy since they paid 20 cents less than ‘fair value’. Equally, if the stock were purchased above, at, say $40.90 per share, the customer would consider this a poor trade, paying well above the fair value price at the VWAP.
The simplicity of this easy-to-understand benchmark, which creates this fair value price concept, has led to its wholehearted adoption amongst the institutions, and moreover, why algorithmic VWAP orders now dominate institutional market activity. A huge percentage of institutional orders are executed as VWAP orders, which raises two key questions. First of all, why, and second, how can we benefit from using the indicator?
If we start with the why, according to reports from the leading market makers, almost 40% of orders are now executed on this basis as they attempt to obtain a buy or sell price close to or better than the VWAP during the time it takes to complete the buy or sell order. These orders, therefore, help to hugely reinforce the importance of the VWAP since it is the guiding principle on which these orders are based. Even Warren Buffet uses VWAP, as evidenced when he sold his entire position in Southwest Airlines over two days, holding 2.3 million shares.
This highlights the key issues for any large institutional investor involving the price. If executed in a single order, an order to buy a large block of shares would almost certainly swamp the market, raising the price exponentially and, in addition, overwhelm the average volume traded in the day.
It is this issue of putting the price up against their own buying or conversely seeing the price fall as a result of their own selling that leads to the parent and child order scenario where significant block orders are broken into a multitude of smaller orders, which are duly executed over days, weeks or months. It is this aspect of institutional order execution that makes the VWAP such a potent indicator.
However, at Quantum Trading, we don’t just build a single indicator and leave it at that! We always take them to another level, and here we have done the same, bundling together a total of five indicators into one amazing value package so you can select your favorite from those on offer. The reason for this is we recognize the different ways the volume-weighted average price is used, which is why we offer a total of FIVE variants to choose from, and these are as follows:
VWAP – Volume Weighted Average Price
MVWAP – Moving Volume Weighted Average Price
AVWAP – Anchored Volume Weighted Average Price
TWAP – Time Weighted Average Price
Interday Volume Weighted Average Price
All five variants include the option to display upper and lower bands that act as envelopes above and below the VWAP based on standard deviation, which you can adjust and set yourself. These price envelopes become essential dynamic support and resistance levels, which can help predict the extremes of price action as it oscillates around the VWAP from the fastest to the slowest timeframes and everything in between.
All five indicators are packaged into one powerful indicator, which we have named the Quantum VWAP Pro indicator for obvious reasons, and as you would expect, it works in all markets and instruments, whether stocks, futures, ETFs, forex or cryptocurrencies.
Finally, as with all our indicators, we recommend you use it in multiple timeframes.

VWAP, AVWAP and MVWAP - Omkar BanneThis indicator plots the VWAP, MVWAP and Anchored VWAP.
AVWAP: Anchored VWAP sometimes doesn't work the way it should. In such times, trades can use the default AVWAP on the right ribbon.
MVWAP: Moving average length can be changed; the default is 10.

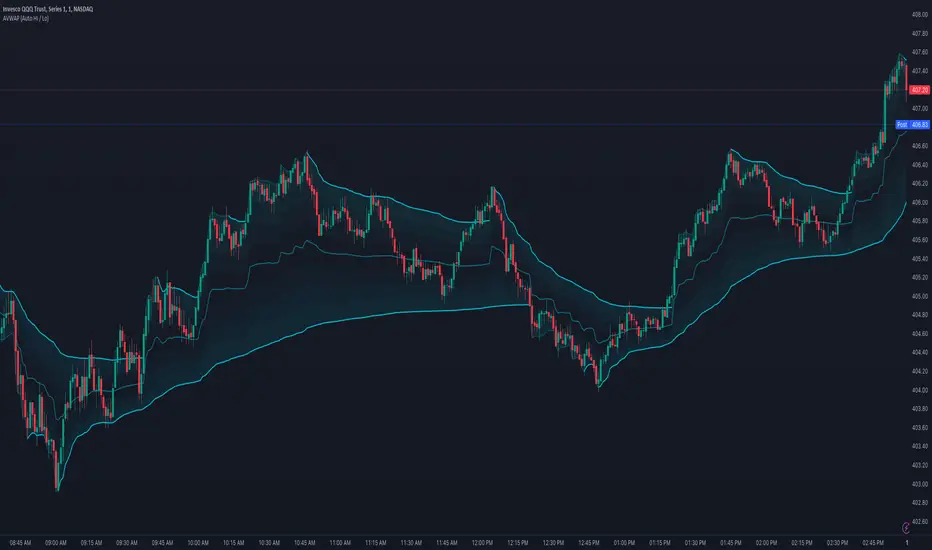
Anchored VWAP (Auto High & Low)OVERVIEW
This script plots, and auto-updates, 3 separate VWAPs: a traditional VWAP, a VWAP anchored to a trends high, and another anchored to a trends low.
VWAP and Anchored VWAPs are commonly used by institutions responsible for the majority of market volume on a given day. Citadel Trading, for example, accounts for approximately 35% of all U.S. listed retail volume , largely executed through program trades over the course of a day, week, or month.
Because VWAP is a prominent market maker tool for executing large trades, day traders can use it to better anticipate trends, mean reversion, and breakouts.
This is most useful on charts with intraday time frames (1 minute, 5 minute etc.) commonly used for day trading. This is not ideal for larger time frames (1 hour or greater) commonly used for swing trading or identifying larger trends.
INPUTS
You can configure:
The size, color, and visibility of 6 different plots (VWAP, High Anchor, Low Anchor, Average of Anchors, Quarter Values, Interim Bands)
How smooth the average displays
INSPIRATION
1. "How To Measure Anything" by Douglas W. Hubbard
2. "Maximum Trading Gains With Anchored VWAP" by Brian Shannon
Better understanding probability and how to analyze risk (first book), as well as the tools market makers use (second book), has completely reframed how I approach day trading.
Anchored VWAP Pinch & Handoff, Intervals, and Signals"Anchored VWAP Pinch & Handoff, Intervals, and Signals" is an AVWAP toolbox for those who like to use various VWAP trading techniques. The indicator is currently comprised of the following three sections:
• The Pinch & Handoff section (shown above on chart) allows manually setting an upper and lower AVWAP (Pinch) along with an additional AVWAP (Handoff) by entering dates or by dragging the vertical anchor lines to the desired significant events on chart. Each of these three AVWAPs can also be set to show zones above and/or below by a percentage or standard deviation amount. The theory behind this method is that the upper and lower AVWAPs may act as dynamic support and resistance levels, effectively creating a price range or channel. As price moves between these two VWAP levels, it becomes squeezed or consolidated within that range. Further conjecture is that the longer the price remains within the range of the two anchored VWAP values, the higher the potential for an explosive breakout. Traders using this strategy may interpret the prolonged consolidation as a period of price compression, with the expectation that a significant move in either direction is likely to occur. Traders employing the AVWAP Pinch strategy might look for specific chart patterns or additional confirmation signals to enter a trade. For example, a breakout above the upper anchored VWAP level could trigger a long trade, while a breakdown below the lower anchored VWAP level could signal a short trade. Stop-loss orders and profit targets are typically set based on the trader's risk tolerance and the volatility of the asset. The third AVWAP (Handoff) is typically set after price has broken through the Pinch, and is used as a new level of support or resistance. The "Pinch & Handoff" phrase is believed to have been coined by Brian Shannon, who has popularized this method.
• The Intervals section (shown above on chart) is comprised of six periodic AVWAPs which cyclically reset. Their default settings are 1 Day, 2 Days, 1 Week, 1 Month, 1 Quarter, and 1 Year. They each may be set to desired period and when they are enabled the VWAPs whose periods are lower than the current chart timeframe are automatically hidden. For example a 1 Day AVWAP is not useful on a 1 Week chart so it would be hidden from that timeframe. When using AVWAPs from higher timeframes it may be helpful to set your chart to "Scale price chart only". This can be enabled by right clicking on your chart's price column and then left clicking "Scale price chart only" to enable that option.
• The Auto section (shown above on chart) is comprised of two automatic Anchored VWAPs. There are choices for setting anchors automatically based upon Highest Source, Highest Volume, Lowest Source, Lowest Volume, Pivot High, and Pivot Low. Because these two VWAPs work retroactively they are drawn with lines instead of plots. There is currently a limitation of 500 lines that may be drawn at any given time and the logic within this indicator uses a line for every bar of VWAP that is drawn, so if the combined length of both of these VWAPs exceeds 500 bars the earliest lines would disappear. For typical use of looking for the highest high in the last 50 bars or the last fractal this limitation should not be an issue.
---
All of the plots have been titled including hidden plots that are generated for the AVWAP line drawings. All of the various types of AVWAP within the indicator should be available as choices within the Alert creation dialog if use of alerts is desired.
---
NOTICE: This is an example script and not meant to be used as an actual strategy. By using this script or any portion thereof, you acknowledge that you have read and understood that this is for research purposes only and I am not responsible for any financial losses you may incur by using this script!
