Market Strength Buy Sell Indicator [TradeDots]A specialized tool designed to assist traders in evaluating market conditions through a multifaceted analysis of relative performance, beta-adjusted returns, momentum, and volume—allowing you to identify optimal points for long or short trades. By integrating multiple benchmarks (default S&P 500) and percentile-based thresholds, the script provides clear, actionable insights suitable for both day trading and higher-level timeframe assessments.
📝 HOW IT WORKS
1. Multi-Factor Composite Score
Relative Performance (RS Ratio): Compares your asset’s performance to a chosen benchmark (default: SPY). Values above 1.0 indicate outperformance, while below 1.0 suggest underperformance.
Beta-Adjusted Returns: Checks the ticker’s excess movement relative to expected market-related moves. This helps distinguish pure “alpha” from broad market effects.
Volume & Correlation: Volume spikes often confirm the momentum behind a move, while correlation measures how closely the asset tracks or diverges from its benchmark.
These components merge into a 0–100 composite score. Scores above 50 frequently imply bullish strength; drops below 50 often point to underperformance—potentially flagging short opportunities.
2. Intraday & Day Trading Focus
Monitoring Below 50: During the trading day, the script calculates live data against the benchmark, offering an intraday-sensitive composite score. A dip under 50 may indicate a short bias for that session, especially when accompanied by high volume or momentum shifts.
3. Higher Timeframe Monitoring
Daily Strategies: On daily or weekly charts, the script reveals overall relative strength or weakness compared to the S&P 500. This higher-level perspective helps form broader trading biases—crucial for swing or position trades spanning multiple days.
Long/Short Thresholds: Persistent readings above 50 on a daily chart typically reinforce a long bias, while consistent dips below 50 can sustain a short or cautious outlook.
4. Pair Trading Applications
Custom Benchmark Selection: By setting a specific ticker pair as your benchmark instead of the default S&P 500, you can identify spread trading opportunities between two correlated assets. This allows you to go long the outperforming asset while shorting the underperforming one when the spread reaches extreme levels.
4. Color-Coded Signals & Alerts
Visual Zones (25–75): Color-coded bands highlight strong outperformance (above 75) or pronounced underperformance (below 25).
Alerts on Strong Shifts: Automatic alerts can notify you of sudden entries or exits from bullish or bearish zones, so you can potentially act on new market information without delay.
⚙️ HOW TO USE
1. Select Your Timeframe: For scalping or day trading, lower intervals (e.g., 5-minute) offer immediate data resets at the session’s start. For multi-day insight, daily or weekly charts reveal broader performance trends.
2. Watch Key Levels Around 50: Intraday dips under 50 may be a cue to consider short trades, while bounces above 50 can confirm renewed strength.
3. Assess Benchmark Relationships: Compare your asset’s score and signals to the broader market. A stock falling below its pair’s relative strength line might lag overall market momentum.
4. Combine Tools & Validate: This script excels when integrated with other technical analysis methods (e.g., support/resistance, chart patterns) and fundamental factors for a holistic market view.
❗ LIMITATIONS
No Direction Guarantee: The indicator identifies relative strength but does not guarantee directional price moves.
Delayed Updates: Since calculations update after each bar close, sudden intrabar changes may not immediately reflect.
Market-Specific Behaviors: Some assets or unusual market conditions may deviate from typical benchmarks, weakening signal reliability.
Past ≠ Future: High or low relative strength in the past may not predict continued performance.
RISK DISCLAIMER
All forms of trading and investing involve risk, including the possible loss of principal. This indicator analyzes relative performance but cannot assure profits or eliminate losses. Past performance of any strategy does not guarantee future results. Always combine analysis with proper risk management and your broader trading plan. Consult a licensed financial advisor if you are unsure of your individual risk tolerance or investment objectives.
Beta

Performance Metrics With Bracketed Rebalacing [BackQuant]Performance Metrics With Bracketed Rebalancing
The Performance Metrics With Bracketed Rebalancing script offers a robust method for assessing portfolio performance, integrating advanced portfolio metrics with different rebalancing strategies. With a focus on adaptability, the script allows traders to monitor and adjust portfolio weights, equity, and other key financial metrics dynamically. This script provides a versatile approach for evaluating different trading strategies, considering factors like risk-adjusted returns, volatility, and the impact of portfolio rebalancing.
Please take the time to read the following:
Key Features and Benefits of Portfolio Methods
Bracketed Rebalancing:
Bracketed Rebalancing is an advanced strategy designed to trigger portfolio adjustments when an asset's weight surpasses a predefined threshold. This approach minimizes overexposure to any single asset while maintaining flexibility in response to market changes. The strategy is particularly beneficial for mitigating risks that arise from significant asset weight fluctuations. The following image illustrates how this method reacts when asset weights cross the threshold:
Daily Rebalancing:
Unlike the bracketed method, Daily Rebalancing adjusts portfolio weights every trading day, ensuring consistent asset allocation. This method aims for a more even distribution of portfolio weights, making it a suitable option for traders who prefer less sensitivity to individual asset volatility. Here's an example of Daily Rebalancing in action:
No Rebalancing:
For traders who prefer a passive approach, the "No Rebalancing" option allows the portfolio to remain static, without any adjustments to asset weights. This method may appeal to long-term investors or those who believe in the inherent stability of their selected assets. Here’s how the portfolio looks when no rebalancing is applied:
Portfolio Weights Visualization:
One of the standout features of this script is the visual representation of portfolio weights. With adjustable settings, users can track the current allocation of assets in real-time, making it easier to analyze shifts and trends. The following image shows the real-time weight distribution across three assets:
Rolling Drawdown Plot:
Managing drawdown risk is a critical aspect of portfolio management. The Rolling Drawdown Plot visually tracks the drawdown over time, helping traders monitor the risk exposure and performance relative to the peak equity levels. This feature is essential for assessing the portfolio's resilience during market downturns:
Daily Portfolio Returns:
Tracking daily returns is crucial for evaluating the short-term performance of the portfolio. The script allows users to plot daily portfolio returns to gain insights into daily profit or loss, helping traders stay updated on their portfolio’s progress:
Performance Metrics
Net Profit (%):
This metric represents the total return on investment as a percentage of the initial capital. A positive net profit indicates that the portfolio has gained value over the evaluation period, while a negative value suggests a loss. It's a fundamental indicator of overall portfolio performance.
Maximum Drawdown (Max DD):
Maximum Drawdown measures the largest peak-to-trough decline in portfolio value during a specified period. It quantifies the most significant loss an investor would have experienced if they had invested at the highest point and sold at the lowest point within the timeframe. A smaller Max DD indicates better risk management and less exposure to significant losses.
Annual Mean Returns (% p/y):
This metric calculates the average annual return of the portfolio over the evaluation period. It provides insight into the portfolio's ability to generate returns on an annual basis, aiding in performance comparison with other investment opportunities.
Annual Standard Deviation of Returns (% p/y):
This measure indicates the volatility of the portfolio's returns on an annual basis. A higher standard deviation signifies greater variability in returns, implying higher risk, while a lower value suggests more stable returns.
Variance:
Variance is the square of the standard deviation and provides a measure of the dispersion of returns. It helps in understanding the degree of risk associated with the portfolio's returns.
Sortino Ratio:
The Sortino Ratio is a variation of the Sharpe Ratio that only considers downside risk, focusing on negative volatility. It is calculated as the difference between the portfolio's return and the minimum acceptable return (MAR), divided by the downside deviation. A higher Sortino Ratio indicates better risk-adjusted performance, emphasizing the importance of avoiding negative returns.
Sharpe Ratio:
The Sharpe Ratio measures the portfolio's excess return per unit of total risk, as represented by standard deviation. It is calculated by subtracting the risk-free rate from the portfolio's return and dividing by the standard deviation of the portfolio's excess return. A higher Sharpe Ratio indicates more favorable risk-adjusted returns.
Omega Ratio:
The Omega Ratio evaluates the probability of achieving returns above a certain threshold relative to the probability of experiencing returns below that threshold. It is calculated by dividing the cumulative probability of positive returns by the cumulative probability of negative returns. An Omega Ratio greater than 1 indicates a higher likelihood of achieving favorable returns.
Gain-to-Pain Ratio:
The Gain-to-Pain Ratio measures the return per unit of risk, focusing on the magnitude of gains relative to the severity of losses. It is calculated by dividing the total gains by the total losses experienced during the evaluation period. A higher ratio suggests a more favorable balance between reward and risk.
www.linkedin.com
Compound Annual Growth Rate (CAGR) (% p/y):
CAGR represents the mean annual growth rate of the portfolio over a specified period, assuming the investment has been compounding over that time. It provides a smoothed annual rate of growth, eliminating the effects of volatility and offering a clearer picture of long-term performance.
Portfolio Alpha (% p/y):
Portfolio Alpha measures the portfolio's performance relative to a benchmark index, adjusting for risk. It is calculated using the Capital Asset Pricing Model (CAPM) and represents the excess return of the portfolio over the expected return based on its beta and the benchmark's performance. A positive alpha indicates outperformance, while a negative alpha suggests underperformance.
Portfolio Beta:
Portfolio Beta assesses the portfolio's sensitivity to market movements, indicating its exposure to systematic risk. A beta greater than 1 suggests the portfolio is more volatile than the market, while a beta less than 1 indicates lower volatility. Beta is used to understand the portfolio's potential for gains or losses in relation to market fluctuations.
Skewness of Returns:
Skewness measures the asymmetry of the return distribution. A positive skew indicates a distribution with a long right tail, suggesting more frequent small losses and fewer large gains. A negative skew indicates a long left tail, implying more frequent small gains and fewer large losses. Understanding skewness helps in assessing the likelihood of extreme outcomes.
Value at Risk (VaR) 95th Percentile:
VaR at the 95th percentile estimates the maximum potential loss over a specified period, given a 95% confidence level. It provides a threshold value such that there is a 95% probability that the portfolio will not experience a loss greater than this amount.
Conditional Value at Risk (CVaR):
CVaR, also known as Expected Shortfall, measures the average loss exceeding the VaR threshold. It provides insight into the tail risk of the portfolio, indicating the expected loss in the worst-case scenarios beyond the VaR level.
These metrics collectively offer a comprehensive view of the portfolio's performance, risk exposure, and efficiency. By analyzing these indicators, investors can make informed decisions, balancing potential returns with acceptable levels of risk.
Conclusion
The Performance Metrics With Bracketed Rebalancing script provides a comprehensive framework for evaluating and optimizing portfolio performance. By integrating advanced metrics, adaptive rebalancing strategies, and visual analytics, it empowers traders to make informed decisions in managing their investment portfolios. However, it's crucial to consider the implications of rebalancing strategies, as academic research indicates that predictable rebalancing can lead to market impact costs. Therefore, adopting flexible and less predictable rebalancing approaches may enhance portfolio performance and reduce associated costs.

CAPM Alpha & BetaThe CAPM Alpha & Beta indicator is a crucial tool in finance and investment analysis derived from the Capital Asset Pricing Model (CAPM) . It provides insights into an asset's risk-adjusted performance (Alpha) and its relationship to broader market movements (Beta). Here’s a breakdown:
1. How Does It Work?
Alpha:
Definition: Alpha measures the portion of an investment's return that is not explained by market movements, i.e., the excess return over and above what the market is expected to deliver.
Purpose: It represents the value a fund manager or strategy adds (or subtracts) from an investment’s performance, adjusting for market risk.
Calculation:
Alpha is derived from comparing actual returns to expected returns predicted by CAPM:
Alpha = Actual Return − (Risk-Free Rate + β × (Market Return − Risk-Free Rate))
Alpha = Actual Return − (Risk-Free Rate + β × (Market Return − Risk-Free Rate))
Interpretation:
Positive Alpha: The investment outperformed its CAPM prediction (good performance for additional value/risk).
Negative Alpha: The investment underperformed its CAPM prediction.
Beta:
Definition: Beta measures the sensitivity of an asset's returns relative to the overall market's returns. It quantifies systematic risk.
Purpose: Indicates how volatile or correlated an investment is relative to the market benchmark (e.g., S&P 500).
Calculation:
Beta is computed as the ratio of the covariance of the asset and market returns to the variance of the market returns:
β = Covariance (Asset Return, Market Return) / Variance (Market Return)
β = Variance (Market Return) Covariance (Asset Return, Market Return)
Interpretation:
Beta = 1: The asset’s price moves in line with the market.
Beta > 1: The asset is more volatile than the market (higher risk/higher potential reward).
Beta < 1: The asset is less volatile than the market (lower risk/lower reward).
Beta < 0: The asset moves inversely to the market.
2. How to Use It?
Using Alpha:
Portfolio Evaluation: Investors use Alpha to gauge whether a portfolio manager or a strategy has successfully outperformed the market on a risk-adjusted basis.
If Alpha is consistently positive, the portfolio may deliver higher-than-expected returns for the given level of risk.
Stock/Asset Selection: Compare Alpha across multiple securities. Positive Alpha signals that the asset may be a good addition to your portfolio for excess returns.
Adjusting Investment Strategy: If Alpha is negative, reassess the asset's role in the portfolio and refine strategies.
Using Beta:
Risk Management:
A high Beta (e.g., 1.5) indicates higher sensitivity to market movements. Use such assets if you want to take on more risk during bullish market phases or expect higher returns.
A low Beta (e.g., 0.7) indicates stability and is useful in diversifying risk in volatile or bearish markets.
Portfolio Diversification: Combine assets with varying Betas to achieve the desired level of market responsiveness and smooth out portfolio volatility.
Monitoring Systematic Risk: Beta helps identify whether an investment aligns with your risk tolerance. For example, high-Beta stocks may not be suitable for conservative investors.
Practical Application:
Use both Alpha and Beta together:
Assess performance with Alpha (excess returns).
Assess risk exposure with Beta (market sensitivity).
Example: A stock with a Beta of 1.2 and a highly positive Alpha might suggest a solid performer that is slightly more volatile than the market, making it a suitable pick for risk-tolerant, return-maximizing investors.
In conclusion, the CAPM Alpha & Beta indicator gives a comprehensive view of an asset's performance and risk. Alpha enables performance evaluation on a risk-adjusted basis, while Beta reveals the level of market risk. Together, they help investors make informed decisions, build optimal portfolios, and align investments with their risk-return preferences.

Relative Performance SuiteOverview
The Relative Performance Suite (RPS) is a versatile and comprehensive indicator designed to evaluate an asset's performance relative to a benchmark. By offering multiple methods to measure performance, including Relative Performance, Alpha, and Price Ratio, this tool helps traders and investors assess asset strength, resilience, and overall behavior in different market conditions.
Key Features:
✅ Multiple Performance Measures:
Choose from various relative performance calculations, including:
Relative Performance:
Measures how much an asset has outperformed or underperformed its benchmark over a given period.
Relative Performance (Proportional):
A proportional version of relative performance,
factoring in scaling effects.
Relative Performance (MA Based):
Uses moving averages to smooth performance fluctuations.
Alpha:
A measure of an asset’s performance relative to what would be expected based on its beta and the benchmark’s return. It represents the excess return above the risk-free rate after adjusting for market risk.
Price Ratio:
Compares asset prices directly to determine relative value over time.
✅ Customizable Moving Averages:
Apply different moving average types (SMA, EMA, SMMA, WMA, VWMA) to smooth price inputs and refine calculations.
✅ Beta Calculation:
Includes a Beta measure used in Alpha calculation, which users can toggle the visibility of helping users understand an asset's sensitivity to market movements.
✅ Risk-Free Rate Adjustment:
Incorporate risk-free rates (e.g., US Treasury yields, Fed Funds Rate) for a more accurate calculation of Alpha.
✅ Logarithmic Returns Option:
Users can switch between standard returns and log returns for more refined performance analysis.
✅ Dynamic Color Coding:
Identify outperformance or underperformance with intuitive color coding.
Option to color bars based on relative strength, making chart analysis easier.
✅ Customizable Tables for Data Display:
Overview table summarizing key metrics.
Explanation table offering insights into how values are derived.
How to Use:
Select a Benchmark: Choose a comparison symbol (e.g., TOTAL or SPX ).
Pick a Performance Metric: Use different modes to analyze relative performance.
Customize Calculation Methods: Adjust moving averages, timeframes, and log returns based on preference.
Interpret the Colors & Tables: Utilize the dynamic coloring and tables to quickly assess market conditions.
Ideal For:
Traders looking to compare individual asset performance against an index or benchmark.
Investors analyzing Alpha & Beta to understand risk-adjusted returns.
Market analysts who want a visually intuitive and data-rich performance tracking tool.
This indicator provides a powerful and flexible way to track relative asset strength, helping users make more informed trading decisions.

Internals Elite NYSE [Beta]Overview:
This indicator is designed to provide traders with a quick overview of key market internals and metrics in a single, easy-to-read table displayed directly on the chart. It incorporates a variety of metrics that help gauge market sentiment, momentum, and overall market conditions.
The table dynamically updates in real-time and uses color-coding to highlight significant changes or thresholds, allowing traders to quickly interpret the data and make informed trading decisions.
Features:
Market Internals:
TICK: Measures the difference between the number of stocks ticking up versus those ticking down on the NYSE. Green or red background indicates if it crosses a user-defined threshold.
Advance/Decline (ADD): Shows the net number of advancing versus declining stocks on the NYSE. Color-coded to show positive, negative, or neutral conditions.
Volatility Metrics:
VIX Change (%): Displays the percentage change in the Volatility Index (VIX), a key gauge of market fear or complacency. Color-coded for direction.
VIX Price: Displays the current VIX price with thresholds to indicate low, medium, or high volatility.
Other Market Metrics:
DXY Change (%): Percentage change in the US Dollar Index (DXY), indicating dollar strength or weakness.
VWAP Deviation (%): Percentage of stocks above VWAP (Volume Weighted Average Price), helping traders assess intraday buying and selling pressure.
Asset-Specific Metrics:
BTCUSD Change (%): Percentage change in Bitcoin (BTC) price, useful for monitoring cryptocurrency sentiment.
SPY Change (%): Percentage change in the S&P 500 ETF (SPY), a proxy for the overall stock market.
Current Ticker Change (%): Percentage change in the currently selected ticker on the chart.
US10Y Change (%): Percentage change in the yield of the 10-Year US Treasury Note (TVC:US10Y), an important macroeconomic indicator.
Customizable Appearance:
Adjustable text size to suit your chart layout.
User-defined thresholds for key metrics (e.g., TICK, ADD, VWAP, VIX).
Dynamic Table Placement:
You can position the table anywhere on the chart: top-right, top-left, bottom-right, bottom-left, middle-right, or middle-left.
How to Use:
Add the Indicator to Your Chart:
Apply the indicator to your chart from the Pine Script editor in TradingView.
Customize the Inputs:
Adjust the thresholds for TICK, ADD, VWAP, and VIX according to your trading style.
Enable or disable the metrics you want to see in the table by toggling the display options for each metric (e.g., Show TICK, Show BTC, Show SPY).
Set the table placement to your preferred position on the chart.
Interpret the Table:
Look for color-coded cells to quickly identify significant changes or breaches of thresholds.
Positive values are typically shown in green, negative values in red, and neutral/insignificant changes in gray.
Use metrics like TICK and ADD to gauge market breadth and momentum.
Refer to VWAP deviation to assess intraday buying or selling pressure.
Monitor the VIX and US10Y changes to stay aware of macroeconomic and volatility shifts.
Incorporate Into Your Strategy:
Use the indicator alongside technical analysis to confirm setups or identify areas of caution.
Keep an eye on correlated metrics (e.g., VIX and SPY) for broader market context.
Use BTCUSD or DXY as additional indicators of risk-on/risk-off sentiment.
Ideal Users:
Day Traders: Quickly gauge intraday market conditions and momentum.
Swing Traders: Identify broader sentiment shifts using metrics like ADD, DXY, and US10Y.
Macro Investors: Stay updated on key macroeconomic indicators like the 10-Year Treasury yield (US10Y) and the US Dollar Index (DXY).
This indicator serves as a comprehensive tool for understanding market conditions at a glance, enabling traders to act decisively based on the latest data.

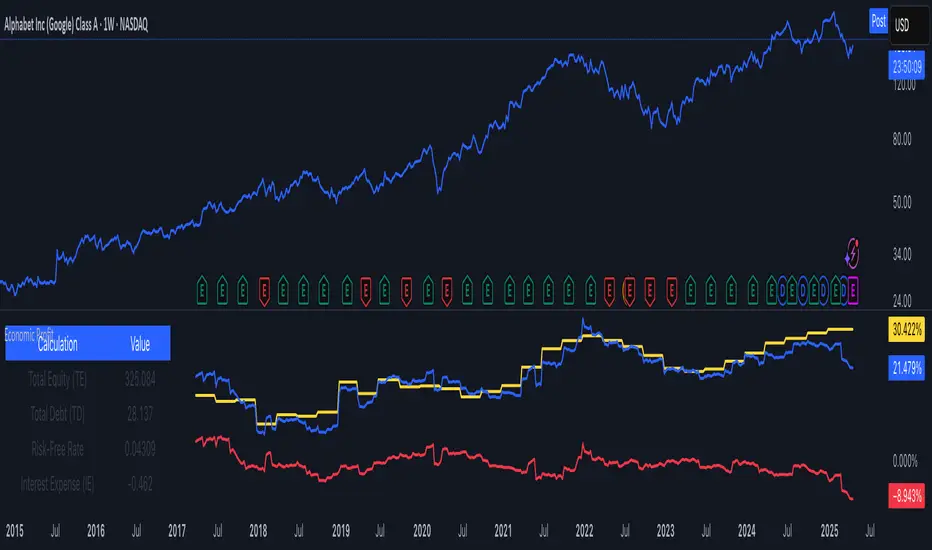
Economic Profit (YavuzAkbay)The Economic Profit Indicator is a Pine Script™ tool for assessing a company’s economic profit based on key financial metrics like Return on Invested Capital (ROIC) and Weighted Average Cost of Capital (WACC). This indicator is designed to give traders a more accurate understanding of risk-adjusted returns.
Features
Customizable inputs for Risk-Free Rate and Corporate Tax Rate assets for people who are trading in other countries.
Calculates Economic Profit based on ROIC and WACC, with values shown as both plots and in an on-screen table.
Provides detailed breakdowns of all key calculations, enabling deeper insights into financial performance.
How to Use
Open the stock to be analyzed. In the settings, enter the risk-free asset (usually a 10-year bond) of the country where the company to be analyzed is located. Then enter the corporate tax of the country (USCTR for the USA, DECTR for Germany). Then enter the average return of the index the stock is in. I prefer 10% (0.10) for the SP500, different rates can be entered for different indices. Finally, the beta of the stock is entered. In future versions I will automatically pull beta and index returns, but in order to publish the indicator a bit earlier, I have left it entirely up to the investor.
How to Interpret
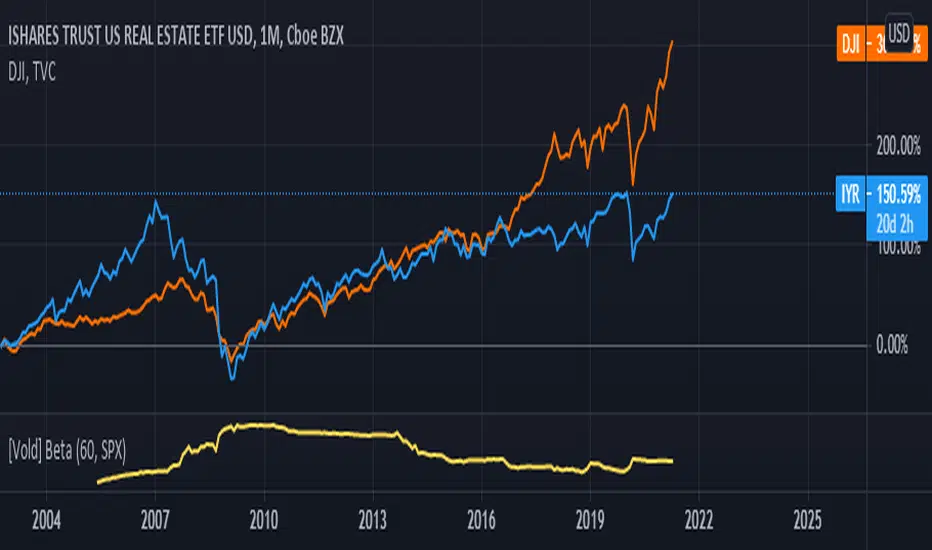
We see 3 pieces of data on the indicator. The dark blue one is ROIC, the dark orange one is WACC and the light blue line represents the difference between WACC and ROIC.
In a scenario where both ROIC and WACC are negative, if ROIC is lower than WACC, the share is at a complete economic loss.
In a scenario where both ROIC and WACC are negative, if ROIC has started to rise above WACC and is moving towards positive, the share is still in an economic loss but tending towards profit.
A scenario where ROIC is positive and WACC is negative is the most natural scenario for a company. In this scenario, we know that the company is doing well by a gradually increasing ROIC and a stable WACC.
In addition, if the ROIC and WACC difference line goes above 0, the company is now economically in net profit. This is the best scenario for a company.
My own investment strategy as a developer of the code is to look for the moment when ROIC is greater than WACC when ROIC and WACC are negative. At that point the stock is the best time to invest.
Trading is risky, and most traders lose money. The indicators Yavuz Akbay offers are for informational and educational purposes only. All content should be considered hypothetical, selected after the facts to demonstrate my product, and not constructed as financial advice. Decisions to buy, sell, hold, or trade in securities, commodities, and other investments involve risk and are best made based on the advice of qualified financial professionals. Past performance does not guarantee future results.
This indicator is experimental and will always remain experimental. The indicator will be updated by Yavuz Akbay according to market conditions.
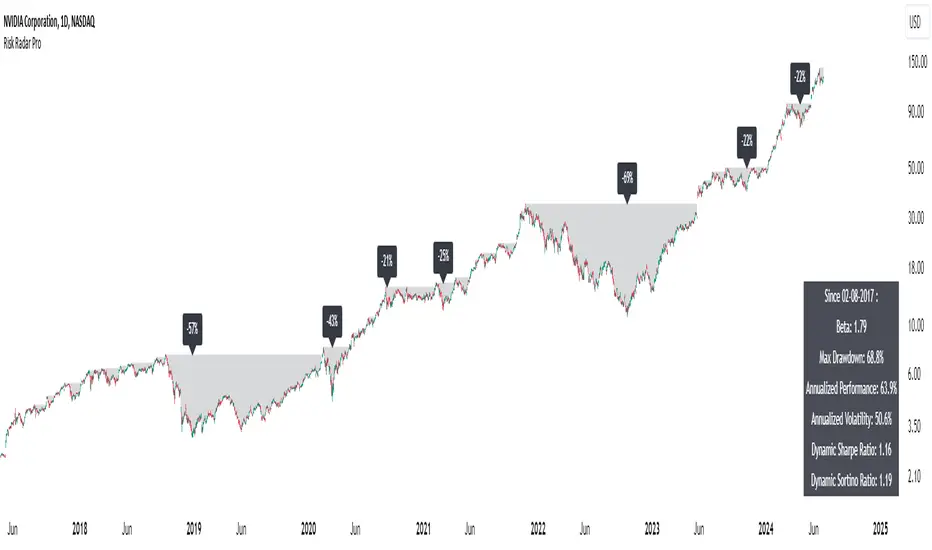
Risk Radar ProThe "Risk Radar Pro" indicator is a sophisticated tool designed to help investors and traders assess the risk and performance of their investments over a specified period. This presentation will explain each component of the indicator, how to interpret the results, and the advantages compared to traditional metrics.
The "Risk Radar Pro" indicator includes several key metrics:
● Beta
● Maximum Drawdown
● Compound Annual Growth Rate (CAGR)
● Annualized Volatility
● Dynamic Sharpe Ratio
● Dynamic Sortino Ratio
Each of these metrics is dynamically calculated using data from the entire selected period, providing a more adaptive and accurate measure of performance and risk.
1. Start Date
● Description: The date from which the calculations begin.
● Interpretation: This allows the user to set a specific period for analysis, ensuring that all metrics reflect the performance from this point onward.
2. Beta
● Description: Beta measures the volatility or systematic risk of the instrument relative to a reference index (e.g., SPY).
● Interpretation: A beta of 1 indicates that the instrument moves with the market. A beta greater than 1 indicates more volatility than the market, while a beta less than 1 indicates less volatility.
● Advantages: Unlike classic beta, which typically uses fixed historical intervals, this dynamic beta adjusts to market changes over the entire selected period, providing a more responsive measure.
3. Maximum Drawdown
● Description: The maximum observed loss from a peak to a trough before a new peak is achieved.
● Interpretation: This shows the largest single drop in value during the specified period. It is a critical measure of downside risk.
● Advantages: By tracking the maximum drawdown dynamically, the indicator can provide timely alerts when significant losses occur, allowing for better risk management.
4. Annualized Performance
● Description: The mean annual growth rate of the investment over the specified period.
● Interpretation: The Annualized Performance represents the smoothed annual rate at which the investment would have grown if it had grown at a steady rate.
● Advantages: This dynamic calculation reflects the actual long-term growth trend of the investment rather than relying on a fixed time frame.
5. Annualized Volatility
● Description: Measures the degree of variation in the instrument's returns over time, expressed as a percentage.
● Interpretation: Higher volatility indicates greater risk, as the investment's returns fluctuate more.
● Advantages: Annualized volatility calculated over the entire selected period provides a more accurate measure of risk, as it includes all market conditions encountered during that time.
6. Dynamic Sharpe Ratio
● Description: Measures the risk-adjusted return of an investment relative to its volatility.
● Choice of Risk-Free Rate Ticker: Users can select a ticker symbol to represent the risk-free rate in Sharpe ratio calculations. The default option is US03M, representing the 3-month US Treasury bill.
● Interpretation: A higher Sharpe ratio indicates better risk-adjusted returns. This ratio accounts for the risk-free rate to provide a comparison with risk-free investments.
● Advantages: By using returns and volatility over the entire period, the dynamic Sharpe ratio adjusts to changes in market conditions, offering a more accurate measure than traditional static calculations.
7. Dynamic Sortino Ratio
● Description: Similar to the Sharpe ratio, but focuses only on downside risk.
Interpretation: A higher Sortino ratio indicates better risk-adjusted returns, focusing solely on negative returns, which are more relevant to risk-averse investors.
● Choice of Risk-Free Rate Ticker: Similarly, users can choose a ticker symbol for the risk-free rate in Sortino ratio calculations. By default, this is also set to US03M.
● Advantages: This ratio's dynamic calculation considering the downside deviation over the entire period provides a more accurate measure of risk-adjusted returns in volatile markets.
Comparison with Basic Metrics
● Static vs. Dynamic Calculations: Traditional metrics often use fixed historical intervals, which may not reflect current market conditions. The dynamic calculations in "Risk Radar Pro" adjust to market changes, providing more relevant and timely information.
● Comprehensive Risk Assessment: By including metrics like maximum drawdown, Sharpe ratio, and Sortino ratio, the indicator provides a holistic view of both upside potential and downside risk.
● User Customization: Users can customize the start date, reference index, risk-free rate, and table position, tailoring the indicator to their specific needs and preferences.
Conclusion
The "Risk Radar Pro" indicator is a powerful tool for investors and traders looking to assess and manage risk more effectively. By providing dynamic, comprehensive metrics, it offers a significant advantage over traditional static calculations, ensuring that users have the most accurate and relevant information to make informed decisions.
The "Risk Radar Pro" indicator provides analytical tools and metrics for informational purposes only. It is not intended as financial advice. Users should conduct their own research and consider their individual risk tolerance and investment objectives before making any investment decisions based on the indicator's outputs. Trading and investing involve risks, including the risk of loss. Past performance is not indicative of future results.
BetaBeta , also known as the Beta coefficient, is a measure that compares the volatility of an individual underlying or portfolio to the volatility of the entire market, typically represented by a market index like the S&P 500 or an investible product such as the SPY ETF (SPDR S&P 500 ETF Trust). A Beta value provides insight into how an asset's returns are expected to respond to market swings.
Interpretation of Beta Values
Beta = 1: The asset's volatility is in line with the market. If the market rises or falls, the asset is expected to move correspondingly.
Beta > 1: The asset is more volatile than the market. If the market rises or falls, the asset's price is expected to rise or fall more significantly.
Beta < 1 but > 0: The asset is less volatile than the market. It still moves in the same direction as the market but with less magnitude.
Beta = 0: The asset's returns are not correlated with the market's returns.
Beta < 0: The asset moves in the opposite direction to the market.
Example
A beta of 1.20 relative to the S&P 500 Index or SPY implies that if the S&P's return increases by 1%, the portfolio is expected to increase by 12.0%.
A beta of -0.10 relative to the S&P 500 Index or SPY implies that if the S&P's return increases by 1%, the portfolio is expected to decrease by 0.1%. In practical terms, this implies that the portfolio is expected to be predominantly 'market neutral' .
Calculation & Default Values
The Beta of an asset is calculated by dividing the covariance of the asset's returns with the market's returns by the variance of the market's returns over a certain period (standard period: 1 years, 250 trading days). Hint: It's noteworthy to mention that Beta can also be derived through linear regression analysis, although this technique is not employed in this Beta Indicator.
Formula: Beta = Covariance(Asset Returns, Market Returns) / Variance(Market Returns)
Reference Market: Essentially any reference market index or product can be used. The default reference is the SPY (SPDR S&P 500 ETF Trust), primarily due to its investable nature and broad representation of the market. However, it's crucial to note that Beta can also be calculated by comparing specific underlyings, such as two different stocks or commodities, instead of comparing an asset to the broader market. This flexibility allows for a more tailored analysis of volatility and correlation, depending on the user's specific trading or investment focus.
Look-back Period: The standard look-back period is typically 1-5 years (250-1250 trading days), but this can be adjusted based on the user's preference and the specifics of the trading strategy. For robust estimations, use at least 250 trading days.
Option Delta: An optional feature in the Beta Indicator is the ability to select a specific Delta value if options are written on the underlying asset with Deltas less than 1, providing an estimation of the beta-weighted delta of the position. It involves multiplying the beta of the underlying asset by the delta of the option. This addition allows for a more precise assessment of the underlying asset's correspondence with the overall market in case you are an options trader. The default Delta value is set to 1, representing scenarios where no options on the underlying asset are being analyzed. This default setting aligns with analyzing the direct relationship between the asset itself and the market, without the layer of complexity introduced by options.
Calculation: Simple or Log Returns: In the calculation of Beta, users have the option to choose between using simple returns or log returns for both the asset and the market. The default setting is 'Simple Returns'.
Advantages of Using Beta
Risk Management: Beta provides a clear metric for understanding and managing the risk of a portfolio in relation to market movements.
Portfolio Diversification: By knowing the beta of various assets, investors can create a balanced portfolio that aligns with their risk tolerance and investment goals.
Performance Benchmarking: Beta allows investors to compare an asset's risk-adjusted performance against the market or other benchmarks.
Beta-Weighted Deltas for Options Traders
For options traders, understanding the beta-weighted delta is crucial. It involves multiplying the beta of the underlying asset by the delta of the option. This provides a more nuanced view of the option's risk relative to the overall market. However, it's important to note that the delta of an option is dynamic, changing with the asset's price, time to expiration, and other factors.

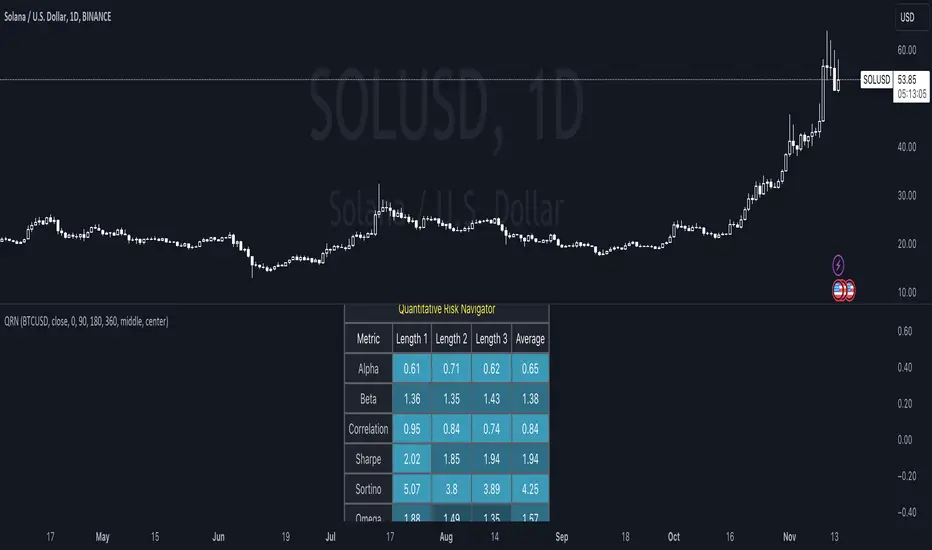
Quantitative Risk Navigator [kikfraben]📊 Quantitative Risk Navigator - Your Financial Performance GPS
Navigate the complexities of financial markets with confidence using the Quantitative Risk Navigator. This indicator provides you with a comprehensive dashboard to assess and understand the risk and performance of your chosen asset.
📈 Key Features:
Alpha and Beta Analysis: Uncover the outperformance (Alpha) and risk exposure (Beta) of your asset compared to a selected benchmark. Know where your investment stands in the market.
Correlation Insights: Understand the relationship between your asset and its benchmark through a clear visualization of correlation trends over different time lengths.
Risk-Return Metrics: Evaluate risk and return simultaneously with Sharpe and Sortino ratios. Make informed decisions by assessing the reward-to-risk ratio of your investment.
Omega Ratio: Gain deeper insights into your asset's performance by analyzing the Omega Ratio, which highlights the distribution of positive and negative returns.
Customizable Visualization: Tailor your chart to focus on specific metrics and time frames. Choose which metrics to display, allowing you to concentrate on the aspects that matter most to you.
Interactive Metrics Table: A user-friendly metrics table provides a quick overview of key values, including average metrics, enabling you to grasp the financial health of your asset at a glance.
Color-Coded Clarity: The indicator employs color-coded visualizations, making it easy to identify bullish and bearish trends, helping you make rapid and informed decisions.
🛠️ How to Use:
Symbol Selection: Choose your base symbol and preferred data source for analysis.
Risk-Free Rate: Input your risk-free rate to fine-tune calculations.
Length Customization: Adjust the lengths for different metrics to align with your analysis preferences.
Whether you're a seasoned trader or just stepping into the financial world, the Quantitative Risk Navigator empowers you to make strategic decisions by providing a comprehensive view of your asset's risk and return profile. Stay in control of your investments with this powerful financial GPS.
🚀 Start Navigating Your Financial Journey Today!
Volume and Price Z-Score [Multi-Asset] - By LeviathanThis script offers in-depth Z-Score analytics on price and volume for 200 symbols. Utilizing visualizations such as scatter plots, histograms, and heatmaps, it enables traders to uncover potential trade opportunities, discern market dynamics, pinpoint outliers, delve into the relationship between price and volume, and much more.
A Z-Score is a statistical measurement indicating the number of standard deviations a data point deviates from the dataset's mean. Essentially, it provides insight into a value's relative position within a group of values (mean).
- A Z-Score of zero means the data point is exactly at the mean.
- A positive Z-Score indicates the data point is above the mean.
- A negative Z-Score indicates the data point is below the mean.
For instance, a Z-Score of 1 indicates that the data point is 1 standard deviation above the mean, while a Z-Score of -1 indicates that the data point is 1 standard deviation below the mean. In simple terms, the more extreme the Z-Score of a data point, the more “unusual” it is within a larger context.
If data is normally distributed, the following properties can be observed:
- About 68% of the data will lie within ±1 standard deviation (z-score between -1 and 1).
- About 95% will lie within ±2 standard deviations (z-score between -2 and 2).
- About 99.7% will lie within ±3 standard deviations (z-score between -3 and 3).
Datasets like price and volume (in this context) are most often not normally distributed. While the interpretation in terms of percentage of data lying within certain ranges of z-scores (like the ones mentioned above) won't hold, the z-score can still be a useful measure of how "unusual" a data point is relative to the mean.
The aim of this indicator is to offer a unique way of screening the market for trading opportunities by conveniently visualizing where current volume and price activity stands in relation to the average. It also offers features to observe the convergent/divergent relationships between asset’s price movement and volume, observe a single symbol’s activity compared to the wider market activity and much more.
Here is an overview of a few important settings.
Z-SCORE TYPE
◽️ Z-Score Type: Current Z-Score
Calculates the z-score by comparing current bar’s price and volume data to the mean (moving average with any custom length, default is 20 bars). This indicates how much the current bar’s price and volume data deviates from the average over the specified period. A positive z-score suggests that the current bar's price or volume is above the mean of the last 20 bars (or the custom length set by the user), while a negative z-score means it's below that mean.
Example: Consider an asset whose current price and volume both show deviations from their 20-bar averages. If the price's Z-Score is +1.5 and the volume's Z-Score is +2.0, it means the asset's price is 1.5 standard deviations above its average, and its trading volume is 2 standard deviations above its average. This might suggest a significant upward move with strong trading activity.
◽️ Z-Score Type: Average Z-Score
Calculates the custom-length average of symbol's z-score. Think of it as a smoothed version of the Current Z-Score. Instead of just looking at the z-score calculated on the latest bar, it considers the average behavior over the last few bars. By doing this, it helps reduce sudden jumps and gives a clearer, steadier view of the market.
Example: Instead of a single bar, imagine the average price and volume of an asset over the last 5 bars. If the price's 5-bar average Z-Score is +1.0 and the volume's is +1.5, it tells us that, over these recent bars, both the price and volume have been consistently above their longer-term averages, indicating sustained increase.
◽️ Z-Score Type: Relative Z-Score
Calculates a relative z-score by comparing symbol’s current bar z-score to the mean (average z-score of all symbols in the group). This is essentially a z-score of a z-score, and it helps in understanding how a particular symbol's activity stands out not just in its own historical context, but also in relation to the broader set of symbols being analyzed. In other words, while the primary z-score tells you how unusual a bar's activity is for that specific symbol, the relative z-score informs you how that "unusualness" ranks when compared to the entire group's deviations. This can be particularly useful in identifying symbols that are outliers even among outliers, indicating exceptionally unique behaviors or opportunities.
Example: If one asset's price Z-Score is +2.5 and volume Z-Score is +3.0, but the group's average Z-Scores are +0.5 for price and +1.0 for volume, this asset’s Relative Z-Score would be high and therefore stand out. This means that asset's price and volume activities are notably high, not just by its own standards, but also when compared to other symbols in the group.
DISPLAY TYPE
◽️ Display Type: Scatter Plot
The Scatter Plot is a visual tool designed to represent values for two variables, in this case the Z-Scores of price and volume for multiple symbols. Each symbol has it's own dot with x and y coordinates:
X-Axis: Represents the Z-Score of price. A symbol further to the right indicates a higher positive deviation in its price from its average, while a symbol to the left indicates a negative deviation.
Y-Axis: Represents the Z-Score of volume. A symbol positioned higher up on the plot suggests a higher positive deviation in its trading volume from its average, while one lower down indicates a negative deviation.
Here are some guideline insights of plot positioning:
- Top-Right Quadrant (High Volume-High Price): Symbols in this quadrant indicate a scenario where both the trading volume and price are higher than their respective mean.
- Top-Left Quadrant (High Volume-Low Price): Symbols here reflect high trading volumes but prices lower than the mean.
- Bottom-Left Quadrant (Low Volume-Low Price): Assets in this quadrant have both low trading volume and price compared to their mean.
- Bottom-Right Quadrant (Low Volume-High Price): Symbols positioned here have prices that are higher than their mean, but the trading volume is low compared to the mean.
The plot also integrates a set of concentric squares which serve as visual guides:
- 1st Square (1SD): Encapsulates symbols that have Z-Scores within ±1 standard deviation for both price and volume. Symbols within this square are typically considered to be displaying normal behavior or within expected range.
- 2nd Square (2SD): Encapsulates those with Z-Scores within ±2 standard deviations. Symbols within this boundary, but outside the 1 SD square, indicate a moderate deviation from the norm.
- 3rd Square (3SD): Represents symbols with Z-Scores within ±3 standard deviations. Any symbol outside this square is deemed to be a significant outlier, exhibiting extreme behavior in terms of either its price, its volume, or both.
By assessing the position of symbols relative to these squares, traders can swiftly identify which assets are behaving typically and which are showing unusual activity. This visualization simplifies the process of spotting potential outliers or unique trading opportunities within the market. The farther a symbol is from the center, the more it deviates from its typical behavior.
◽️ Display Type: Columns
In this visualization, z-scores are represented using columns, where each symbol is presented horizontally. Each symbol has two distinct nodes:
- Left Node: Represents the z-score of volume.
- Right Node: Represents the z-score of price.
The height of these nodes can vary along the y-axis between -4 and 4, based on the z-score value:
- Large Positive Columns: Signify a high or positive z-score, indicating that the price or volume is significantly above its average.
- Large Negative Columns: Represent a low or negative z-score, suggesting that the price or volume is considerably below its average.
- Short Columns Near 0: Indicate that the price or volume is close to its mean, showcasing minimal deviation.
This columnar representation provides a clear, intuitive view of how each symbol's price and volume deviate from their respective averages.
◽️ Display Type: Circles
In this visualization style, z-scores are depicted using circles. Each symbol is horizontally aligned and represented by:
- Solid Circle: Represents the z-score of price.
- Transparent Circle: Represents the z-score of volume.
The vertical position of these circles on the y-axis ranges between -4 and 4, reflecting the z-score value:
- Circles Near the Top: Indicate a high or positive z-score, suggesting the price or volume is well above its average.
- Circles Near the Bottom: Represent a low or negative z-score, pointing to the price or volume being notably below its average.
- Circles Around the Midline (0): Highlight that the price or volume is close to its mean, with minimal deviation.
◽️ Display Type: Delta Columns
There's also an option to utilize Z-Score Delta Columns. For each symbol, a single column is presented, depicting the difference between the z-score of price and the z-score of volume.
The z-score delta essentially captures the disparity between how much the price and volume deviate from their respective mean:
- Positive Delta: Indicates that the z-score of price is greater than the z-score of volume. This suggests that the price has deviated more from its average than the volume has from its own average. Such a scenario could point to price movements being more significant or pronounced compared to the changes in volume.
- Negative Delta: Represents that the z-score of volume is higher than the z-score of price. This might mean that there are substantial volume changes, yet the price hasn't moved as dramatically. This can be indicative of potential build-up in trading interest without an equivalent impact on price.
- Delta Close to 0: Means that the z-scores for price and volume are almost equal, indicating their deviations from the average are in sync.
◽️ Display Type: Z-Volume/Z-Price Heatmap
This visualization offers a heatmap either for volume z-scores or price z-scores across all symbols. Here's how it's presented:
Each symbol is allocated its own horizontal row. Within this row, bar-by-bar data is displayed using a color gradient to represent the z-score values. The heatmap employs a user-defined gradient scale, where a chosen "cold" color represents low z-scores and a chosen "hot" color signifies high z-scores. As the z-score increases or decreases, the colors transition smoothly along this gradient, providing an intuitive visual indication of the z-score's magnitude.
- Cold Colors: Indicate values significantly below the mean (negative z-score)
- Mild Colors: Represent values close to the mean, suggesting minimal deviation.
- Hot Colors: Indicate values significantly above the mean (positive z-score)
This heatmap format provides a rapid, visually impactful means to discern how each symbol's price or volume is behaving relative to its average. The color-coded rows allow you to quickly spot outliers.
VOLUME TYPE
The "Volume Type" input allows you to choose the nature of volume data that will be factored into the volume z-score calculation. The interpretation of indicator’s data changes based on this input. You can opt between:
- Volume (Regular Volume): This is the classic measure of trading volume, which represents the volume traded in a given time period - bar.
- OBV (On-Balance Volume): OBV is a momentum indicator that accumulates volume on up bars and subtracts it on down bars, making it a cumulative indicator that sort of measures buying and selling pressure.
Interpretation Implications:
- For Volume Type: Regular Volume:
Positive Z-Score: Indicates that the trading volume is above its average, meaning there's unusually high trading activity .
Negative Z-Score: Suggests that the trading volume is below its average, signifying unusually low trading activity.
- For Volume Type: OBV:
Positive Z-Score: Signifies that “buying pressure” is above its average.
Negative Z-Score: Signifies that “selling pressure” is above its average.
When comparing Z-Score of OBV to Z-Score of price, we can observe several scenarios. If Z-Price and Z-Volume are convergent (have similar z-scores), we can say that the directional price movement is supported by volume. If Z-Price and Z-Volume are divergent (have very different z-scores or one of them being zero), it suggests a potential misalignment between price movement and volume support, which might hint at possible reversals or weakness.

Multi-Asset Performance [Spaghetti] - By LeviathanThis indicator visualizes the cumulative percentage changes or returns of 30 symbols over a given period and offers a unique set of tools and data analytics for deeper insight into the performance of different assets.
Multi Asset Performance indicator (also called “Spaghetti”) makes it easy to monitor the changes in Price, Open Interest, and On Balance Volume across multiple assets simultaneously, distinguish assets that are overperforming or underperforming, observe the relative strength of different assets or currencies, use it as a tool for identifying mean reversion opportunities and even for constructing pairs trading strategies, detect "risk-on" or "risk-off" periods, evaluate statistical relationships between assets through metrics like correlation and beta, construct hedging strategies, trade rotations and much more.
Start by selecting a time period (e.g., 1 DAY) to set the interval for when data is reset. This will provide insight into how price, open interest, and on-balance volume change over your chosen period. In the settings, asset selection is fully customizable, allowing you to create three groups of up to 30 tickers each. These tickers can be displayed in a variety of styles and colors. Additional script settings offer a range of options, including smoothing values with a Simple Moving Average (SMA), highlighting the top or bottom performers, plotting the group mean, applying heatmap/gradient coloring, generating a table with calculations like beta, correlation, and RSI, creating a profile to show asset distribution around the mean, and much more.
One of the most important script tools is the screener table, which can display:
🔸 Percentage Change (Represents the return or the percentage increase or decrease in Price/OI/OBV over the current selected period)
🔸 Beta (Represents the sensitivity or responsiveness of asset's returns to the returns of a benchmark/mean. A beta of 1 means the asset moves in tandem with the market. A beta greater than 1 indicates the asset is more volatile than the market, while a beta less than 1 indicates the asset is less volatile. For example, a beta of 1.5 means the asset typically moves 150% as much as the benchmark. If the benchmark goes up 1%, the asset is expected to go up 1.5%, and vice versa.)
🔸 Correlation (Describes the strength and direction of a linear relationship between the asset and the mean. Correlation coefficients range from -1 to +1. A correlation of +1 means that two variables are perfectly positively correlated; as one goes up, the other will go up in exact proportion. A correlation of -1 means they are perfectly negatively correlated; as one goes up, the other will go down in exact proportion. A correlation of 0 means that there is no linear relationship between the variables. For example, a correlation of 0.5 between Asset A and Asset B would suggest that when Asset A moves, Asset B tends to move in the same direction, but not perfectly in tandem.)
🔸 RSI (Measures the speed and change of price movements and is used to identify overbought or oversold conditions of each asset. The RSI ranges from 0 to 100 and is typically used with a time period of 14. Generally, an RSI above 70 indicates that an asset may be overbought, while RSI below 30 signals that an asset may be oversold.)
⚙️ Settings Overview:
◽️ Period
Periodic inputs (e.g. daily, monthly, etc.) determine when the values are reset to zero and begin accumulating again until the period is over. This visualizes the net change in the data over each period. The input "Visible Range" is auto-adjustable as it starts the accumulation at the leftmost bar on your chart, displaying the net change in your chart's visible range. There's also the "Timestamp" option, which allows you to select a specific point in time from where the values are accumulated. The timestamp anchor can be dragged to a desired bar via Tradingview's interactive option. Timestamp is particularly useful when looking for outperformers/underperformers after a market-wide move. The input positioned next to the period selection determines the timeframe on which the data is based. It's best to leave it at default (Chart Timeframe) unless you want to check the higher timeframe structure of the data.
◽️ Data
The first input in this section determines the data that will be displayed. You can choose between Price, OI, and OBV. The second input lets you select which one out of the three asset groups should be displayed. The symbols in the asset group can be modified in the bottom section of the indicator settings.
◽️ Appearance
You can choose to plot the data in the form of lines, circles, areas, and columns. The colors can be selected by choosing one of the six pre-prepared color palettes.
◽️ Labeling
This input allows you to show/hide the labels and select their appearance and size. You can choose between Label (colored pointed label), Label and Line (colored pointed label with a line that connects it to the plot), or Text Label (colored text).
◽️ Smoothing
If selected, this option will smooth the values using a Simple Moving Average (SMA) with a custom length. This is used to reduce noise and improve the visibility of plotted data.
◽️ Highlight
If selected, this option will highlight the top and bottom N (custom number) plots, while shading the others. This makes the symbols with extreme values stand out from the rest.
◽️ Group Mean
This input allows you to select the data that will be considered as the group mean. You can choose between Group Average (the average value of all assets in the group) or First Ticker (the value of the ticker that is positioned first on the group's list). The mean is then used in calculations such as correlation (as the second variable) and beta (as a benchmark). You can also choose to plot the mean by clicking on the checkbox.
◽️ Profile
If selected, the script will generate a vertical volume profile-like display with 10 zones/nodes, visualizing the distribution of assets below and above the mean. This makes it easy to see how many or what percentage of assets are outperforming or underperforming the mean.
◽️ Gradient
If selected, this option will color the plots with a gradient based on the proximity of the value to the upper extreme, zero, and lower extreme.
◽️ Table
This section includes several settings for the table's appearance and the data displayed in it. The "Reference Length" input determines the number of bars back that are used for calculating correlation and beta, while "RSI Length" determines the length used for calculating the Relative Strength Index. You can choose the data that should be displayed in the table by using the checkboxes.
◽️ Asset Groups
This section allows you to modify the symbols that have been selected to be a part of the 3 asset groups. If you want to change a symbol, you can simply click on the field and type the ticker of another one. You can also show/hide a specific asset by using the checkbox next to the field.

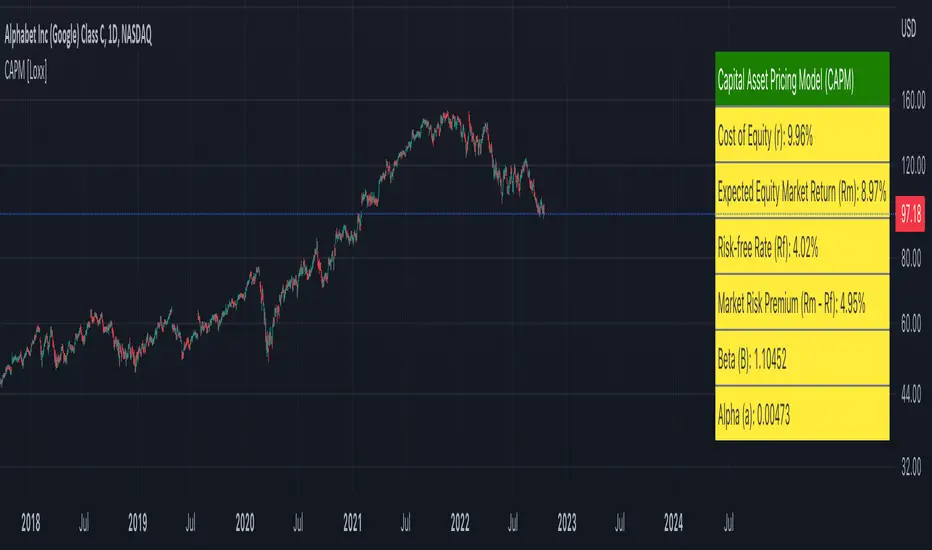
Capital Asset Pricing Model (CAPM) [Loxx]Capital Asset Pricing Model (CAPM) demonstrates how to calculate the Cost of Equity for an underlying asset using Pine Script. This script will only work on the monthly timeframe. While you can change the default inputs, you should study what CAPM is and how this works before doing so. This indicator pulls various types of data from SPY from various timeframes to calculate risk-free rates, market premiums, and log returns. Alpha and Beta are computed using the regression between underlying asset and SPY. This indicator only calculates on the most recent data. If you wish to change this, you'll have to save the script and make adjustments. A few examples where CAPM is used:
Used as the mu factor Geometric Brownian Motion models for options pricing and forecasting price ranges and decay
Calculating the Weighted Average Cost of Capital
Asset pricing
Efficient frontier
Risk and diversification
Security market line
Discounted Cashflow Analysis
Investment bankers use CAPM to value deals
Account firms use CAPM to verify asset prices and assumptions
Real estate firms use variations of CAPM to value properties
... and more
Details of the calculations used here
Rm is calculated using yearly simple returns data from SPY, typically this is just hard coded as 10%.
Rf is pulled from US 10 year bond yields
Beta and Alpha are pulled form monthly returns data of the asset and SPY
In the past, typically this data is purchased from investments banks whose research arms produce values for beta, alpha, risk free rate, and risk premiums. In 2022 ,you can find free estimates for each parameter but these values might not reflect the most current data or research.
History
The CAPM was introduced by Jack Treynor (1961, 1962), William F. Sharpe (1964), John Lintner (1965) and Jan Mossin (1966) independently, building on the earlier work of Harry Markowitz on diversification and modern portfolio theory. Sharpe, Markowitz and Merton Miller jointly received the 1990 Nobel Memorial Prize in Economics for this contribution to the field of financial economics. Fischer Black (1972) developed another version of CAPM, called Black CAPM or zero-beta CAPM, that does not assume the existence of a riskless asset. This version was more robust against empirical testing and was influential in the widespread adoption of the CAPM.
Usage
The CAPM is used to calculate the amount of return that investors need to realize to compensate for a particular level of risk. It subtracts the risk-free rate from the expected rate and weighs it with a factor – beta – to get the risk premium. It then adds the risk premium to the risk-free rate of return to get the rate of return an investor expects as compensation for the risk. The CAPM formula is expressed as follows:
r = Rf + beta (Rm – Rf) + Alpha
Therefore,
Alpha = R – Rf – beta (Rm-Rf)
Where:
R represents the portfolio return
Rf represents the risk-free rate of return
Beta represents the systematic risk of a portfolio
Rm represents the market return, per a benchmark
For example, assuming that the actual return of the fund is 30, the risk-free rate is 8%, beta is 1.1, and the benchmark index return is 20%, alpha is calculated as:
Alpha = (0.30-0.08) – 1.1 (0.20-0.08) = 0.088 or 8.8%
The result shows that the investment in this example outperformed the benchmark index by 8.8%.
The alpha of a portfolio is the excess return it produces compared to a benchmark index. Investors in mutual funds or ETFs often look for a fund with a high alpha in hopes of getting a superior return on investment (ROI).
The alpha ratio is often used along with the beta coefficient, which is a measure of the volatility of an investment. The two ratios are both used in the Capital Assets Pricing Model (CAPM) to analyze a portfolio of investments and assess its theoretical performance.
To see CAPM in action in terms of calculate WACC, see here for an example: finbox.com
Further reading
en.wikipedia.org
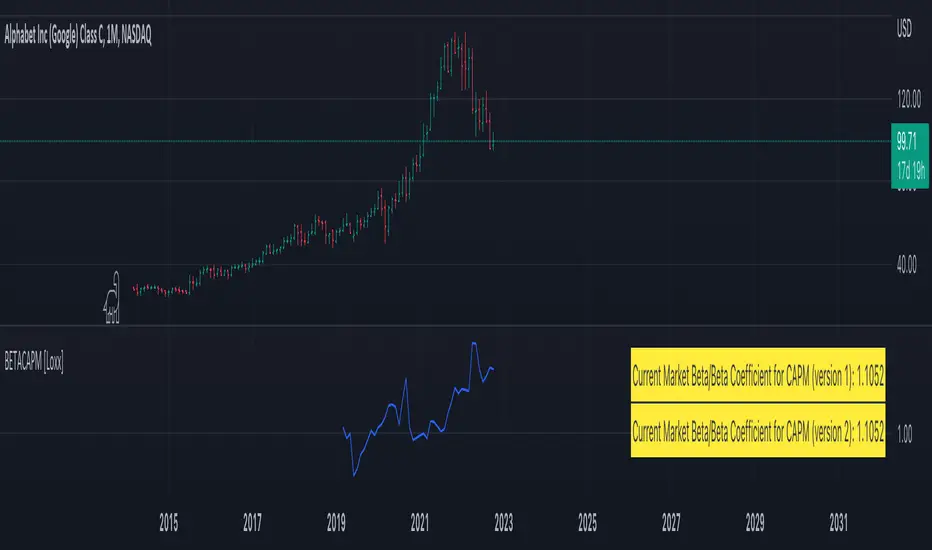
Market Beta/Beta Coefficient for CAPM [Loxx]Market Beta/Beta Coefficient for CAPM is not so much an indicator as it is a value to be used in future indicators to forecast stock prices using the Capital Asset Pricing Model, CAPM. CAPM is used by the likes of value investors such as Warren Buffet and valuation/accounting/investment banking firms. More specifically, CAPM is typically used in Discounted Cashflow Analysis to value revenue generating assets.
What is Beta?
In finance, the beta (β or market beta or beta coefficient) is a measure of how an individual asset moves (on average) when the overall stock market increases or decreases. Thus, beta is a useful measure of the contribution of an individual asset to the risk of the market portfolio when it is added in small quantity. Thus, beta is referred to as an asset's non-diversifiable risk, its systematic risk, market risk, or hedge ratio. Beta is not a measure of idiosyncratic risk.
By definition, the value-weighted average of all market-betas of all investable assets with respect to the value-weighted market index is 1. If an asset has a beta above (below) 1, it indicates that its return moves more (less) than 1-to-1 with the return of the market-portfolio, on average. In practice, few stocks have negative betas (tending to go up when the market goes down). Most stocks have betas between 0 and 3.
How to calculate Beta
To calculate beta you typically choose 5 years of monthly data; typically SPY is used here
Calculate log returns of both the asset for which you are calculating Beta and the benchmark market data
Calculation the covariance between the asset and benchmark
Calculate the variance of the benchmark returns
Divide the covariance by the variance
Read more here:
en.wikipedia.org(finance)
en.wikipedia.org
einvestingforbeginners.com
L_BetaLibrary "L_Beta"
TODO: add library description here
length()
beta()
simple_beta()
index_selector()

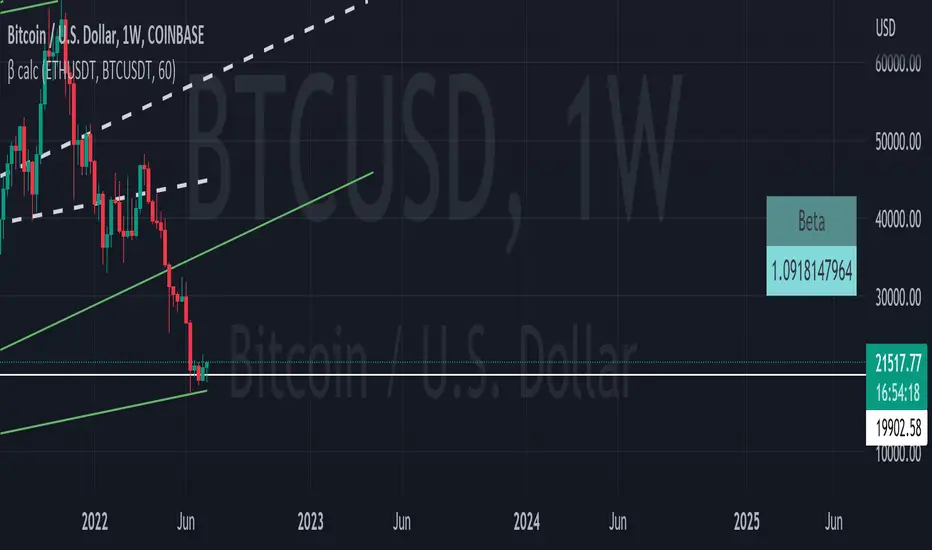
Beta CalculatorBeta is a measure of an asset's volatility relative to the market (the S&P500 is the most widely used index for this). A beta of 1 indicates that the asset moves exactly like the market, a beta < 1 indicates that the asset is less volatile than the market, and a beta > 1 means that the asset amplifies market movements.
This tool is used to calculate easily the Beta coefficient of an asset using 4 parameters :
- Symbol : The Asset's Ticker
- Reference : The Market Index Ticker
- Lookback Candles : The number of candles to include in the calculation
- (Implict) Resolution : The timeframe you are using, defines the precision
regressLibrary "regress"
produces the slope (beta), y-intercept (alpha) and coefficient of determination for a linear regression
regress(x, y, len) regress: computes alpha, beta, and r^2 for a linear regression of y on x
Parameters:
x : the explaining (independent) variable
y : the dependent variable
len : use the most recent "len" values of x and y
Returns: : alpha is the x-intercept, beta is the slope, an r2 is the coefficient of determination
Note: the chart does not show anything, use the return values to compute model values in your own application, if you wish.

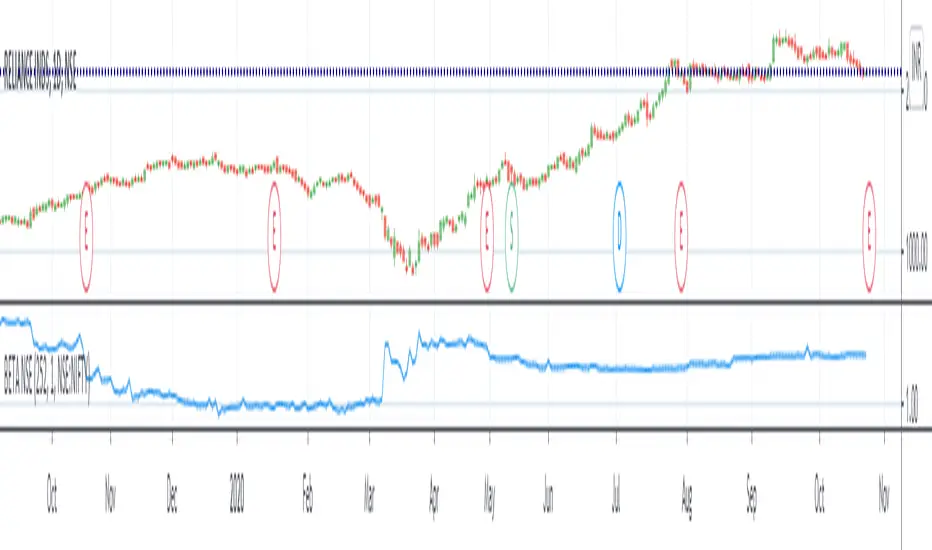
Market Movers: Sectoral IndexThe indicator will show the Sectors which are leading or lagging NIFTY50 index based on Alpha & Beta values. Stock selection can be done based on the respective Sectors.
Look for alpha & beta values.
Prefer one with high beta.
Greens are leaders & Blues are lagers.
This don't completely indicates a trend, but it can give the overview of a major trend & market movers.
Gray line is the base index NIFTY50, it is Zero.
Turn on Indicator Name Label in Settings > Chart Settings.
In intraday or positions, in a leading Sector there will be a leading stock, spot it out.
Make a sector wise watchlist of stocks.
Use higher or Daily timeframe for Swing trades.
Detailed descriptions are available in my previous Alpha & Beta indicators.

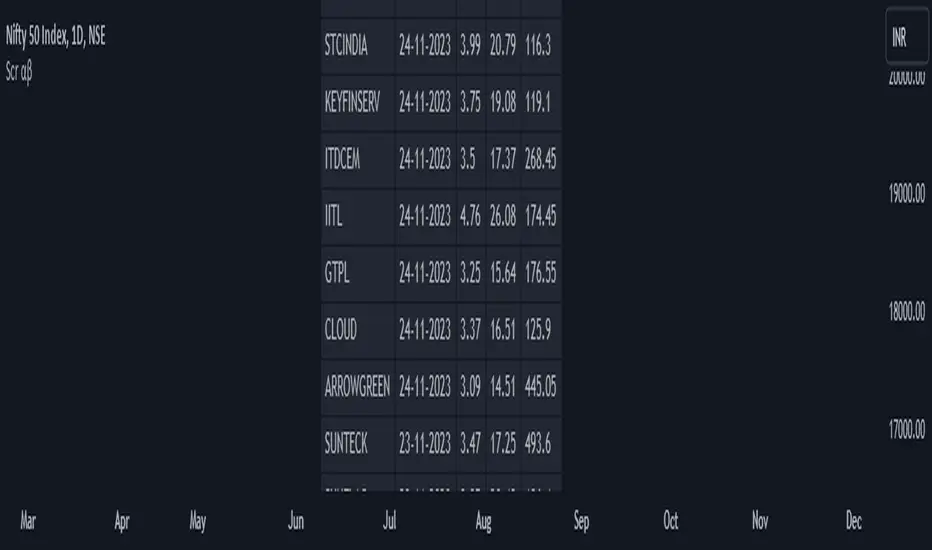
Screener: Alpha & Beta IndexThis is a Index Screener which can short list the major Sectors contributing to NIFTY movement that day.
This helps in sector based trading, in which we can trade in the stocks which falls under that particular sector.
No need to roam around all the stocks in the whole watchlist.
It is recommended to create sector wise watchlist of all sectors. It will be easier to concentrate in only one sector.
For example in IT sector index there are certain stocks which contribute to the movement of IT sector.
This will be available in NSE (or exchange website).
For detailed description check out the descriptions in my previous 2 Alpha and Beta indicators.
Combine and use this screener with my previous Alpha & Beta indicator.

Screener: Alpha & BetaThis is a Live Screener for my previous Alpha & Beta indicator, which filters stocks lively based on the given values.
Use 5min timeframe for Live Intraday.
The default stocks in the screener is selected based on high beta value from F&O listed stocks. It may include other stocks also.
User can input stocks of your choice either through the menu or through the Pine editor.
The maximum number of stocks inputs is only 40. The indicator includes only 20 stocks by default.
More number of stocks can be added but it makes the screener slower to load.
Open the indicator in a sperate tab or window to avoided the loading lag.
It is recommended to choose only 10 to 20 stocks based on the weightage from each sectors.
Beta values are dynamic. It changes from day to day based on the trend and sector.
Update the sock list weekly or twice a week or monthly.
Use investing.com screener(preferably) or TradingView screener for shortlisting beta stocks.
Remember that majority of indicators fails in a sideways market, also every indicator is not 100% accurate.
Alpha & BetaHow to use Alpha(α)?
If Alpha is positive the stock outperforms, if the value is negative means the stock underperforms.
α < 0: The investment has earned too little for its risk (or, was too risky for the return)
α = 0: The investment has earned a return adequate for the risk taken
α > 0: The investment has a return in excess of the reward for the assumed risk
How to use Beta(β)?
β = 1: Exactly as volatile as the index
β > 1: More volatile than the index
β < 1 > 0: Less volatile than the index
β = 0: Uncorrelated to the index
β < 0: Negatively correlated to the index
β > 2: Trending stock
Higher the β higher risk/reward
Example: If the beta is 1.1, the share price is like to move by 10% more than the index
Trading Tip
Choose a stock with Alpha greater than 0 and Beta greater than 1.9 for intraday in 5min timeframe for long positions
Remember that such stocks will have high risk and high reward
Shortlist stocks with Beta greater than 1.9 for next day in 5min timeframe

Statistical and Financial MetricsGood morning traders!
This time I want to share with you a little script that, thanks to the use of arrays, allows you to have interesting statistical and financial insights taken from the symbol on chart and compared to those of another symbol you desire (in this case the metrics taken from the perpetual future ETHUSDT are compared to those taken from the perpetual future BTCUSDT, used as a proxy for the direction of cryptocurrency market)
By enabling "prevent repainting", the data retrieved from the compared symbol won't be on real time but they will static since they will belong to the previous closed candle
Here are the metrics you can have by storing data from a variable period of candles (by default 51):
✓ Variance (of the symbol on chart in GREEN; of the compared symbol in WHITE)
✓ Standard Deviation (of the symbol on chart in OLIVE; of the compared symbol in SILVER)
✓ Yelds (of the symbol on chart in LIME; of the compared symbol in GRAY) → yelds are referred to the previous close, so they would be calculated as the the difference between the current close and the previous one all divided by the previous close
✓ Covariance of the two datasets (in BLUE)
✓ Correlation coefficient of the two datasets (in AQUA)
✓ β (in RED) → this insight is calculated in three alternative ways for educational purpose (don't worry, the output would be the same).
WHAT IS BETA (β)?
The BETA of an asset can be interpretated as the representation (in relative terms) of the systematic risk of an asset: in other terms, it allows you to understand how big is the risk (not eliminable with portfolio diversification) of an asset based on the volatilty of its yelds.
We say that this representation is made in relative terms since it is expressed according to the market portfolio: this portfolio is hypothetically the portfolio which maximizes the diversification effects in order to kill all the specific risk of that portfolio; in this way the standard deviation calculated from the yelds of this portfolio will represent just the not-eliminable risk (the systematic risk), without including the eliminable risk (the specific risk).
The BETA of an asset is calculated as the volatilty of this asset around the volatilty of the market portfolio: being more precise, it is the covariance between the yelds of the current asset and those of the market portfolio all divided by the variance of the yelds of market portfolio.
Covariance is calculated as the product between correlation coefficient, standard deviation of the first dataset and standard deviation of the second asset.
So, as the correlation coefficient and the standard deviation of the yelds of our asset increase (it means that the yelds of our asset are very similiar to those of th market portfolio in terms of sign and intensity and that the volatility of these yelds is quite high), the value of BETA increases as well
According to the Capital Asset Pricing Model (CAPM) promoted by William Sharpe (the guy of the "Sharpe Ratio") and Harry Markowitz, in efficient markets the yeld of an asset can be calculated as the sum between the risk-free interest rate and the risk premium. The risk premium of the specific asset would be the risk premium of the market portfolio multiplied with the value of beta. It is simple: if the volatility of the yelds of an asset around the yelds of market protfolio are particularly high, investors would ask for a higher risk premium that would be translated in a higher yeld.
In this way the expected yeld of an asset would be calculated from the linear expression of the "Security Market Line": r_i = r_f + β*(r_m-r_f)
where:
r_i = expected yeld of the asset
r_f = risk free interest rate
β = beta
r_m = yeld of market portfolio
I know that considering Bitcoin as a proxy of the market portfolio involved in the calculation of Beta would be an inaccuracy since it doesn't have the property of maximum diversification (since it is a single asset), but there's no doubt that it's tying the prices of altcoins (upward and downward) thanks to the relevance of its dominance in the capitalization of cryptocurrency market. So, in the lack of a good index of cryptocurrencies (as the FTSE MIB for the italian stock market), and as long the dominance of Bitcoin will persist with this intensity, we can use Bitcoin as a proxy of the market portfolio

BETA (against any benchmark index - defaulted to NSE:NIFTY)Beta value of a stock relative to benchmark index. Thanks to Ricardo Santos for the original script. This script is adapted from it.
To understand beta, refer Investopedia link: www.investopedia.com
A beta value of 1 means the stock is directly correlated to benchmark index - volatility would be same as overall market.
Beta value less than 1 and greater than 0 means the stock is less volatile than the market.
Beta value more than 1 would mean the stock is more volatile than the market.
A beta value of 1.2 would roughly translate to the stock being 20% more volatile than the overall market.
A negative beta value indicates the stock is inversely correlated to market.
In the example chart, you can see the Beta value change in NSE:RELIANCE with respect to NSE:NIFTY.