Inverse VIX / Custom Inverse Line🎯 Main Idea
This indicator creates a line that moves opposite to the VIX (Volatility Index) — or any symbol you choose.
When VIX rises (fear increases), → this line goes down.
When VIX falls (market calm), → this line goes up.
It helps you visually understand market sentiment — calm periods (bullish) vs fear periods (bearish).
⚙️ Input Settings
Setting Description
Symbol to invert The symbol to invert. Default is CBOE:VIX.
Inverse mode The method used to invert the values. There are 3 options:
① Negate Simply flips the sign (multiplies by -1). Very straightforward.
② Reciprocal Uses the mathematical inverse (1 ÷ value). High values become smaller, and vice versa.
③ Inverse Normalized The most useful mode 🔥 — normalizes values between 0–100 and flips them, similar to an RSI.
Normalization lookback How many bars to use for normalization (default 252 = roughly one trading year).
Smoothing (SMA) Number of bars for smoothing (makes the line smoother).
Use log for reciprocal Uses logarithmic scaling to stabilize big swings.
Plot color / width Customize the line’s color and thickness.
Show original source If enabled, shows the original VIX line for comparison.
📈 How It Works
The script fetches the close price of the VIX (or your chosen symbol).
It applies the selected inversion method.
The inverted line is plotted on the chart.
In “Inverse Normalized” mode:
The range is 0–100.
Values above 75 = high optimism (market often overheated).
Values below 25 = high fear (potential buying opportunity).
A middle line at 50 marks neutral sentiment.
⚠️ Alerts
The indicator includes two default alerts when using “Inverse Normalized” mode:
🔔 Above 75: Market showing strong optimism (potential top or correction zone).
🔔 Below 25: Market showing fear (potential bottom or buy signal).
🧠 How to Use It
Use it on daily or weekly charts for clearer signals.
Compare it with SPX or NASDAQ:
When the Inverse VIX line rises, markets often go up.
When it falls, markets usually drop or consolidate.
Combine it with other indicators (e.g., RSI, MACD) for confirmation.
比爾威廉指標

Bala RSI + BLOCKSThis indicator combines RSI momentum analysis with order block detection to highlight high-probability reversal and continuation zones. It’s designed for traders who want to align institutional footprints with momentum exhaustion or strength.
✅ Key Features
Automatic Order Block Detection
Identifies bullish and bearish order blocks based on price structure shifts and liquidity zones.
RSI-Driven Confirmation
Uses RSI to filter or validate order blocks (e.g., oversold for bullish zones, overbought for bearish zones).
Clear Visual Marking
Highlights order blocks directly on the chart for quick decision-making.
Works Across Timeframes
Suitable for intraday, swing, and positional strategies.
🎯 Use Cases
Spot potential reversal zones with RSI confluence
Confirm order blocks with momentum exhaustion
Combine with price action for refined entries/exits
⚠️ Disclaimer
This tool is for educational and analytical use only. It does not constitute financial advice. Always combine with your own strategy and risk management.

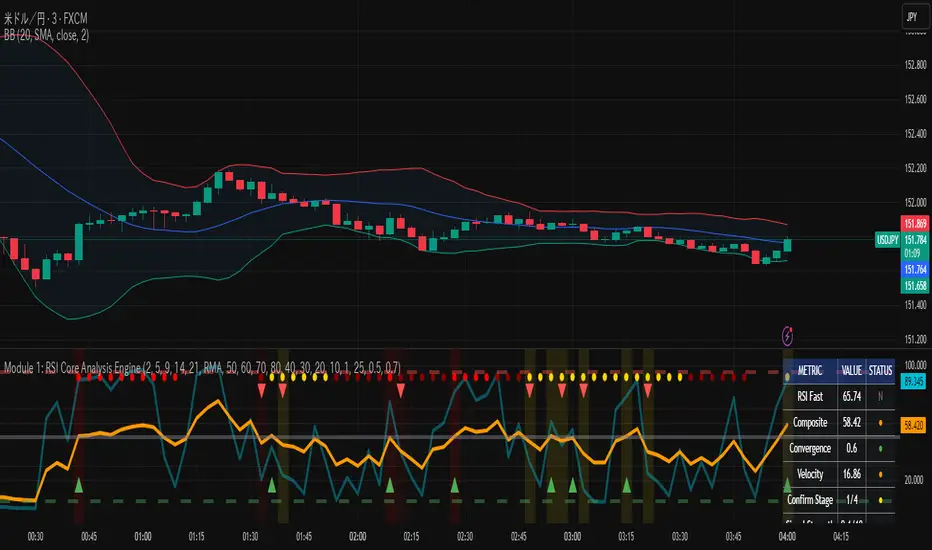
RSI Core Analysis EngineHI traders
This tool employs a higher-sensitivity RSI than conventional settings to capture market shifts earlier.
When the Ultra Fast RSI (UF) approaches upper or lower extremes, short-term profit-taking or pullbacks tend to occur, and a crossover between UF and the Composite RSI can serve as a signal of a regime change.
However, in strong trends the RSI can remain pinned for extended periods, so combine it with ADX, volume, and volatility measures to improve accuracy.
While early detection is an advantage, it also increases noise. This tool uses a four-stage confirmation process (DMI/ADX → MACD/Stochastics/RSI acceleration → five-layer alignment) and quality/confidence scores to filter for higher-expectancy setups.
It will not be effective in every market condition. Use it with predefined stop-losses and prudent position sizing.
-------------------------------------------------------------------------------------------------------
Strongly recommended preset (because the indicator packs many features):
Step 1 — Inputs tab
Center Level: 50
OB1: 60, OB2: 70, OB3: 95
OS1: 40, OS2: 30, OS3: 5
Step 2 — Style tab
✅ Ultra Fast RSI — Thickest
✖ Fast RSI
✖ Medium RSI
✖ Standard RSI
✖ Slow RSI
✅ Composite RSI — Thickest
✅ Stage Indicator
✖ RSI Velocity
✖ RSI Acceleration
✅ Quality Score
✅ Bullish Cross
✅ Bearish Cross
✅ Strong Signal Background
Levels:
・✅ Center 50 — Thickest
・✅ OB1 60, OB2 70, OB3 95 (thicker)
・✅ OS1 40, OS2 30, OS3 5 (thicker)
-------------------------------------------------------------------------------------------------------------
thats enough
have a nice trade
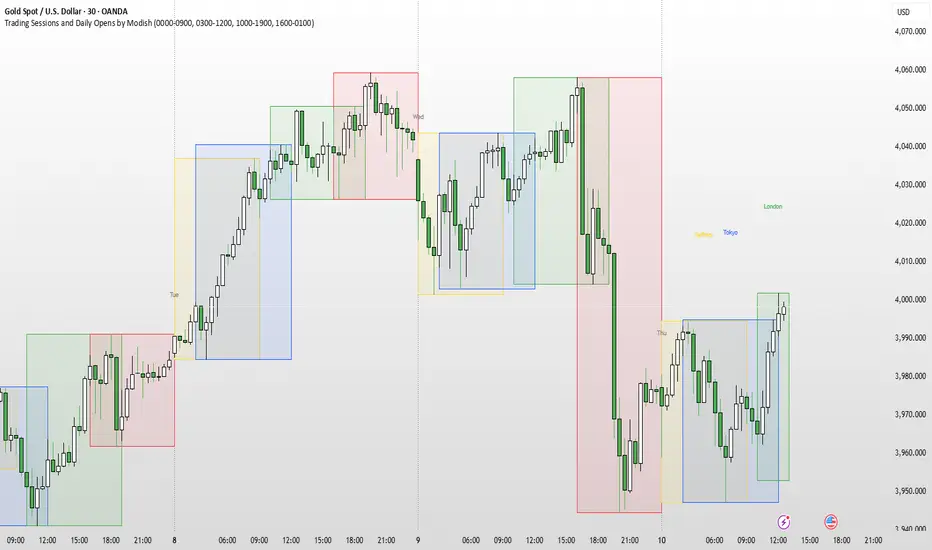
Trading Sessions and Daily Opens by ModishThis Pine Script indicator overlays key forex trading sessions (Sydney, Tokyo, London, New York) on your chart using Kenyan time (EAT/UTC+3), with customizable translucent boxes, borders, and labels positioned neatly above each session for clear visualization. It also plots dotted vertical lines at daily opens (Monday-Friday) with abbreviated day labels for quick reference. Toggle sessions on/off, adjust colors, and ensure seamless integration with candlesticks for dynamic, real-time analysis. Ideal for session-based traders seeking precise timing and structure.
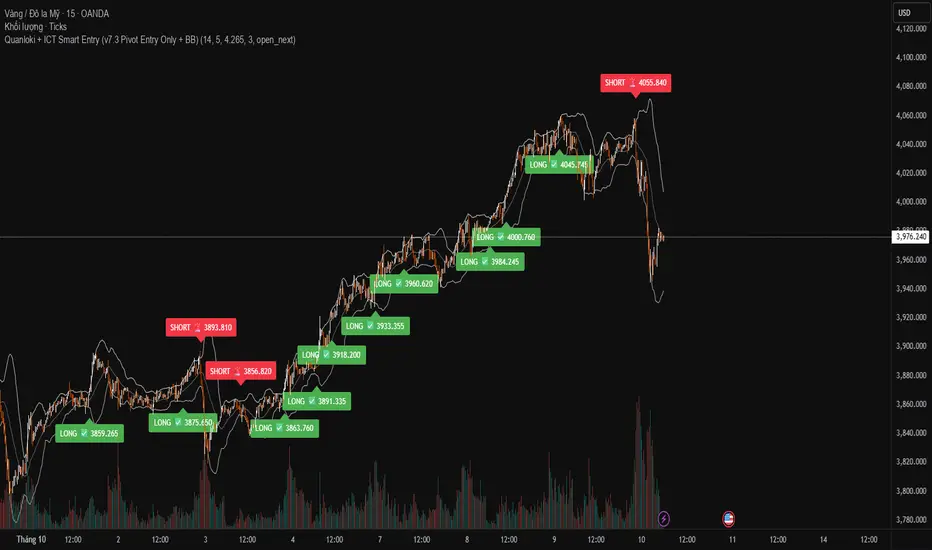
Quanloki + ICT Smart Entry (v7.3 Pivot Entry Only + BB)If you need a signal group or team, please contact @quanloki or tele to get support and refund for the VIP group.
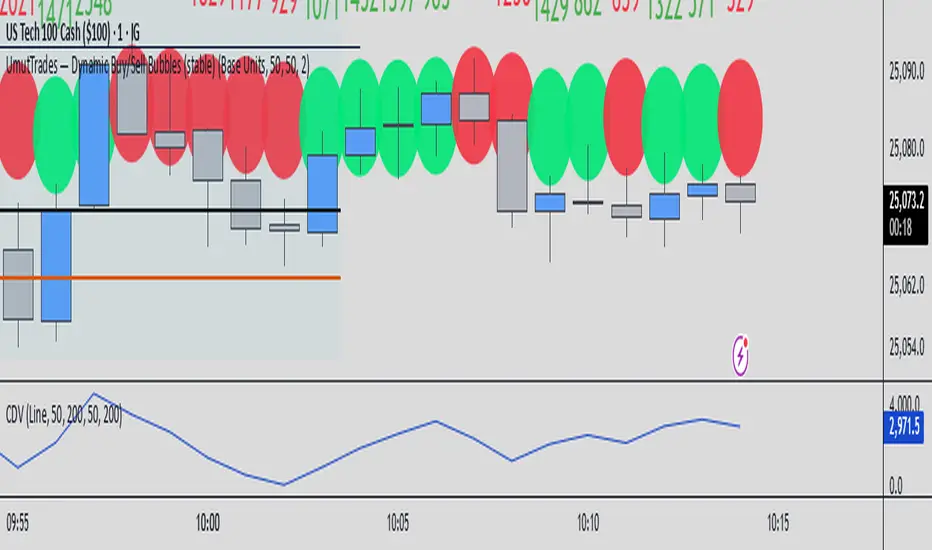
UmutTrades — Dynamic Buy/Sell Bubbles (stable)This indicator detects large buy and sell transactions based on user-defined thresholds (either in base units or quote value).
It places colored bubbles on the chart where those big orders occur green for buys and red for sells with the bubble’s color intensity and size reflecting how large the order is relative to your threshold.
Williams Alligator Spread Oscillator (WASO)Short description (About box)
Williams Alligator Spread Oscillator (WASO) converts Bill Williams’ Alligator into a 0–100 oscillator that measures the average distance between Lips/Teeth/Jaw relative to ATR. High = expansion/trend (default), low = compression/range — making sideways markets easier to spot. Includes adaptive normalization, configurable thresholds, background shading, and alerts.
Full description (Description field)
What it does
The Williams Alligator Spread Oscillator (WASO) transforms Bill Williams’ Alligator into a single, adaptive 0–100 scale. It computes the average pairwise distance among the Alligator lines (Lips/Teeth/Jaw), normalizes it by ATR and a rolling min–max window, and smooths the result. This makes the signal robust across symbols and timeframes and explicitly improves detection of sideways (ranging) conditions by highlighting compression regimes.
Why it helps
Sideways detection made easier: Low WASO marks compressed regimes that commonly align with consolidation/range phases, helping you identify chop and plan breakout strategies.
Trend/expansion clarity: High WASO indicates the Alligator lines are widening relative to volatility, pointing to trending or expanding conditions.
You can flip the direction if you prefer “High = Range.”
How it is calculated (plain English)
Smooth price with RMA (SMMA-like) to get Jaw, Teeth, Lips.
Compute the average pairwise distance between these three lines.
Divide by ATR to remove price-scale effects.
Normalize with a rolling min–max window to map values to 0–100.
Optionally apply EMA smoothing to the oscillator.
Key settings
Jaw/Teeth/Lips Lengths: Alligator periods (SMMA-like via ta.rma).
ATR Length: Volatility benchmark for scaling.
Normalization Lookback: Longer = steadier; shorter = more responsive.
Smoothing (EMA): Evens out noise.
High Value = Large Spread (Trend): Toggle to invert semantics.
Upper/Lower Thresholds: 70/30 are practical starting points.
Signals / interpretation
Sideways / Compression (easier to spot):
Default direction: WASO below Lower Threshold (e.g., <30).
With inverted direction OFF: WASO above Upper Threshold (e.g., >70).
Trend / Expansion:
Default direction: WASO above Upper Threshold (e.g., >70).
With inverted direction OFF: WASO below Lower Threshold (e.g., <30).
Midline (50): Neutral zone; flips around 50 can hint at regime shifts.
Alerts included
Range Start (sideways/compression)
Trend Start (expansion/trend)
Notes & limitations
This implementation omits the classic forward shift of Alligator lines to keep signals usable on live bars.
If market behavior shifts (very quiet or very volatile), tune Lookback and ATR Length.
Combine WASO with breakout levels or momentum filters for entries/exits.
Credits & disclaimer
Inspired by Bill Williams’ Alligator.
For educational purposes only. Not financial advice.
Release Notes (v1.0):
Initial release of Williams-Alligator Spread Oscillator (WASO) with ATR-based scaling and adaptive 0–100 normalization.
Direction toggle (High = Trend by default), adjustable thresholds, background shading, and two alert conditions.

9:30 USA OPENEasy if it go up it will turn green and you can lng if it goes down it will turn red and you can short

BluePrint SessionsBlueprint Sessions is a multi-session visual tool designed to help traders identify the three most important global market opens with precision.
Features:
Adaptive to chart timezone — sessions automatically adjust to the time zone you select in TradingView.
Three Key Market Sessions:
Asian Session
London Session
New York Session

RUDWAN OSMAN MUHUMED redsco trader
this indicator will help you to use ema 9 and ema 20 together with one indicator.

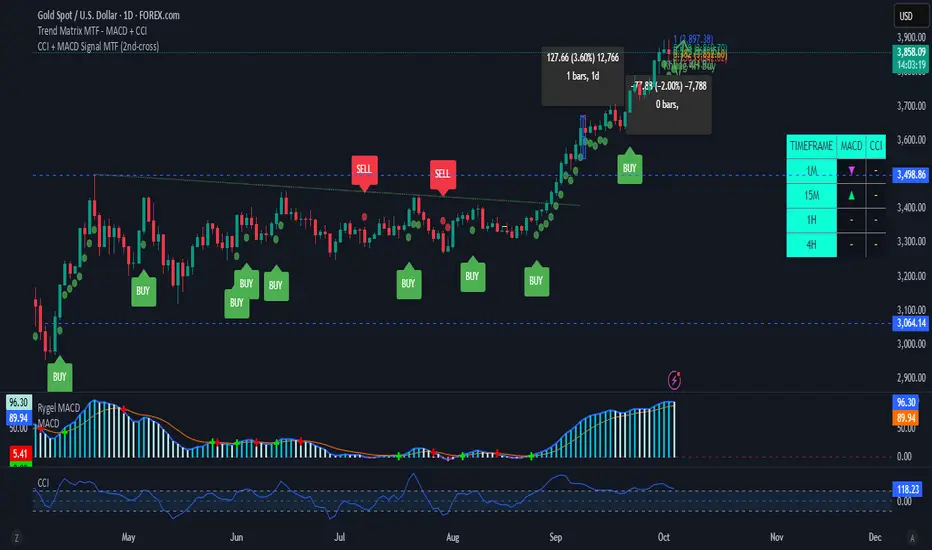
CCI + MACD Signal MTF (2nd-cross)This custom indicator combines the Commodity Channel Index (CCI) and the MACD to generate trading signals.
Basic signals (dots):
A green dot is plotted when CCI is above +100 and MACD is positive.
A red dot is plotted when CCI is below –100 and MACD is negative.
These dots help visualize momentum alignment between the two indicators.
Second-cross signals (text + alert):
The indicator also tracks cycles of the CCI.
When CCI first moves above +100 and later falls back below +100, this is counted as one completed cycle.
The next time CCI crosses back above +100 (the second cross), if MACD is still positive, a “BUY” label is plotted and a buy alert is triggered.
Conversely, when CCI first moves below –100 and later rises back above –100, that is one completed cycle.
The next time CCI crosses back below –100 (the second cross), if MACD is negative, a “SELL” label is plotted and a sell alert is triggered.
Alerts:
Alerts are only fired on the second-cross events (BUY or SELL), making them rarer but potentially more reliable than the basic dot conditions.
Timeframe flexibility:
Both the CCI and the MACD can be calculated on custom timeframes independently of the chart’s timeframe.
Top-CM_EMA Trend Bars with Alerts and Arrows (03102025) v01🟢 Top-CM_EMA Trend Bars with Alerts and Arrows (03102025) v01
🔎 Indicator Overview:
Top-CM_EMA Trend Bars is a technical analysis tool that utilizes an Exponential Moving Average (EMA) to help traders visually identify market trends. It automatically colors the candles based on trend direction and provides real-time alerts and arrows when a potential trend reversal occurs.
⚙️ Key Features:
✅ 1. EMA-Based Trend Detection
Uses a user-defined EMA (default: 34 periods).
If the average price of a candle (hlc3) is above the EMA → trend is considered uptrend (bullish).
If the price is below the EMA → trend is considered downtrend (bearish).
✅ 2. Color-Coded Trend Bars
Candles are automatically colored to reflect the current trend:
🟩 Green (lime): Uptrend
🟥 Red: Downtrend
Helps traders quickly understand the market direction without manual analysis.
✅ 3. Optional EMA Line Display
Users can choose to show or hide the EMA line with a simple toggle (Show EMA Trend is Based On?).
✅ 4. Real-Time Buy/Sell Alerts
Alerts are triggered when the trend changes:
Transition from bearish to bullish → Buy Signal
Transition from bullish to bearish → Sell Signal
Compatible with TradingView’s alert system for automated notifications.
✅ 5. Directional Arrows on Chart
Displays visual markers:
🔼 Up Arrow (green) below the bar on a Buy Signal
🔽 Down Arrow (red) above the bar on a Sell Signal
Makes it easier to spot trend reversal points directly on the chart.
🧠 Who Is This For?
Technical traders looking for quick visual confirmation of trend direction.
Users who want to automate signal detection and receive instant alerts.
Beginners who prefer a clean and straightforward trend-following tool.

EBCLUB 📌 Indicator Summary – XAUUSD (Fano Chart)
This indicator is designed for traders who work with Smart Money (SMC/ICT) concepts and need a clear reading of key levels and market imbalances.
🔑 Key Features:
Daily and Weekly Levels:
Open Day: Opens the daily session to clearly define the range reference.
PDL/PDH (Previous Day Low/High): High-impact levels used as liquidity magnets.
Current Day High (H4 or Intraday): Tracks short-term structures.
Market Sessions (UTC):
Visualizes which session is active (London, New York, Tokyo, Sydney).
Helps identify when volatility tends to increase.
Liquidity Blocks and Institutional Zones:
Indicates areas of imbalance and accumulation (colored rectangles).
Facilitates the identification of possible entries or continuations.

BTC Pro – Modular v6 (Final Version with Clean Labels)A complete Bitcoin charting toolkit built for clarity and decision-making.
✅ EMA levels (21, 50, 200, 800)
✅ Daily EMA 50 (constant across timeframes)
✅ SuperTrend for directional bias
✅ Liquidity zones based on ±2×ATR around SMA50
✅ On-Balance Volume (manual calculation)
✅ ADX trend strength with threshold labeling
✅ RSI divergence detection (bullish/bearish)
✅ Market structure: HH/LL breaks
✅ Entry zones with auto-generated SL/TP boxes
✅ Clean right-side labels (stacked)
✅ Modular toggles for full control via settings
Created by WhyPhy – modular, readable, and ready for live use.

fartbombLinReg fit (history): solid line showing the best-fit linear trend over the last len bars.
Projected offset (visual): same line shifted h bars right so you can see direction.
Future projection (segments): the actual next-h forecast, drawn from the last bar.
Forecast made h bars ago: circle at each bar’s target showing what was predicted h bars earlier.
H / X markers: a hit if that earlier forecast fell inside the bar’s high–low range.

Investorjordann - Script I have developed a script for the BTC pair. I'm currently trialing this...it is using multiple indicators and timeframes to trigger a trade. So far it seems very profitable across many timeframes, but I am still trailing.

EMAs Personalizáveis (até 5)📘 Indicator Explanation – Customizable EMAs (up to 5)
This indicator was developed in Pine Script v6 to make it easier to visualize multiple Exponential Moving Averages (EMAs) on a single chart.
🔑 Main features:
Supports up to 5 different EMAs.
Ability to enable or disable each EMA individually.
Fully customizable period for each EMA.
Flexible color selection for better visual organization.
Adjustable line thickness to highlight the most relevant levels.
📌 How to use:
Open the indicator settings.
Select which EMAs you want to display (from 1 to 5).
Define the period (e.g., 20, 50, 100, 200, etc.).
Choose a color for each EMA.
Observe price behavior relative to the EMAs to identify:
Trends → price above long EMAs indicates bullish strength.
Reversals → EMA crossovers may signal a change in direction.
Dynamic support and resistance → EMAs often act as reaction zones for price.
💡 Practical example:
Short EMA (20) → shows short-term movement.
Mid-term EMA (50 or 100) → confirms trend direction.
Long EMA (200 or 500) → indicates the overall market trend.
👉 This indicator is flexible and can be used for scalping, swing trading, or position trading, depending on the chosen periods.
XAUUSD CSI+RSI+Delta (15m)XAUUSD 15m
Candle Stability Index: 0.4
RSI Index: 80
Candle Delta Length: 6
Disable Repeating Signals: Enabled

1 juicy newXenia BabyBlue is a clean Pine Script indicator designed to keep your chart readable while still giving you the most useful session context. It paints Tokyo, London, and New York as a gentle blue watermark using bgcolor(), so the shading always spans the full pane behind price and never distorts autoscaling. There are no boxes, borders, or labels cluttering the candles—just a soft backdrop that makes session rhythm obvious at a glance.
Time handling is robust and product independent. You can switch between America/New_York and Europe/Berlin presets, and the script builds session windows with explicit timestamps, including overnight ranges such as Tokyo. That means the shading stays aligned even when you change exchanges, symbols, or chart timeframes.
On top of the watermark, Xenia BabyBlue includes a classic EMA 50 for trend bias and a compact two-candle manipulation detector. The logic flags a bullish trap when a bearish candle is followed by a sweep below its low and a close back above its high, and flags the bearish counterpart when a bullish candle is followed by a sweep above its high and a close back below its low. Signals are plotted with soft, unobtrusive labels so they remain visible without overwhelming price action.
The default styling aims for “set and forget.” Still, you can customize the blue intensity, toggle the EMA, and tighten or relax the manipulation rules to match your playbook. The code uses lightweight operations, avoids lookahead, and draws only what is needed per bar, which keeps it responsive on lower timeframes and long histories.
Use Xenia BabyBlue when you want fast session awareness and tidy, actionable hints—whether you’re trading London reversals, New York continuations, or Asia range breaks. It pairs well with ICT-style models, liquidity maps, and structure tools, and it’s intentionally simple to combine with other overlays. Trade focused, not distracted.

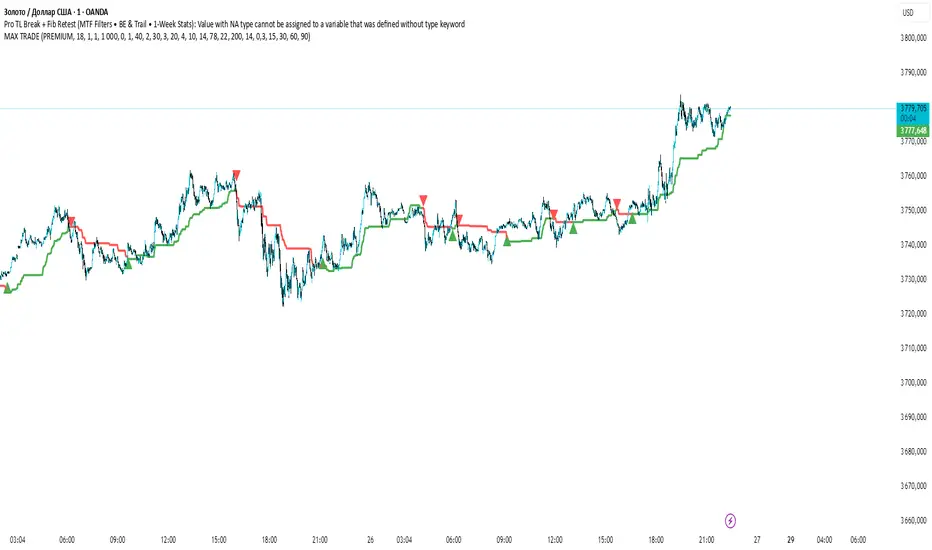
MAX TRADE C1MAX TRADE is designed to identify strong market trends and precise reversal points.
🔹 Built on Fibonacci levels
🔹 Generates Buy & Sell signals
🔹 Calculates Risk/Reward ratios
🔹 Automatically displays TP (Take Profit) and SL (Stop Loss) zones

MAX TRADEMAX TRADE is designed to identify strong market trends and precise reversal points.
🔹 Built on Fibonacci levels
🔹 Generates Buy & Sell signals
🔹 Calculates Risk/Reward ratios
🔹 Automatically displays TP (Take Profit) and SL (Stop Loss) zones