Value Area IndicatorThe Value Area Indicator employs a custom, volatility-weighted moving average formula, which produces a moving average that becomes more reactive during volatile periods. The indicator then provides fibonacci channels above and below the main MA line. The fibonacci channels are sized based on the "golden ratio." This indicator may be helpful to show when the particular cryptocurrency or other instrument is oversold or overbought. If you are looking to add to your position, this indicator can help determine the best times to do so.
比特幣(加密貨幣)

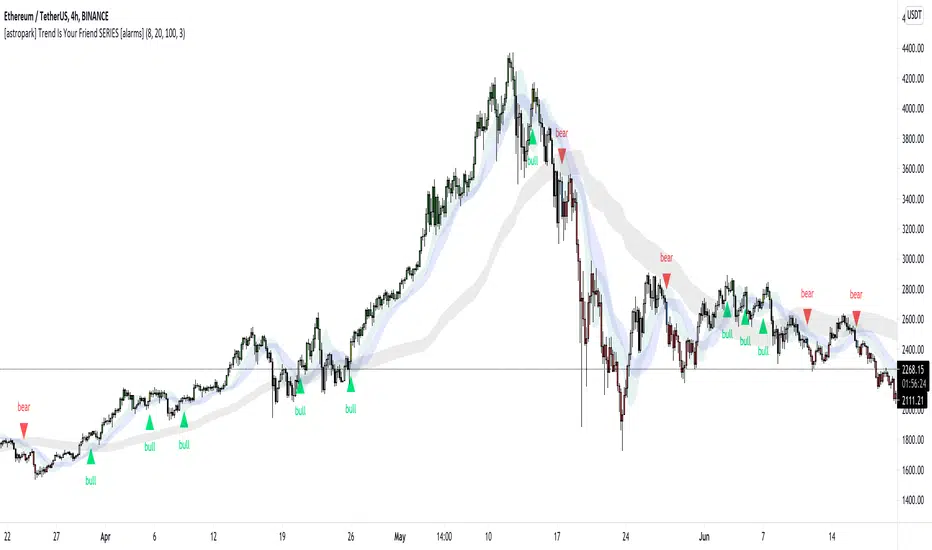
[astropark] Trend Is Your Friend SERIES [alarms]Dear Followers,
today I'm glad to present you an indicator which is a mix of three indicators of mine: Trend Is Your Friend Series !
As you may easily understand from the name, this indicator incorporates all 3 Trend is You Friend indicators I made in past.
This way you can control all of them just with one indicator.
Of course this comes with some useful integration features:
a bull green triangle appears when all trends are bullish (you can set an alert for this)
a bear purple triangle appears when all trends are bearish (you can set an alert for this)
bar coloring reflects the bullish/bearish integration too
you have an option to enable/disable all trends buy/sell signals
you have an option to hide trend clouds borders (chart will be way cleaner this way)
you can still customize each trend indicator settings and set alerts on each trend individually
you can enable/disable heikin ashi analysis
As per Trend is Your Friend V1/V2/V3, this indicator is for higher timeframe trading, from 4h and above is suggested.
This indicator is pretty good for both Swing and Scalping , you can run it over a bot or use it on Renko chart!
If you are a scalper, you will love suggested entries for fast profit. You can run it on 1h timeframe in this case (below is not suggested, there is "no-trend" below 1h!). If you are used to scalp trading, be sure to close each trade whenever you feel happy (a proper trailing stop strategy is suggested for example).
As I always say, all tools are great if you use them correctly: this is not the "Holy Grail", so always use proper money and risk management strategies.
For your reference, here you can see original basic indicators that were integrated here:
V1 backtesting strategy
V2 backtesting strategy
V3 backtesting strategy
This is a premium indicator , so send me a private message in order to get access to this script.
Bubble indicatorA simple and accurate indicator that signals the end of the Bitcoin's bull run. This indicator is an inverted lower Bollinger band , taken from a weekly chart. An interesting observation led to the creation of this indicator: on the weekly chart the lower band takes negative values (the red zone in the indicator) at the end of the Bitcoin's bull run. The advantage of this indicator is that the signal comes in advance.

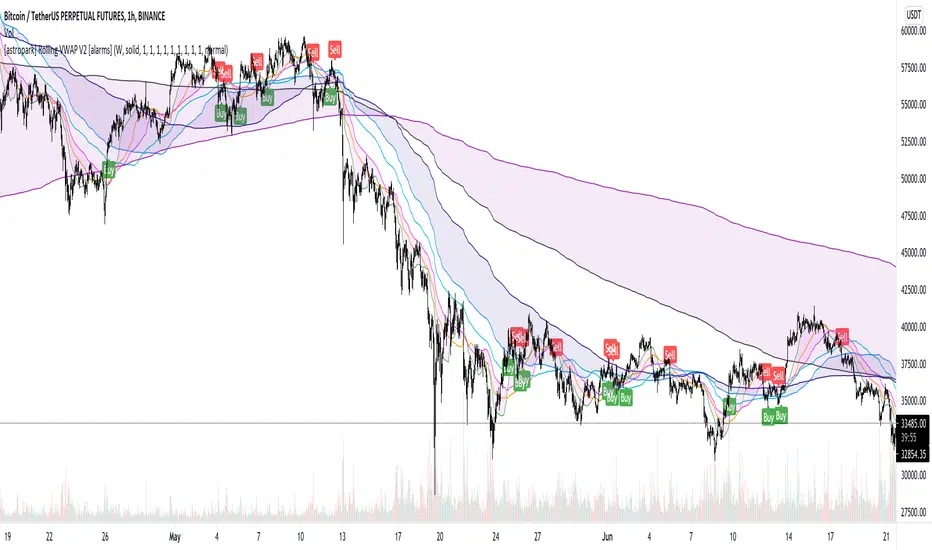
[astropark] Rolling VWAP V2 [alarms]Dear Followers,
today I'm glad to present you yet another awesome Analysis Tool and Strategy, that you may like to use in your trading journey: Rolling VWAP V2 !
This is an upgraded version of my "Progressive VWAP" analysis tool (progressive and rolling are synonymous for me), its description describes quite well what a progressive/rolling vwap is and why they are important to watch:
This indicator can print automatically for you many important Rolling VWAPs:
Daily (D)
2 days (2D)
3 days (3D)
4 days (5D)
Weekly (W)
2 weeks (2W)
Monthly (M)
Quarterly (Q)
Yearly (Y)
As an indicator it will let you:
enable/disable each rolling vwap, change its color and line style and thickness
enable/disable labels and/or price on labels, as well as change their size
As a strategy it will let you:
enable/disable buy/sell signals
choose which strategy to use (all based on rolling vwaps of course)
choose a starting date & time from which to start backtesting
enable/disable individually long and short setups in the backtesting
You should choose low timeframe rolling vwap strategy if you are on a low timeframe, while higher timeframe rolling vwaps are good on medium-high timeframes.
For example D-2D-3D rolling vwap strategies are good at 1h or below, the others on higher timeframes. Backtesting results will help you in understanting this point quite easily.
This indicator works on every timeframe, market and pair. By the way it must be said that, as a bot strategy it has been tested and designed mostly for Bitcoin trading and it works best on 1h or above.
As I always say, all tools are great if you use them correctly: this is not the "Holy Grail", so always use proper money and risk management strategies.
This indicator is the alarms version of the backtesting one you can see here below:
This is a premium indicator , so send me a private message in order to get access to this script.
[astropark] Rolling VWAP V2 [strategy]Dear Followers,
today I'm glad to present you yet another awesome Analysis Tool and Strategy, that you may like to use in your trading journey: Rolling VWAP V2 !
This is an upgraded version of my "Progressive VWAP" analysis tool (progressive and rolling are synonymous for me), its description describes quite well what a progressive/rolling vwap is and why they are important to watch:
This indicator can print automatically for you many important Rolling VWAPs:
Daily (D)
2 days (2D)
3 days (3D)
4 days (5D)
Weekly (W)
2 weeks (2W)
Monthly (M)
Quarterly (Q)
Yearly (Y)
As an indicator it will let you:
enable/disable each rolling vwap, change its color and line style and thickness
enable/disable labels and/or price on labels, as well as change their size
As a strategy it will let you:
enable/disable buy/sell signals
choose which strategy to use (all based on rolling vwaps of course)
choose a starting date & time from which to start backtesting
enable/disable individually long and short setups in the backtesting
You should choose low timeframe rolling vwap strategy if you are on a low timeframe, while higher timeframe rolling vwaps are good on medium-high timeframes.
For example D-2D-3D rolling vwap strategies are good at 1h or below, the others on higher timeframes. Backtesting results will help you in understanting this point quite easily.
This indicator works on every timeframe, market and pair. By the way it must be said that, as a bot strategy it has been tested and designed mostly for Bitcoin trading and it works best on 1h or above.
As I always say, all tools are great if you use them correctly: this is not the "Holy Grail", so always use proper money and risk management strategies.
This is a premium indicator , so send me a private message in order to get access to this script.

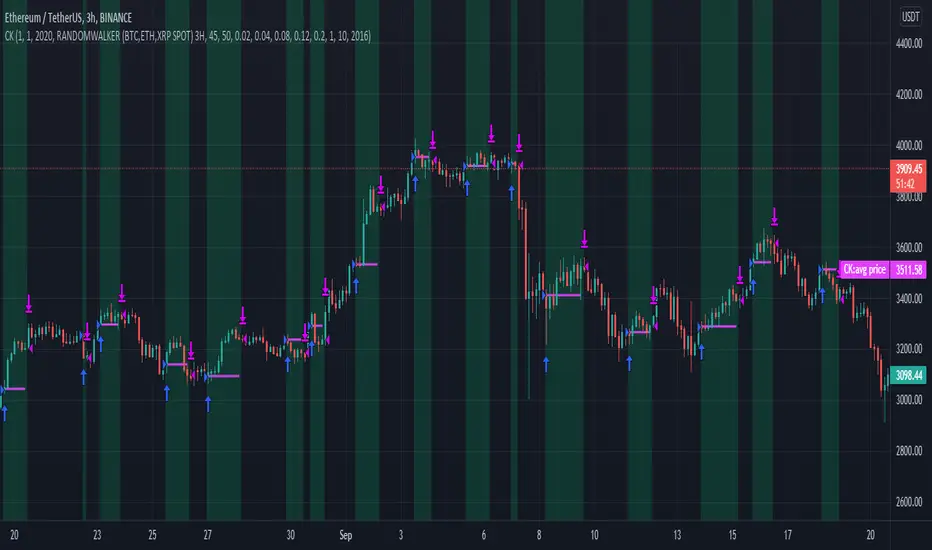
CryptoKillerCryptoKiller is a trend following trading system. It provides entry and exit points, a money management system and a trade management system.
The entry points (fuchsia line) are determined by CryptoKiller Oscillator (see other published script to understand how the oscillator works).
The trade management system provides the exit points in profit and in loss. This script works with multiple take profits (green lines), the initial position is liquidated little by little as the trend reaches the profit targets. Trade management also provides trailing stop exits to save the remaining profits.
Stop loss (red line) take into account the recent past of the chart to be determined, while take profits are fixed and have been calculated based on historical volatility.
The money management system is very simple, it plans to enter a position with a fixed percentage with respect to equity.
CryptoKiller, during an operation, also draws supports and resistances on the chart - determined by the oscillator (orange lines) these supports and resistances are used as a filter to understand where there is the greatest probability of trend development (some entry points provided by the oscillator will therefore not be considered by CryptoKiller as entry points, as in disagreement with the traced supports / resistances).
We know that an error appears in the backtest calculation, where the script is said to suffer from a bias, so the backtest calculation may not be accurate. Actually this happens in high times like H4 or daily, but CryptoKiller is not designed for these timeframes. it is a short-term strategy.
For more information read the author's instructions to contact us, we will send a PDF file with a more complete explanation of the strategy accompanied by screenshots.
Access to this script is granted along with access to CryptoKiller Oscillator.
SWING for GOLD / BITCOIN Hey everyone
I want to share my swing trading system with you.Based on two moving averages coupled to RSI
The options
Shows current trends and entries for trades. Average trade retention 15-20 days
Entries for trades with a crossover of two lines
The percentage of successful test deals XAU/USD for 2010-2021: 69%

Aggregated Perpetuals BasisCONCEPT
The aggregated perpetuals basis compares the prices of perpetual swap contracts in crypto (or "perps" for short) with the price of the spot market.
The idea behind this is that it can help you analyse whether the derivatives market is being overly bullish or bearish.
When the indicator shows positive values (grey colouring by default) it means that perps are trading at higher prices than spot.
Generally speaking we say this is bearish or at least not an ideal scenario to long yourself because most of the time this means that derivatives market participants are too aggressive (overbought territory).
Vice versa when the indicator shows negative values (green colouring by default) it means that there's a spot premium which is considered bullish.
A spot driven market is a healthy market. There could also be a spot premium because market participants that are trading perps are aggressively shorting which puts them at risk of getting short squeezed (again, bullish).
FEATURES
The indicator works for both BTC and ETH.
It's aggregated because it looks at the prices of multiple contracts and it's also volume weighted so that more important markets have a bigger impact.
There are three different types of premiums you can select: coin margin, dollar margin or the combined version.
In crypto there are two types of perpetual swap contracts. Contracts that work with coin margin and contracts that work with dollar margin, which is mostly USDT although FTX for example also accepts other collateral. Sometimes these contracts trade at slightly different prices and you'll notice that there's also a shift in bullishness and importance between these contracts from time to time.
However most of the time the values will be very similar for coin margin and dollar margin.
Markets used for the coin margin perps:
Binance
Bybit
Deribit
Markets used for dollar margin perps:
Binance
Bybit
FTX
The combined premium combines them all.
The spot indices used are:
BXBT (for BTC)
BETH (for ETH)
By default it uses "close" as candle source which means it looks at the premium as if the candle were to close right now.
If you're looking at higher timeframes I suggest using "ohlc4" because there's a lot that happens within one daily candle for example so you might want to use an average candle price (ohlc4 = open+high+low+close/4)
There's a "clamp" feature which puts a cap on extreme values.
Sometimes during capitulation events there's a massive spot premium which dwarfs all the other values and that makes the indicator unreadable.
In such cases the clamp helps to make the indicator useful again.
As you can see I created support and resistance zones (which you can turn off) that max out at 0.4% for bitcoin because by looking at historical data it seems that the premium almost never moves outside of those thresholds (except for those few exceptions during liquidation cascades).
There's also an option to smooth out the values.
TRADING
As discussed earlier, a spot premium is generally speaking considered bullish and a derivatives premium is considered bearish.
It doesn't give buy an sell signals, but it helps you with establishing a bias and gauging general market sentiment.
This in turn can help you with deciding what side of the trade to take and it shows if the conditions are still favourable for you to take the trade you want, because a spot premium for example usually leads to negative funding which makes it interesting to go long.
Send me a private message if you want access so we can discuss it.
Cheers.
Aggregated Futures BasisCONCEPT
An indicator that shows you the futures basis, which is the premium that classic futures contracts are trading at compared to the spot market.
By default its settings are for bitcoin quarterly contracts (closest expiration date), although there's a lot of customizing possible.
You could also use this indicator for other coins but then you'll have to change the inputs.
I'll manually update the contracts when they get close to expiration, but you could do this yourself as well (just in case I disappear for some reason and don't update it anymore).
For more info on what the futures basis is exactly check out this short educational post (click chart):
FEATURES
As previously mentioned, the default settings are for bitcoin.
The index used is the Bitmex BXBT index. It's a dynamic and volume weighted spot index which is perfect to get an average price of the spot market.
If you want to look at the ethereum futures basis for example then I suggest using the BETH Bitmex index, same concept as the BXBT chart but for ETH.
The futures used are quarterly contracts of the most prominent exchanges in crypto.
There's also an option to add an average plot (or only show the average: use the selection box) which calculates the average premium of all the futures contracts selected (you can also choose to exclude certain contracts).
The standard settings show you the premium in percentage terms, but there's also an options to show the annualized premium.
If I don't update the indicator when the contracts expire you'll have to fill in the tickers of the next quarterlies and you'll also have to change the expiration date to make sure this annualized premium still works.
There's a "zero line" you can add which is useful for when the futures get close to backwardation.
And you can set up bullish and bearish signals of your choosing. By default it shows a bull signal when the premium goes below zero and a bear signal when the premium goes above 10 (if you put it on annualized you'll want to change this threshold).
TRADING
The futures basis can be very useful to gauge market sentiment.
It can give you a better idea of how aggressive market participants are by looking at how much the futures are going up or down relatively to spot.
Divergences also often have an impact.
If you want access to this indicator send me a private message so we can discuss it.
Cheers.

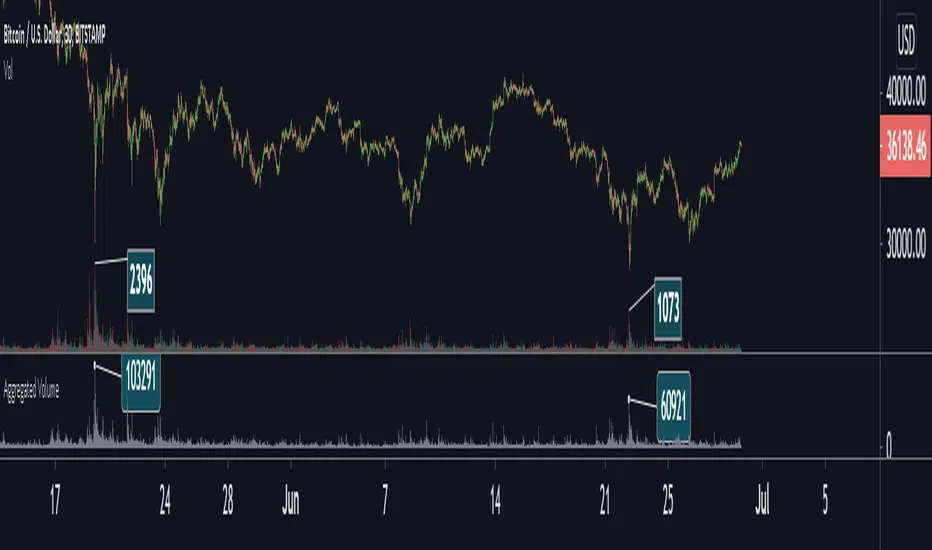
Aggregated VolumeBITSTAMP:BTCUSD
This indicator aggregates trading volume data of assets which are traded on multiple exchanges (like cryptocurrencies, commodities, forex and derivatives) to give you better insights on the markets.
You can change the markets from which the indicator gathers data in the settings under inputs.
By default, data is aggregated from the following markets:
Binance, BTC /USDT
Binance, BTC /BUSD
Bitfinex, BTC /USD
Coinbase, BTC /USD
Bingbon, BTC /USD
Bitstamp , BTC /USD
Kraken, XBT/USD
Gemini, BTC /USD
OkeX, BTC /USDT
Huobi, BTC /USDT
Ichimoku Cloud Strategy Long Only [Bitduke]Slightly modificated and optimized for Pine Script 4.0, Ichimoku Cloud Strategy which, suddenly, good suitable for the several crypto assets.
Details:
Enter position when conversion line crosses base line up, and close it when the opposite happens.
Additional condition for open / close the trade is lagging span, it should be higher than cloud to open position and below - to close it.
Backtesting:
Backtested on SOLUSDT ( FTX, Binance )
+150% for 2021 year, 8% dd
+191% for all time, 32% dd
Disadvantages:
- Small number of trades
- Need to vary parameters for different coins (not very robust)
Should be tested carefully for other coins / stock market. Different parameters could be needed or even algo modifications.
Strategy doesn't repaint.

Cryptocurrency Super-Cycle IndicatorThe Cryptocurrency Super-Cycle Indicator employs a custom volume-weighted algorithm to confirm the overall, long-term trend. This works well on the 4H timeframe, but can be used on any timeframe. The indicator also plots a modified Network Value to Transactions (NVT) Ratio to identify overbought and oversold areas where price could soon reverse.

Bitfinex DataAn indicator with a series of Bitfinex related metrics.
It's easy to use and it has data for both BTC and ETH and it's coin denominated.
Open interest for BTC and ETH on the bottom.
Longs and shorts for both coins.
You can select USD margin or UST (tether) margin.
Long/short ratio.
There's also the possibility to combine everything and look at data for USD and UST margin together.
A straight forward visualisation of changes in longs and shorts.
The indicator is free so if you add it to your favourites you can start using it right away.
Shout out to u/truenomic because we made this indicator together.
You should follow him because he also makes great stuff.
Cheers.

mark strategy2 divergence bot v0.5 for xbtusdHi first of all thanks for read this.
This is my second strategy for make trading, I optimized it for xbtusd with 30 min charts.
You can personalize some setting for reach a better result then me, these are the setting:
this script is only for long trade, so bearish divergence don't work
1)ema1
U can change this value for use another ema and use a faster or slower trend
2)ema2
U can change this value for use another ema and use a faster or slower trend
3)pivot right
U can change this value for watch a number of bar on your right
4)pivot left
U can change this value for watch a number of bar on your left
5)high range
U can change this value for watch a max number of bar
6)low range
U can change this value for watch a min number of bar
7)bullish
U can change this value for enable signal with bullish divergence
8)hidden bullish
U can change this value for enable signal with hidden bullish divergence
9)bearish
U can change this value for enable signal with bearish divergence
10)hidden bearish
U can change this value for enable signal with hidden bearish divergence
11)profit 1 %
U can change this value for the first take profit target
12)profit 2 %
U can change this value for the second take profit target
13)qty target 1 %
U can change this value for close a % of your trade at target 1
14)loss %
U can change this value for close the trade at a % of loss
Have nice day and send me a message if u will earn with my strategy.
If u want my code send me a message
for info send me a message

CRYPTOPRODear traders,
Welcome to CRYPTOPRO indicator. Only for crypto markets! This is an invite only script, please PM me to request permission for testing and access.
This indicator is developed as a scalping, intraday or swingtrade strategy.
Been working on indicators for years now, now back to trading again and made the best possible indicator for different timeframes.
The indicator uses market data, multiple timeframe ma/rsi charts and price action for determining a long or short strategy.
The indicator does not repaint!
I have made the indicator as easy as possible to use with added background colors.
How to use:
- Long strategy: when background turns to green after bar closing.
- Short strategy: when background turns to red after bar closing.
Alerts:
- Alerts are included in the indicator and are very simple to use.
- Alert "buy" for long strategy (green background)
- Alert "sell" for short strategy (red background)
- The alerts can also be used for automated trading/bot trading.
Time Frames :
- Can be used for all different timeframes.
Chart candles:
- Indicator is to be used with standard prince candles.
Note:
- Trading and financial markets are always risky and unpredictable.
- All trades made based on this indicator and his results are always your own responsibility.
- As an author i will not be held responsible for any of your trading profit or loss. Always be cautious when trading.
Charts can be applied to all TV supported crypto charts.
If you find the indicator usefull share your support and feedback in the comments.
Any questions PM me for more info.Thank you!
DISCLAIMER:
No sharing, copying, reselling, or any other forms of use are authorized for our scripts / strategy, and the information published with them.
This script / strategy is strictly for individual use.
This is not financial or investment advice. Investments are always made at your own risk and are based on your personal judgement.
NYTRADE is not responsible for any losses you may incur. Please trade wisely.

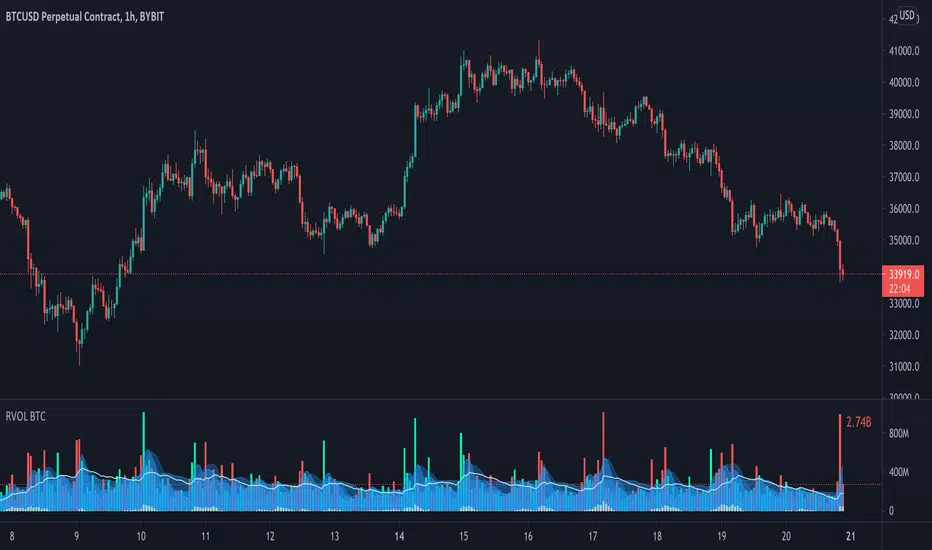
Relative Volume - BITCOINRelative Volume indicator that pulls data from 9 different Bitcoin exchanges. Please note that this indicator only works with BTC and will not use data from your current chart.
Includes the following exchanges:
BYBIT:BTCUSD
BITFINEX:BTCUSD
BITSTAMP:BTCUSD
INDEX:BTCUSD
COINBASE:BTCUSD
FTX:BTCUSD
PHEMEX:BTCUSD
BITTREX:BTCUSD
POLONIEX:BTCUSDT
Wide BarsSimple scripts show the wide range bars within in the look back period, visualizing the bigger momentum.
Added four exponential moving averages which define the trend of the instrument.
Wide range candles in the direction of overall trend on higher timeframes; give confluence of higher participation in the same direction.
Note : Decent volume above the average volume with wide range candle adds more value.

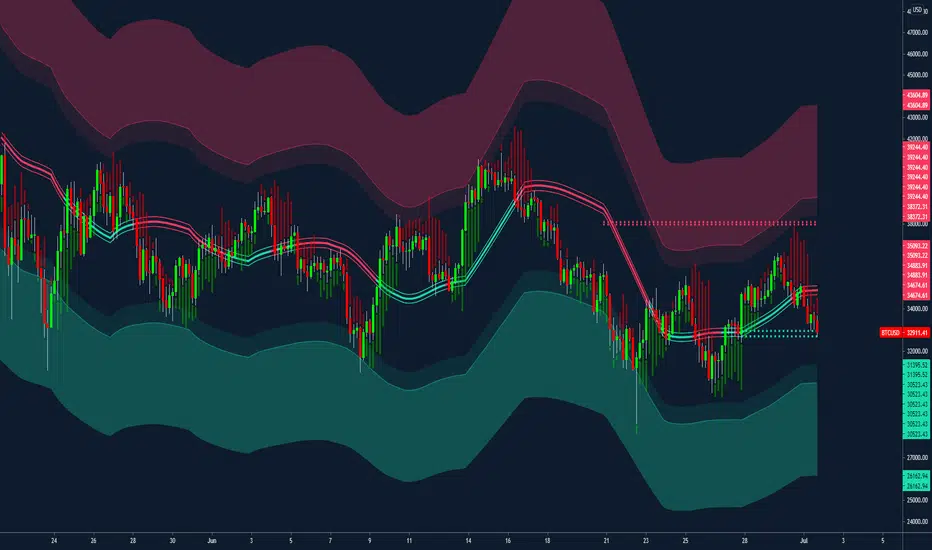
Moonraker 1.3Bespoke Decentrader Mean Reversion Strategy
Colour coded mean line using price and volume
Volatility Bands
Major support and resistance plotted lines
Suggested dynamic hard stop placement
Built for all markets
A realistic strategy for multi-asset portfolio management
Complementary components to assist other indicators/strategies
Key D1 Strategy:
Designed for the 1D+ chart
The overall assumption is that price gravitates towards the mean
The intention is to remain in the market directionally as long as possible
1) Once the asset closes the period above the mean line the asset is considered to be bullish
2) Trader will wait and look to buy close to the developing mean line
3) Trader once filled, remains long
4) If price closes below the mean line, trader will place asks/sell orders close to the developing mean line
5) Trader moves asks along developing mean line until the trade is exited
6) Trader waits in a neutral position until condition 1) is met
Other strategy consideration ;
7) Support and resistance plotted lines can also be used to overrule condition 6) i.e. if the asset falls to a key support area AND trader has already exited, they can look to re-enter and be long to the mean line at which point condition 5) is met
8) Volatility bands can be used as a warning around the deviation from the mean line and probability of reversal
9) Hard stops can be used -> there is a general trade-off between volatility and remaining in the trade – Dynamic hard stops can be used if the trader wishes to add a layer of additional risk management to mitigate unusual volatile events. Should a stop be triggered, waiting for either condition 1) 7) or 8) are met before entering.
Other consideration;
- Works well alongside the Predator indicator; adding additional confluence to the strategy or identifying entries if predator is already within a trend where the initial entry was missed.
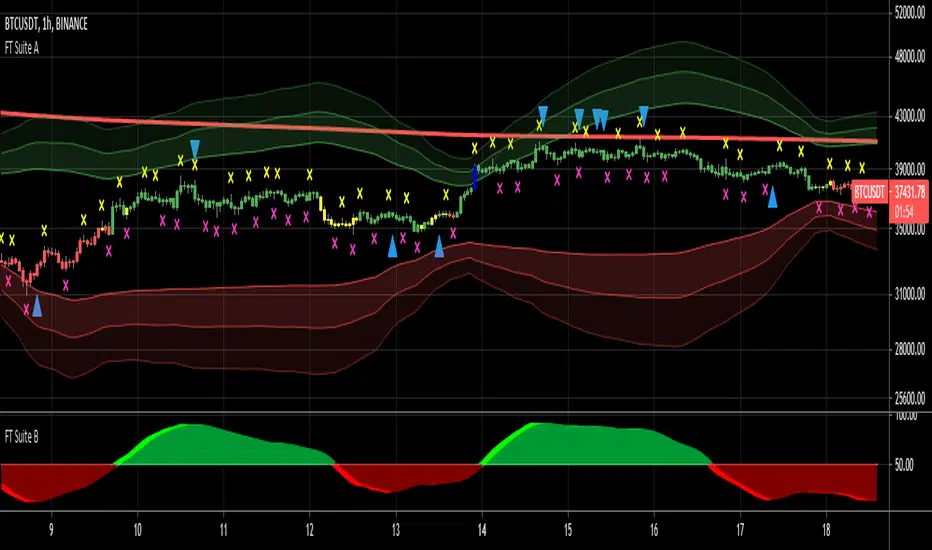
FieryTrading Suite AThis trading suite offers a complete package to traders, both long- and short-term. The idea here is that by combining FieryTrading Suite A and B, one can get a better grip on the markets, thus making more profitable trades. This trading suite is suited for all time frames and assets. Ideally one would combine this trading suite with their own strategies or indicators.
This indicator pack consists of several parts and offers quite some customization.
// FieryTrading Suite A
Bar Trend: the bars will get colored according to the current, short-term, trend. Green is bullish, red is bearish and yellow is neutral. By tweaking the Bar Trend Length one can make the bar trend more or less responsive. Higher lengths are better for long term trading, whereas a shorter length is better for short-term or scalping.
MTF EMA: this is actually two indicators in one. First, we have the EMA on the chart, which is a general current trend indicator. Above the EMA means bullish, under the EMA means bearish. This EMA is also colored according to the long-term trend, which gets pulled from a higher time-frame. Green means long term bullish, red long-term bearish, yellow neutral.
Overshoot Area: the green and red bands around the price are areas where the price might potentially reverse from. This works exceptionally well in consolidating (horizontal) markets. The wider the overshoot area, the stronger the trend. A very tight overshoot area might indicate that the price will soon make a strong move. Increase the overshoot length to make it better suited for long-term. Decrease the length for better detection of small moves.
Extra’s:
1) Extreme bars: when turned on, the bars will color blue if the price reaches a potential strong area of reversal or consolidation. Blue bars are also great areas to exit your current position. Increase the Extreme Multiplier in case you want it less responsive. Decrease the multiplier to quicker spot extreme bars, but with a higher margin of error.
2) FieryTrend: due to its popularity, I’ve decided to included my FieryTrend indicator in the Trading Suite. It’s a great tool to manually find trend lines, resistances and supports. See my FieryTrend indicator for more info.
3) Fractals: when turned on, this option will display fractals on the chart. These fractals are mainly used for stop-loss determination, but can be used for other strategies as well.
4) FT B Reversal: when turned on, this will place reversals of the FieryTrend Suit B on the chart. Make sure to keep the inputs of the FT B indicator the same on both the A and B suite. It might trigger some false-positives, don’t trade this blindly. Wait for the lighter color to completely disappear behind the darker one on FT B.
Alerts: Alerts can be created for Extreme Bars, Bar Trend and FieryTrading Suite B Reversals. Bar trend currently triggers an alert of every bullish / bearish bar, want to make it trigger once in the future, but I’m encountering an unknown bug.
// FieryTrading Suite B
This oscillator tries to give traders an idea of the current trend, as well as trend reversals. The higher the lengths, the bigger the potential trends can become. Be aware that higher lengths are less responsive to market movements. The default inputs are best for most traders. Alerts for this indicator can be made in the FT Trading Suite A, indicated by the blue up / down triangles.
// Potential strategies
There are several potential strategies that one can follow by just looking at the chart. Here are some examples:
1.0 For longer term trades one could simply trade the bar colors. Buy when the bar goes green, sell when it goes red.
1.1 You could exit the trade at either an Extreme Bar or when the price enters the Overshoot Area
1.2 During bullish trends (green bars, green MTF EMA), you could spot potential entries with the FieryTrading Suite B. Enter on every dip on the oscillator. Inverse would be true for shorts.
2.0 You could trade the FT B Reversals during their respective trend. So, trade bearish reversals during a red MTF EMA, bullish reversals during a green MTF EMA.
Never trade one indicator naked. Always use other indicators to confirm your bias.
For take-profit and stop-loss selection I would generally advise to look at the most recent fractal and place the stop above / below the fractal bar. Bullish trades should look at the pink fractal, bearish trades at the yellow fractal. When no fractal is available, look at the reversal bar and apply the same strategy.
For short term trades I’d advise a risk-reward of 1.5, longer term 2 – 2.5.
See the screenshots below for a couple of examples.
For access, please take a look at the "Author's Instructions" below.
(D7R) Bitfinex Longs v Short DominanceSimple script to calculate the % Dominance from Bitfinex's Longs v Short ratio.
Include option to see absolute sum or the difference instead.

The Signal - Hunt Bitcoin CoT Buy/SellThe Signal - Hunt Bitcoin CoT Buy/Sell
Why Bother with another CoT signal?
Its different & focused on the Insider's. The Largest 4 Open Interest Seller and the Largest 4 open Interest Longs, plus the distance they are apart, the Delta, what does high percentage of Largest 4 sellers mean with a low 4 OI Buyers. , what when the usually higher Sellers are low and the largest 4 buyers almost the same value , Time to track the insiders Delta..
Performance -
This Indicator provided a
1. Signal 1 = 26th March 2019 = SUPER LONG at $4,500 that saw a near $14,000 run up
2. Signal 2 = 18th & 24th June 2019 = SHORT at the second & final level $11,700 after repeated attempts & failure in the $13K range, the mini Echo Bitcoin Bull of 2019
3. Signal 3 = 17th December 2019 = LONG $6,900, Bitcoin rallied to Mid $10,500's
4. Signal 4 = 18th Feb 2020 = SUPER SHORT from $9,700's to a final extreme Low of $3,000, calling the CV-19 collapse
5. Signal 5 = 17th March 2020 = LONG from $5,400 no closure point yet
6. Signal 6 = 29th June 2020 = SUPER LONG reiterate from $10,700 no closure sell signal yet
7. Signal 7 = 17th May 2020 = LONG another accumulate LONG with no sell signal yet generated at Post H&S's low of $33,000
Note - This indicator only commences March 2019, as Bitcoin futures were a recent introduction and needed to settle for 6 months in both use and data, no signals were meaningful prior & data was light.
What is Provided. - Please note the need to also add the Hunt Bitcoin Historical Volatility Indicator for full understanding.
We provide 3 things with the 3 indicators.
'Insider' indications from Largest players in the futures market.
1. Bitcoin Macro Buy Signals.
a) The Bitcoin Commitment of Traders results see us focus solely on Largest 4 Short Open Interest & Largest 4 Long Open Interest aspects of the CoT Release data.
When the difference - is tight, a kind of pinch, these have been great Buy signals in Bitcoin.
We call this difference the Delta & When Delta is 5% or less Bitcoin is a Buy.
2. Bitcoin Macro Sells.
a) A sell signal is Triggered in Bitcoin at any point the Largest 4 short OI > or = to 70
3. AMPLIFIER Trade signals 'Super' Longs or Shorts -
Extreme low volatility events leads to highly impulsive & volatile subsequent moves, if either of 1 or 2 above occur, combined with extreme low volatility
a 'Super Long' or 'SUPER SELL' is generated. In the case of the short side, given Bitcoins general expansive and MACRO Bull trend since inception, we seek an additional component
that is an extreme differential/Delta reading between 4 biggest Longs & Shorts OI.
Namely CoT Delta also must be > 47.5%
We also have a Cautionary level, where it is not necessarily a good idea to accumulate Bitcon, as a better opportunity lower may avail itself, see conditions below.
So the required logic explicitly stated below for all Signals.
1. Long - Hunt Bitcoin CoT Delta < or = 5
2. SUPER Long - Hunt Bitcoin CoT Delta < or = 5; and 2 Day Historical Bitcoin Volatility = or < 20
3. Short - Largest 4 Sellers OI = or > 70
4. SUPER Short - Largest 4 Sellers OI = or > 70; AND..
Hunt Bitcoin CoT Delta = or > 47.5 AND 2 Day Historical BTC Volatility = or < 20
5. Caution - Largest 4 Sellers OI = or > 67.5 AND Hunt Bitcoin CoT Delta = or > 45
WARNING SEE Notes Below
Note 1 - = Largest 4 Open Interest Shorts
Note 2 - = Largest 4 Open Interest Longs
Note 3 - = Hunt Cot Delta = (Largest 4 sellers OI) -( Largest 4 Buyers OI)
Caution = Avoid new Bitcoin Accumulation Right Now, A sell signal might follow Enter on next Long
Note 4 - The Hunt Bitcoin COT Delta signal is a Largest 'Insider' Tracking tool based on a segment of Commitment of Traders data on Bitcoin Futures, released once a week on a Friday.
It is a Macro Timeframe signal , and should not be used for Day trading and Short Timeframe analysis , Entries may be optimised after a Hunt Bitcoin CoT Signal is generated by separate shorter Timeframe analysis.
Note 5 - The Historical Bitcoin Volatility is an additional 'Amplifier' component to the 'Hunt Bitcoin Cot Delta' Insider Signal
Note 6 - The Historical Bitcoin Volatility criteria varies by timeframe, the above levels are those applying on a Two Day TF Chart, select this custom timeframe in Trading View.
if additional criteria are met for LONG & SHORT insider signals, they may become 'Super Longs/Shorts', see conditions box above.

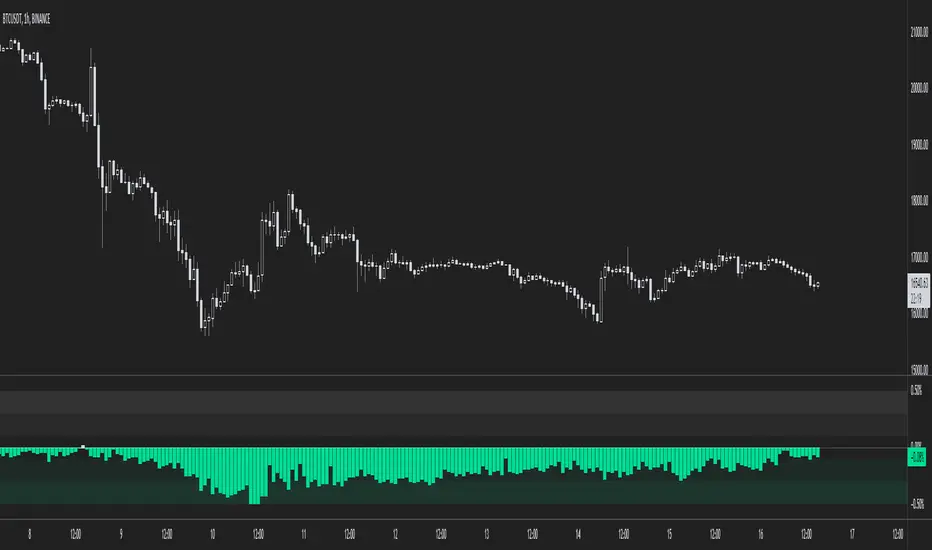
The Amplifier - Two Day Historical Bitcoin Volatility PlotThe 3rd piece to the other two pieces to our CoT study. This is the Amplifier, which turns select signals into 'Super' Buys/Sells
The other two being the 'Bitcoin Insider CoT Delta', and the on chart Price indicator most will have, if no others the 'Hunt Bitcoin CoT Buy/Sell Signals' that will indicate the key signals, ave 4 a year on the chart as they occur.
Why Bother another CoT signal?
Its different & focused on the Insider's.
Performance -
This Indicator provided a
1. Signal 1 = 26th March 2019 = SUPER LONG at $4,500 that saw a near $14,000 run up
2. Signal 2 = 18th & 24th June 2019 = SHORT at the second & final level $11,700 after repeated attempts & failure in the $13K range, the mini Echo Bitcoin Bull of 2019
3. Signal 3 = 17th December 2019 = LONG $6,900, Bitcoin rallied to Mid $10,500's
4. Signal 4 = 18th Feb 2020 = SUPER SHORT from $9,700's to a final extreme Low of $3,000, calling the CV-19 collapse
5. Signal 5 = 17th March 2020 = LONG from $5,400 no closure point yet
6. Signal 6 = 29th June 2020 = SUPER LONG reiterate from $10,700 no closure sell signal yet
7. Signal 7 = 17th May 2020 = LONG another accumulate LONG with no sell signal yet generated at Post H&S's low of $33,000
Note - This indicator only commences March 2019, as Bitcoin futures were a recent introduction and needed to settle for 6 months in both use and data, no signals were meaningful prior & data was light.
What is Provided. - Please note the need to also add the Hunt Bitcoin Historical Volatility Indicator for full understanding.
We provide 3 things with the 3 indicators.
'Insider' indications from Largest players in the futures market.
1. Bitcoin Macro Buy Signals.
a) The Bitcoin Commitment of Traders results see us focus solely on Largest 4 Short Open Interest & Largest 4 Long Open Interest aspects of the CoT Release data.
When the difference - is tight, a kind of pinch, these have been great Buy signals in Bitcoin.
We call this difference the Delta & When Delta is 5% or less Bitcoin is a Buy.
2. Bitcoin Macro Sells.
a) A sell signal is Triggered in Bitcoin at any point the Largest 4 short OI > or = to 70
3. AMPLIFIER Trade signals 'Super' Longs or Shorts -
Extreme low volatility events leads to highly impulsive & volatile subsequent moves, if either of 1 or 2 above occur, combined with extreme low volatility
a 'Super Long' or 'SUPER SELL' is generated. In the case of the short side, given Bitcoins general expansive and MACRO Bull trend since inception, we seek an additional component
that is an extreme differential/Delta reading between 4 biggest Longs & Shorts OI.
Namely CoT Delta also must be > 47.5%
We also have a Cautionary level, where it is not necessarily a good idea to accumulate Bitcon, as a better opportunity lower may avail itself, see conditions below.
So the required logic explicitly stated below for all Signals.
1. Long - Hunt Bitcoin CoT Delta < or = 5
2. SUPER Long - Hunt Bitcoin CoT Delta < or = 5; and 2 Day Historical Bitcoin Volatility = or < 20
3. Short - Largest 4 Sellers OI = or > 70
4. SUPER Short - Largest 4 Sellers OI = or > 70; AND..
Hunt Bitcoin CoT Delta = or > 47.5 AND 2 Day Historical BTC Volatility = or < 20
5. Caution - Largest 4 Sellers OI = or > 67.5 AND Hunt Bitcoin CoT Delta = or > 45
WARNING SEE Notes Below
Note 1 - = Largest 4 Open Interest Shorts
Note 2 - = Largest 4 Open Interest Longs
Note 3 - = Hunt Cot Delta = (Largest 4 sellers OI) -( Largest 4 Buyers OI)
Caution = Avoid new Bitcoin Accumulation Right Now, A sell signal might follow Enter on next Long
Note 4 - The Hunt Bitcoin COT Delta signal is a Largest 'Insider' Tracking tool based on a segment of Commitment of Traders data on Bitcoin Futures, released once a week on a Friday.
It is a Macro Timeframe signal , and should not be used for Day trading and Short Timeframe analysis , Entries may be optimised after a Hunt Bitcoin CoT Signal is generated by separate shorter Timeframe analysis.
Note 5 - The Historical Bitcoin Volatility is an additional 'Amplifier' component to the 'Hunt Bitcoin Cot Delta' Insider Signal
Note 6 - The Historical Bitcoin Volatility criteria varies by timeframe, the above levels are those applying on a Two Day TF Chart, select this custom timeframe in Trading View.
if additional criteria are met for LONG & SHORT insider signals, they may become 'Super Longs/Shorts', see conditions box above.

Low Timeframe POCI have recently made a High Timeframe POC script (HFT POC) which is pretty popular. Thanks for this!
There are many requests to include lower timeframes in this script, that is why I created this script. I could have incorporated all the timeframe POC's into one indicator but I went this route to keep things more organized between all the different timeframes.
Currently included: Daily, 6H, 3H and 1H
/* DEFINITION */
Point Of Control (= POC) is a price level at which the heaviest volumes were traded.
/* HOW TO TRADE WITH THIS INDICATOR */
The basis for POC is determining bias on whichever timeframe you choose.
1. Identify a POC on the timeframe of your choosing.
/* If you choose the lowest timeframe (1H here) then always make sure to look at the higher timeframes to see how it is trading against a HTF POC.
2. When the price is moving away from the POC (either to the upside or downside) this can confirm or invalidate a trade.
3. You can now enter the trade on bias or wait for a retest of the same POC.
/* EXAMPLE TRADES /*
Here is a screenshot of some of the trades that are possible using these Low Timeframe POC's and some common sense.
s3.tradingview.com
